Shiller CAPE Peaches Smell Like BS
June 14, 2014 at 2:08 pm 33 comments

If something sounds like BS, looks like BS, and smells like BS, there’s a good chance you’re probably eyeball-deep in BS. In the investment world, I encounter a lot of very intelligent analysis, but at the same time I also continually step into piles of investment BS. One of those piles of BS I repeatedly step into is the CAPE ratio (Cyclically Adjusted Price-to-Earnings) created by Robert Shiller. For those who are not familiar with Shiller, he is a Nobel Prize winner in economics who won the award in 2013 for his work on the “empirical analysis of asset prices.” Shiller vaulted into fame in large part due to the timing of his book, Irrational Exuberance, which was published during the 2000 technology market peak. He gained additional street-credibility in the mid-2000s when he spoke about the bubble developing in the real estate markets.
What is the CAPE?
Besides being a scapegoat for every bear that has missed the tripling of stock prices in the last five years, the CAPE effectively is a simple 10-year average of the P/E ratio for the S&P 500 index. The logic is simple, like many theories in finance and economics, there often are inherent mean-reverting principles that are accepted as rules-of-thumb. It follows that if the current 10-year CAPE is above the 134-year CAPE average, then stocks are expensive and you should avoid them. On the other hand, if the current CAPE were below the long-term CAPE average, then stocks are cheap and you should buy. Here is a chart of the Shiller CAPE:

As you can see from the chart above, the current CAPE ratio of 26x is well above the 134-year average of 16x, which according to CAPE disciples makes the stock market very expensive. Or as a recent Business Insider article stated, the Shiller CAPE is “higher than at any point in the 20th century with the exception of the peaks of 1929 and 2000 – you know what happened after those.”
Problems Behind the Broken CAPE Tool
There are many problems with Shiller’s CAPE analysis, but let’s start with the basics by first asking, how useful has this tool actually been over the last, 10, 20, or 30 years? The short answer…not very. For example, if investors followed the implicit recommendation of the CAPE for the periods when Shiller’s model showed stocks as expensive (see above chart 1990 – 2014), they would have missed a more than quintupling (+469% ex-dividends) in the S&P 500 index. Over a shorter timeframe (2009 – 2014) the S&P 500 is up +114% ex-dividends (+190% since March 2009).
Even if you purchased at the worst time at the peak of the stock market in 2000 when the CAPE was 44 (S&P 500 – 1553), an investor would still have earned a total return of about +45% from 2000 – 2014, despite the CAPE still being 63% higher (more expensive) than the 134-year CAPE average of 16.
Peaches for $.25 Post-Bubble?
To illustrate a point, let’s assume you are a peach lover and due to a bubble in peach demand, prices spiked to an elevated level of $2.60 per pound for 9 years, but in year 10 the price plummeted to $.25 per pound today (see chart below). Assuming the 134-year average for peach prices was $1.60 per pound, would you still want to purchase your beloved peaches for the fire sale price of $.25 per pound? Common sense tells you $.25/lb. is a bargain, but if you asked the same question to Robert Shiller, he would say absolutely “NO”! The 10-year Peach CAPE ratio would be $2.37 ([9 yrs X $2.60] + [1 yr X $.25]) #1, but since the 10-year CAPE is greater than the LT-Average peach price of $1.60 per pound #2, Shiller would say peaches are too expensive, even though you could go to Kroger (KR) and buy a pound of peaches today for $0.25 #3.
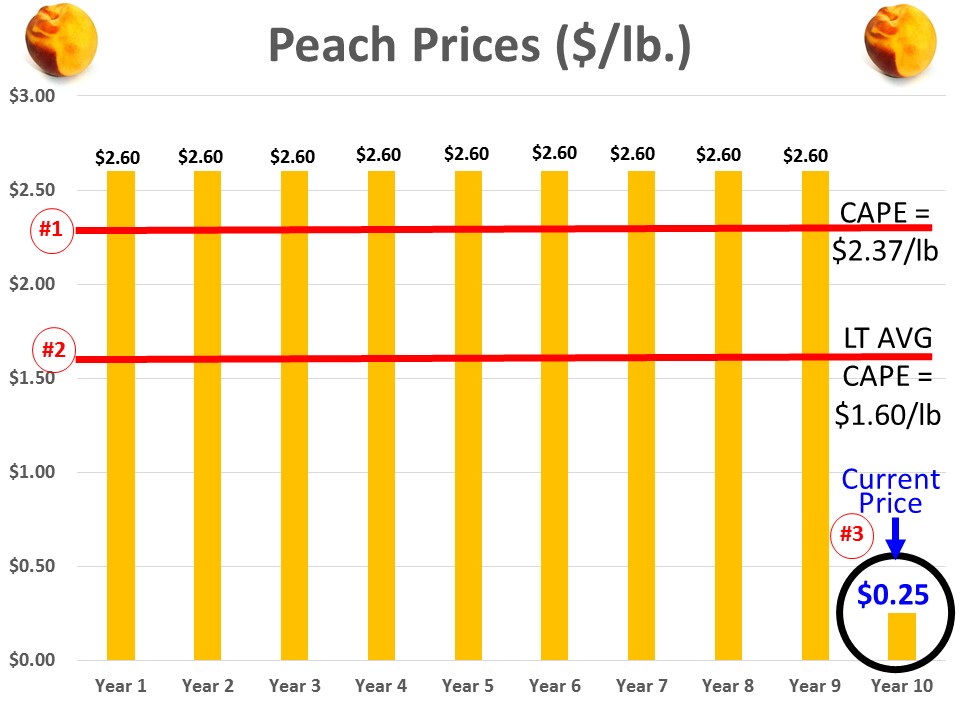
This complete neglect of current market prices in the calculation of CAPE makes absolutely no sense, but this same dynamic of ignoring current pricing reality is happening today in the stock market. Effectively what’s occurring is the higher P/E ratios experienced over the last 10 years are distorting the Shiller CAPE ratio, thereby masking the true current value of stocks. In other words the current CAPE of 26x vastly exaggerates the pricey-ness of the actual S&P 500 P/E ratio of 16x for 2014 and 14x for 2015.
There are plenty of other holes to poke into CAPE, but the last major component of Shiller’s ratio I want to address is interest rates. Even if you disregard my previous negative arguments against Shiller’s CAPE, should anyone be surprised that the ratio troughed in the early 1980s of 7x when long-term interest rates peaked. If I could earn 18% on a CD with little risk in 1981, not many people should be dumbfounded that demand for risky stocks was paltry. Today, the reverse environment is in place – interest rates are near record lows. It should therefore come as no surprise, that all else equal, a higher P/E (and CAPE) is deserved when interest rates are this low. Nevertheless, this discussion of P/E and CAPE rarely integrates the critical factor of interest rates.
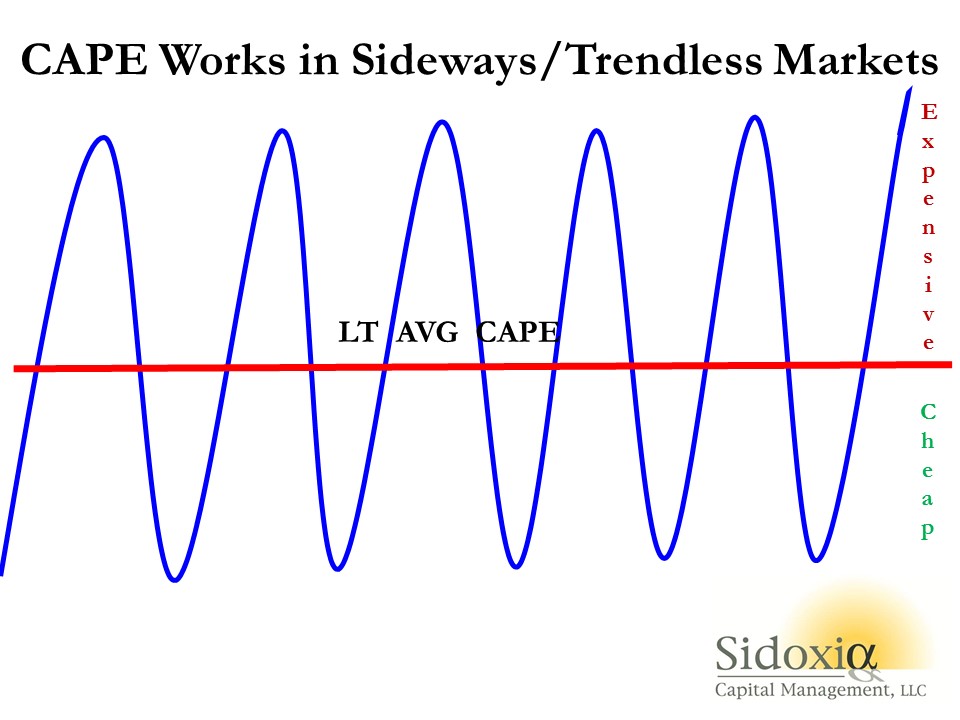
While I have spent a decent amount of time trashing the CAPE-BS ratio, I want to give my pal Bob Shiller a fair shake. I can do this by looking into a mirror and admitting there are periods when the CAPE ratio can actually work. Although the CAPE is effectively useless during long, multi-year upward and downward trending markets (think bubbles & depressions), the CAPE makes perfect sense in sideway, trendless markets (see chart below).
The investing public is always looking for a Holy Grail financial indicator that will magically guide them to riches in both up and down markets. Despite the popularity of Shiller’s CAPE ratio, regrettably no one perfect indicator exists. So before you jump on the bandwagon and chase the hot indicator du jour, make sure to look down and make sure you haven’t stepped in any Shiller CAPE-BS.
Wade W. Slome, CFA, CFP®
Plan. Invest. Prosper.
DISCLOSURE: Sidoxia Capital Management (SCM) and some of its clients hold long positions in certain exchange traded funds, but at the time of publishing SCM had no direct position in KR, or any other security referenced in this article. No information accessed through the Investing Caffeine (IC) website constitutes investment, financial, legal, tax or other advice nor is to be relied on in making an investment or other decision. Please read disclosure language on IC Contact page.
Entry filed under: Financial Markets, Profiles. Tags: CAPE, Cyclically Adjusted Price-to-Earnings, irrational exuberance, P/E ratios, Robert Shiller, S&P 500.
33 Comments Add your own
Leave a comment
Trackback this post | Subscribe to the comments via RSS Feed


1. Shiller CAPE Peaches Smell Like BS – Investing Caffeine | Marty Investor | June 16, 2014 at 2:45 am
[…] CAPE is Nonsense […]
2. Forecasting Versus Trading/Investing | Prudent Trader | June 16, 2014 at 4:24 am
[…] Subprime Loan Risks (Bloomberg) The Biology of Risk (NY Times) Shiller CAPE Peaches Smell Like BS (Investing Caffeine) Here’s Why the Student Loan Market Is Completely Insane (Businessweek) A Bazillionaire’s […]
3. 10 Monday AM Reads | The Big Picture | June 16, 2014 at 6:34 am
[…] Can you handle the market’s stress test? (MoneyBeat) • Shiller CAPE Peaches Smell Like BS (Investing Caffeine) • Michael Lewis: A Bazillionaire’s Guide to Stress Relief (Bloomberg […]
4. Brian | June 16, 2014 at 6:52 am
Sorry but that peach analogy is completely wrong (and I’m not a CAPE believer). But the CAPE ratio does reflect current market prices, and after plummeting in price the “peach CAPE” would absolutely scream buy. The CAPE only looks at today’\s market price relative to ten year’s of earnings data. I guess if you want to stick with peaches (and you shouldn’t) it would compare today’s price of peaches with the number of peaches you’re buying, which would always be one. So CAPE would go down in parallel with price.
5. realist50 | June 16, 2014 at 11:47 am
Brian is absolutely correct. Wade misunderstands how CAPE is calculated.
That said, Wade does make some good points about interest rates. The lack of yield in fixed income assets today does get to a big problem for anyone saying to get out of stocks. What are they saying is a good investment instead? Long-term bond yields are below long-term averages. Are they saying to keep money in cash and short-term fixed income securities – which offers a negative real return today – and then buy after the stock market has declined in value? That’s a dangerous strategy.
It’s also worth asking – what’s the appropriate period to look at the CAPE average? Is the 19th century valuation of financial assets that relevant to today? Is it really appropriate to include earnings during the Great Depression, or valuations during two World Wars?
6. sidoxia | June 16, 2014 at 1:32 pm
Dave:
Good points. The CAPE would have much more value if it took out the extreme peaks and valleys, which distort the usefulness of the CAPE ratio.
~WS
7. sidoxia | June 16, 2014 at 6:58 pm
Like the peaches, here’s another example of an index staying the same for 9 yrs then dropping in year 10. The distorted earnings number in years 2 through 5 distorts the current 10-year CAPE. Despite price going down in year 10 (1000 –>800…down -20%) and earnings going up modestly (99–>100), the artificially high CAPE (13.3x) makes index seem more expensive than reality (8x current PE).
Yr 1 Price (1,000); Yr 2 P (1,000); Yr 3 P (1,000);Yr 4 P (1,000);Yr 5 P (1,000);Yr 6 P (1,000);Yr 7 P (1,000);Yr 8 P (1,000); Yr 9 P (1,000); Yr 10 P (800)
Yr 1 Earnings (100); Yr 2 E (1); Yr 3 E (1); Yr 4 E (1); Yr 5 E (1);Yr 6 E (99); Yr 7 E (99); Yr 8 E (99);Yr 9 E (99); Yr 10 E (100);
10-Year Avg Earnings = 600/10 = 60
Yr 1 P/E (10); Yr 2 P/E (1000); Yr 3 P/E (1000); Yr 4 P/E (1000); Yr 5 P/E (1000); Yr 6 P/E (10); Yr 7 P/E (10); Yr 8 P/E (10); Yr 9 P/E (~10); Yr 10 P/E (8);
10-Year CAPE = 13.3x (800/60) vs Actual P/E 8x
CAPE distorted by 66% higher than actual P/E.
8. Brian | June 17, 2014 at 2:16 am
Well, this example is a CAPE calculation, so that’s an improvement, but it has nothing to do with the peaches. To demonstrate the point, just eliminate your ten years of prices in this example. These prices are exactly the same as your peach analogy. As you’ll see, if you delete the line for ten years of prices, nothing will have changed. The CAPE will still be 13.3 and the actual p/e will still be 8. The price dropping in year 10, for the peaches or the new example, is 100% irrelevant.
The troublesome part of this new example is it shows you really don’t understand the whole point of CAPE. You say that CAPE is “distorted” by 66% when it’s the exact opposite. First, I think you still think it’s distorted because of the change in price, when it’s not. It’s “distorted” in your view by the change in earnings. And it’s really the opposite of distorted. CAPE considers one year of earnings distorted, so the whole point is to average ten years to remove distortions. For example, in year 3 or 4, the p/e would be 1000 vs a CAPE of 13.3 You’re calling the CAPE distorted when clearly the regular p/e is the distorted ratio. So CAPE solves that by averaging ten years of earnings. Now you may think the company in your example has solved all its previously issues and that earnings will now permanently stay at the 100 level. CAPE disagrees and says on average earnings mean revert so you should expect them to peak and trough going forward. If that’s the case then the average earnings of 60 is more representative of the company’s earnings power for the next ten years. I think that point is worthy of debate, but has nothing to do with your peaches analogy.
9. sidoxia | June 18, 2014 at 9:41 pm
Whether peaches is the best analogy or not is irrelevant, the analysis doesn’t change. Distorted historical earnings distort the CAPE P/E ratio. In many instances, the actual current P/E ratio is much more pertinent for forward-looking valuation purposes. Often earnings one year from now are going to be much more correlated with the recent 12-mos earnings than earnings calculated 10 years ago (as is the case with CAPE). As I wrote in my article, the CAPE makes sense in certain markets and is useless in others. Unlike many fervent Shiller CAPE believers, I understand there are many valuation metrics that provide investors a better estimate of intrinsic value (e.g., Price/Free Cash Flow, EV/EBITDA, DCF, Price/Sales, Trailing-Forward P/E, etc.). Unfortunately, many bears cling to the CAPE as the Holy Grail metric and as a rationalization for missing the massive bull market over the last five years.
10. Kirk Kinder | June 16, 2014 at 8:05 am
Shiller readily admits that the CAPE is a poor predictor of returns. He also doesn’t advocate not investing when the CAPE is above the historical average, which your example shows. What it does a fabulous job of predicting is future returns over the medium term (10 years). Here you would have a difficult time rebutting the use of the CAPE. We are at levels in CAPE that historically provide ensuing 10 year returns of 2.8% per year.
11. sidoxia | June 16, 2014 at 1:23 pm
Kirk: I realize CAPE is not intended to be a short-term indicator, but when stocks collapsed -55% from the peak in 2009 before about tripling in the subsequent five years, one would expect the medium term (10 years) future return outlook to imply above average returns – not the case in 2009. As for the 2.8% you are implying, when the CAPE was at these levels in 2007, after seven years, we have handily achieved returns above that.
12. Larry McClanahan | June 16, 2014 at 9:43 am
Wade, do you REALLY think that Shiller or his “CAPE disciples,” as you call them, would pass up an opportunity to buy “peaches” (stocks) if current price dropped by 85% to 90% vs. CAPE? No, they’d back-up the truck and buy with both hands. Same for a price drop of “only” 40% to 50%. Either of those scenarios would represent the very mean reversion that’s at the heart of a proper application of CAPE. While there may be reasonable arguments against CAPE, claiming it’s BS sort of doesn’t fly when your own peaches analogy seems a bit disingenuous itself.
13. sidoxia | June 16, 2014 at 1:05 pm
Larry: Thanks for the note. As the chart shows, stock prices dropped by more -50% in 2008-2009 and the CAPE only got down to the 134-year average.
-WS
14. Larry McClanahan | June 16, 2014 at 2:12 pm
. . . which exactly makes my point . . . CAPE got down to the 134-year average because it mean-reverted. Of course, it sprang right back up this time (QE anyone?) instead of spending years on the underside. But properly applied, CAPE isn’t used to find a mechanistic trigger point at which to buy (i.e. only buy when CAPE is lower than 12). Rather, it’s a valuation tool that provides an indication of likely future returns over the next 10 years or so. In turn, depending on one’s portfolio management approach, that informs where the real risks are and decision-making on what equities should be held at the time.
15. Steve | June 16, 2014 at 11:36 am
The earlier post @Brian is correct in stating the peach analysis doesn’t work. You’re confusing prices with ratios.
16. sidoxia | June 16, 2014 at 1:30 pm
You’re right, a peach does not have a numerator and a denominator, but like a P/E ratio, lower prices implies a better value (all else equal). Another way to think about it is a peach has a P/E (Price/Enjoyment) ratio. Assuming every peach has the same enjoyment, a lower price will always indicate a better value just like the P/E would for the S&P 500.
17. What Is the Validity of Dr. Shiller's CAPE Ratio? | June 18, 2014 at 10:50 am
[…] There has been an ongoing debate about Dr. Robert Shiller’s Cyclically Adjusted Price Earnings (CAPE) ratio and its current validity. Critics argue that the earnings component of CAPE is just too low, changes to accounting rules have suppressed earnings, and the financial crisis changed everything. The latest was by Wade Slome: […]
18. 10 Monday AM Reads | FAN FICTION PLANET | June 19, 2014 at 2:36 am
[…] Can you handle the market’s stress test? (MoneyBeat) • Shiller CAPE Peaches Smell Like BS (Investing Caffeine) • Michael Lewis: A Bazillionaire’s Guide to Stress Relief (Bloomberg […]
19. Shiller’s CAPE: Is It Really Just BS? | Elliott Wave Analytics | June 23, 2014 at 8:01 pm
[…] There has been an ongoing debate about Dr. Robert Shiller’s Cyclically Adjusted Price Earnings (CAPE) ratio and its current validity. Critics argue that the earnings component of CAPE is just too low, changes to accounting rules have suppressed earnings, and the financial crisis changed everything. The latest was by Wade Slome: […]
20. Armando Alizo | June 25, 2014 at 1:46 pm
The market is overvalued based on MANY metrics, not just CAPE. I won’t repeat the extensive analysis provided by John Husssman on his site (www.hussmanfunds.com) on this topic.
But here’s the thing: Valuation is demonstrably useless for predicting 1-5 year returns, it is only useful for predicting expected returns over a 7-12 year timeframe. An irrationally exuberant market can always get more so, and vice versa. So don’t use the CAPE or any valuation metric to time the market, but be aware that it is overvalued, and that Buy&Hold investors will NOT be treated kindly over the next decade.
21. Enjoy Your Weekend Reading on the CAPE | The Big Picture | August 22, 2014 at 11:36 am
[…] Asness, Michael Kitces, Mebane Faber, Jeremy Siegel, Salil Mehta, Stephen E. Wilcox, Doug Short, Wade Slome, Erik Kobayashi-Solomon, Ben Carlson and Jesse Livermore. If you want a crash course in CAPE, spend […]
22. Enjoy Your Weekend Reading on the CAPE | FAN FICTION PLANET | August 23, 2014 at 2:42 pm
[…] Asness, Michael Kitces, Mebane Faber, Jeremy Siegel, Salil Mehta, Stephen E. Wilcox, Doug Short, Wade Slome, Erik Kobayashi-Solomon, Ben Carlson and Jesse Livermore. If you want a crash course in CAPE, spend […]
23. langley Realtor | October 13, 2014 at 12:59 pm
langley Realtor
Shiller CAPE Peaches Smell Like BS | Investing Caffeine
24. Mathematics 101: The Cheap Money Printing Machine And CAPE | Your Child Feels Best! | October 29, 2014 at 7:44 am
[…] and bullion hoarding bears have clung to a distorted, money-losing Shiller CAPE P/E ratio (see CAPE Smells Like B.S.), that has wrongly signaled investors to stay out of bonds and skip trillions of dollars in cost […]
25. Still not cheap | USA TODAY | February 12, 2015 at 11:29 am
[…] In addition, this magnitude confirms a vigilance sent by Robert Shiller’s cyclically-adjusted price-earnings ratio, that averages increase over 10 years to well-spoken out a cycle. The CAPE is now during 26.5, not as high as it was in 2000 though good above a ancestral average. The same goes for a Q ratio, a magnitude of share prices relations to a deputy cost of net assets, championed by Andrew Smithers; a dual ratios lane any other closely as can be seen here. There are many critics of CAPE who argue, for example, that accounting practices have altered so much that comparison with past distinction measures are incomprehensible or that it fails to take comment of a prevailing turn of seductiveness rates. […]
26. Still not cheap | Economic World | News | February 12, 2015 at 12:25 pm
[…] In addition, this magnitude confirms a vigilance sent by Robert Shiller’s cyclically-adjusted price-earnings ratio, that averages increase over 10 years to well-spoken out a cycle. The CAPE is now during 26.5, not as high as it was in 2000 though good above a ancestral average. The same goes for a Q ratio, a magnitude of share prices relations to a deputy cost of net assets, championed by Andrew Smithers; a dual ratios lane any other closely as can be seen here. There are many critics of CAPE who argue, for example, that accounting practices have altered so much that comparison with past distinction measures are incomprehensible or that it fails to take comment of a prevailing turn of seductiveness rates. […]
27. Still not cheap | loans consult | February 12, 2015 at 3:42 pm
[…] with past distinction measures are incomprehensible or that it fails to take comment of a prevailing turn of seductiveness rates. It is loyal that conjunction CAPE nor a Q ratio are many use as short-term marketplace indicators […]
28. Equity markets: Still not cheap | Cek Kulkass | February 12, 2015 at 3:46 pm
[…] that comparison with past profit measures are meaningless or that it fails to take account of the prevailing level of interest rates. It is true that neither CAPE nor the Q ratio are much use as short-term market indicators although […]
29. Still not cheap | canada sunday | February 12, 2015 at 3:59 pm
[…] with past distinction measures are incomprehensible or that it fails to take comment of a prevailing turn of seductiveness rates. It is loyal that conjunction CAPE nor a Q ratio are many use as short-term marketplace indicators […]
30. Vincent | January 15, 2017 at 1:12 pm
Of course you make money in the stock market over longer time periods: the stock market, including dividends, went up by about 9% per year since 1871.
The CAPE Index shows when it is RELATIVELY better to buy stocks.
Wade also doesn’t understand how the CAPE Index is calculated as others have noticed. It’s good to buy peaches when the price is $0.25
About the low value of CAPE Index in early 1980s because of high interest values: That was actually a very good time to buy stocks (together with bonds).
Now the interest rates are low and rising. This IS a bad time to buy stocks, as CAPE index indicates.
No explanation is given why CAPE works in sideways/trendless markets.
31. Shiller’s CAPE – Is It Really Just B.S. – Part I | RIA | March 20, 2017 at 3:44 am
[…] But the debate over the value, and current validity, of the Shiller’s CAPE ratio, is not new. Critics argue that the earnings component of CAPE is just too low, changes to accounting rules have suppressed earnings, and the financial crisis changed everything. This was a point made by Wade Slome previously: […]
32. Shiller's CAPE: Is It Really Just B.S.? – Part 1 - Investing Matters | March 20, 2017 at 10:26 am
[…] But the debate over the value, and current validity, of the Shiller’s CAPE ratio, is not new. Critics argue that the earnings component of CAPE is just too low, changes to accounting rules have suppressed earnings, and the financial crisis changed everything. This was a point made by Wade Slome previously: […]
33. Shiller's CAPE: Is It Really Just B.S.? – Part 1 | ValuBit News | March 20, 2017 at 11:15 am
[…] But the debate over the value, and current validity, of the Shiller’s CAPE ratio, is not new. Critics argue that the earnings component of CAPE is just too low, changes to accounting rules have suppressed earnings, and the financial crisis changed everything. This was a point made by Wade Slome previously: […]