Posts tagged ‘P/E ratios’
The Rollercoaster December to Remember

Last month turned out to be a memorable one for stock market investors, but unforgettable for many of the wrong reasons. Santa Claus left more dark coal than shiny gifts, judging by the -9.2% correction last month in the S&P 500 index, making it the worst December since 1931. Overall, the damage for the year was much more palatable, down -6.2% for the 12-month period. This result contrasts with the +9.5% gain in 2016, +19.4% gain in 2018, and +276.0% gain achieved since the March 2009-low.
If I were to compare 2017 and 2018 to an amusement park, 2017 was more like a calm train ride (slow, smooth, and steady), while 2018 was more like a rollercoaster (fast, and rocky with lots of ups and downs). Stock market history tells us that on average stock prices should fall -5% three times per year and -10% one-time per year. Well, 2017 was like a walk in the park if you consider there were no -5% or -10% dips during the year, whereas in 2018, we had -12% and -20% corrections, before bouncing somewhat during the last week of the year. Rollercoaster rides can be fun, but if the bumpy ride lasts too long, park visitors will likely need a sick sack.
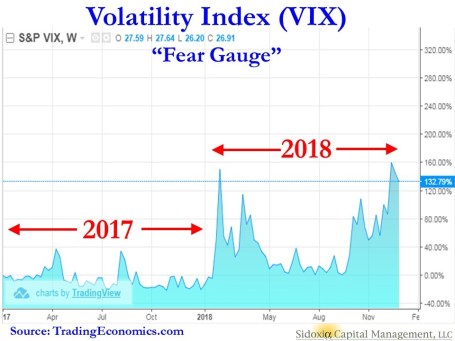
The heightened level of volatility can be seen in the Fear Gauge or the Volatility Index – VIX (see chart above), which has been bouncing around like a spiking cardiogram in response to the following news headlines:
- Government Shutdown
- Global Trade (China)
- Federal Reserve Interest Rate Policy
- Mueller Investigation
- New Balance of Power in Congress
- Brexit Deal Uncertainty
- Recession Fears
While there have been some signs of slowing growth in key areas like automobile and home sales, the overall economy has been doing quite well on the back of consumer spending, which accounts for upwards of 70% of our country’s economic activity (see GDP chart below). In fact, recently released Mastercard consumer retail holiday spending data grew +5.1% to a record level exceeding $850 billion.
Corporations, which are also helping propel continued growth in our $20 trillion economy, are producing record profits, as you can see from the chart below. This in turn has led to an amazingly low unemployment rate of 3.7%, the lowest jobless figure posted in 49 years.
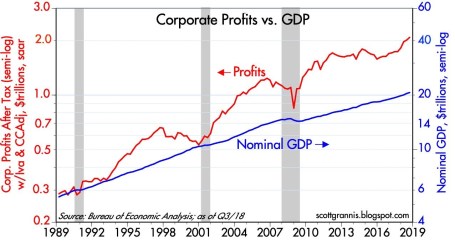
Source: Calafia Beach Pundit
Overall, economic fundamentals may remain strong, but in the face of the positive data points, fears of an impending recession overpowered the good news last month, resulting in stock prices that are much more attractively valued right now. For example, if you are shopping at a department store, it’s much more advantageous for the buyer to purchase items on sale versus paying full price. Or as the most successful investor of all-time, Warren Buffett, famously notes, “Be fearful when others are greedy and greedy only when others are fearful.” And recently, investors have been very fearful. As you can see from the chart below, prices as measured by the Price-Earnings ratio (P/E) are below the long-term, multi-decade average. This fact is even more relevant in light of the historically low inflation and interest rates (10-Year Treasury Note at 2.69%). Unsurprisingly, during the 1970s and early 1980s, double digit interest rates and inflation were relatively high leading to low, single digit P/E stock ratios over many years.
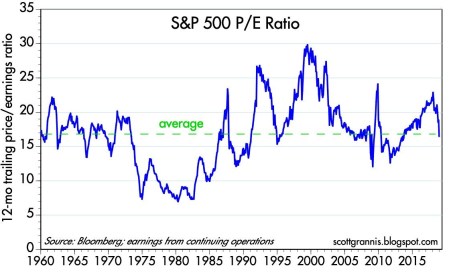
Source: Calafia Beach Pundit
Just because stock prices went down last month, does not mean they cannot go even lower. However, the rollercoaster ride experienced in recent months, coupled with the fresh turn of the calendar year, provide investors a perfect opportunity to revisit their asset allocation and potentially rebalance your portfolios to meet your long-term objectives and constraints. More attractive equity prices improves the timing of this exercise. Regardless, the adrenaline-filled ups and downs may be feel scary now, but the ride will be more enjoyable if you buckle up don’t lose sight of your long-term goals.

Wade W. Slome, CFA, CFP®
Plan. Invest. Prosper.
This article is an excerpt from a previously released Sidoxia Capital Management complimentary newsletter (January 4, 2018). Subscribe on the right side of the page for the complete text.
DISCLOSURE: Sidoxia Capital Management (SCM) and some of its clients hold positions and certain exchange traded funds (ETFs), but at the time of publishing had no direct position in any other security referenced in this article. No information accessed through the Investing Caffeine (IC) website constitutes investment, financial, legal, tax or other advice nor is to be relied on in making an investment or other decision. Please read disclosure language on IC Contact page.
Sports, Stocks, & the Magic Quadrants
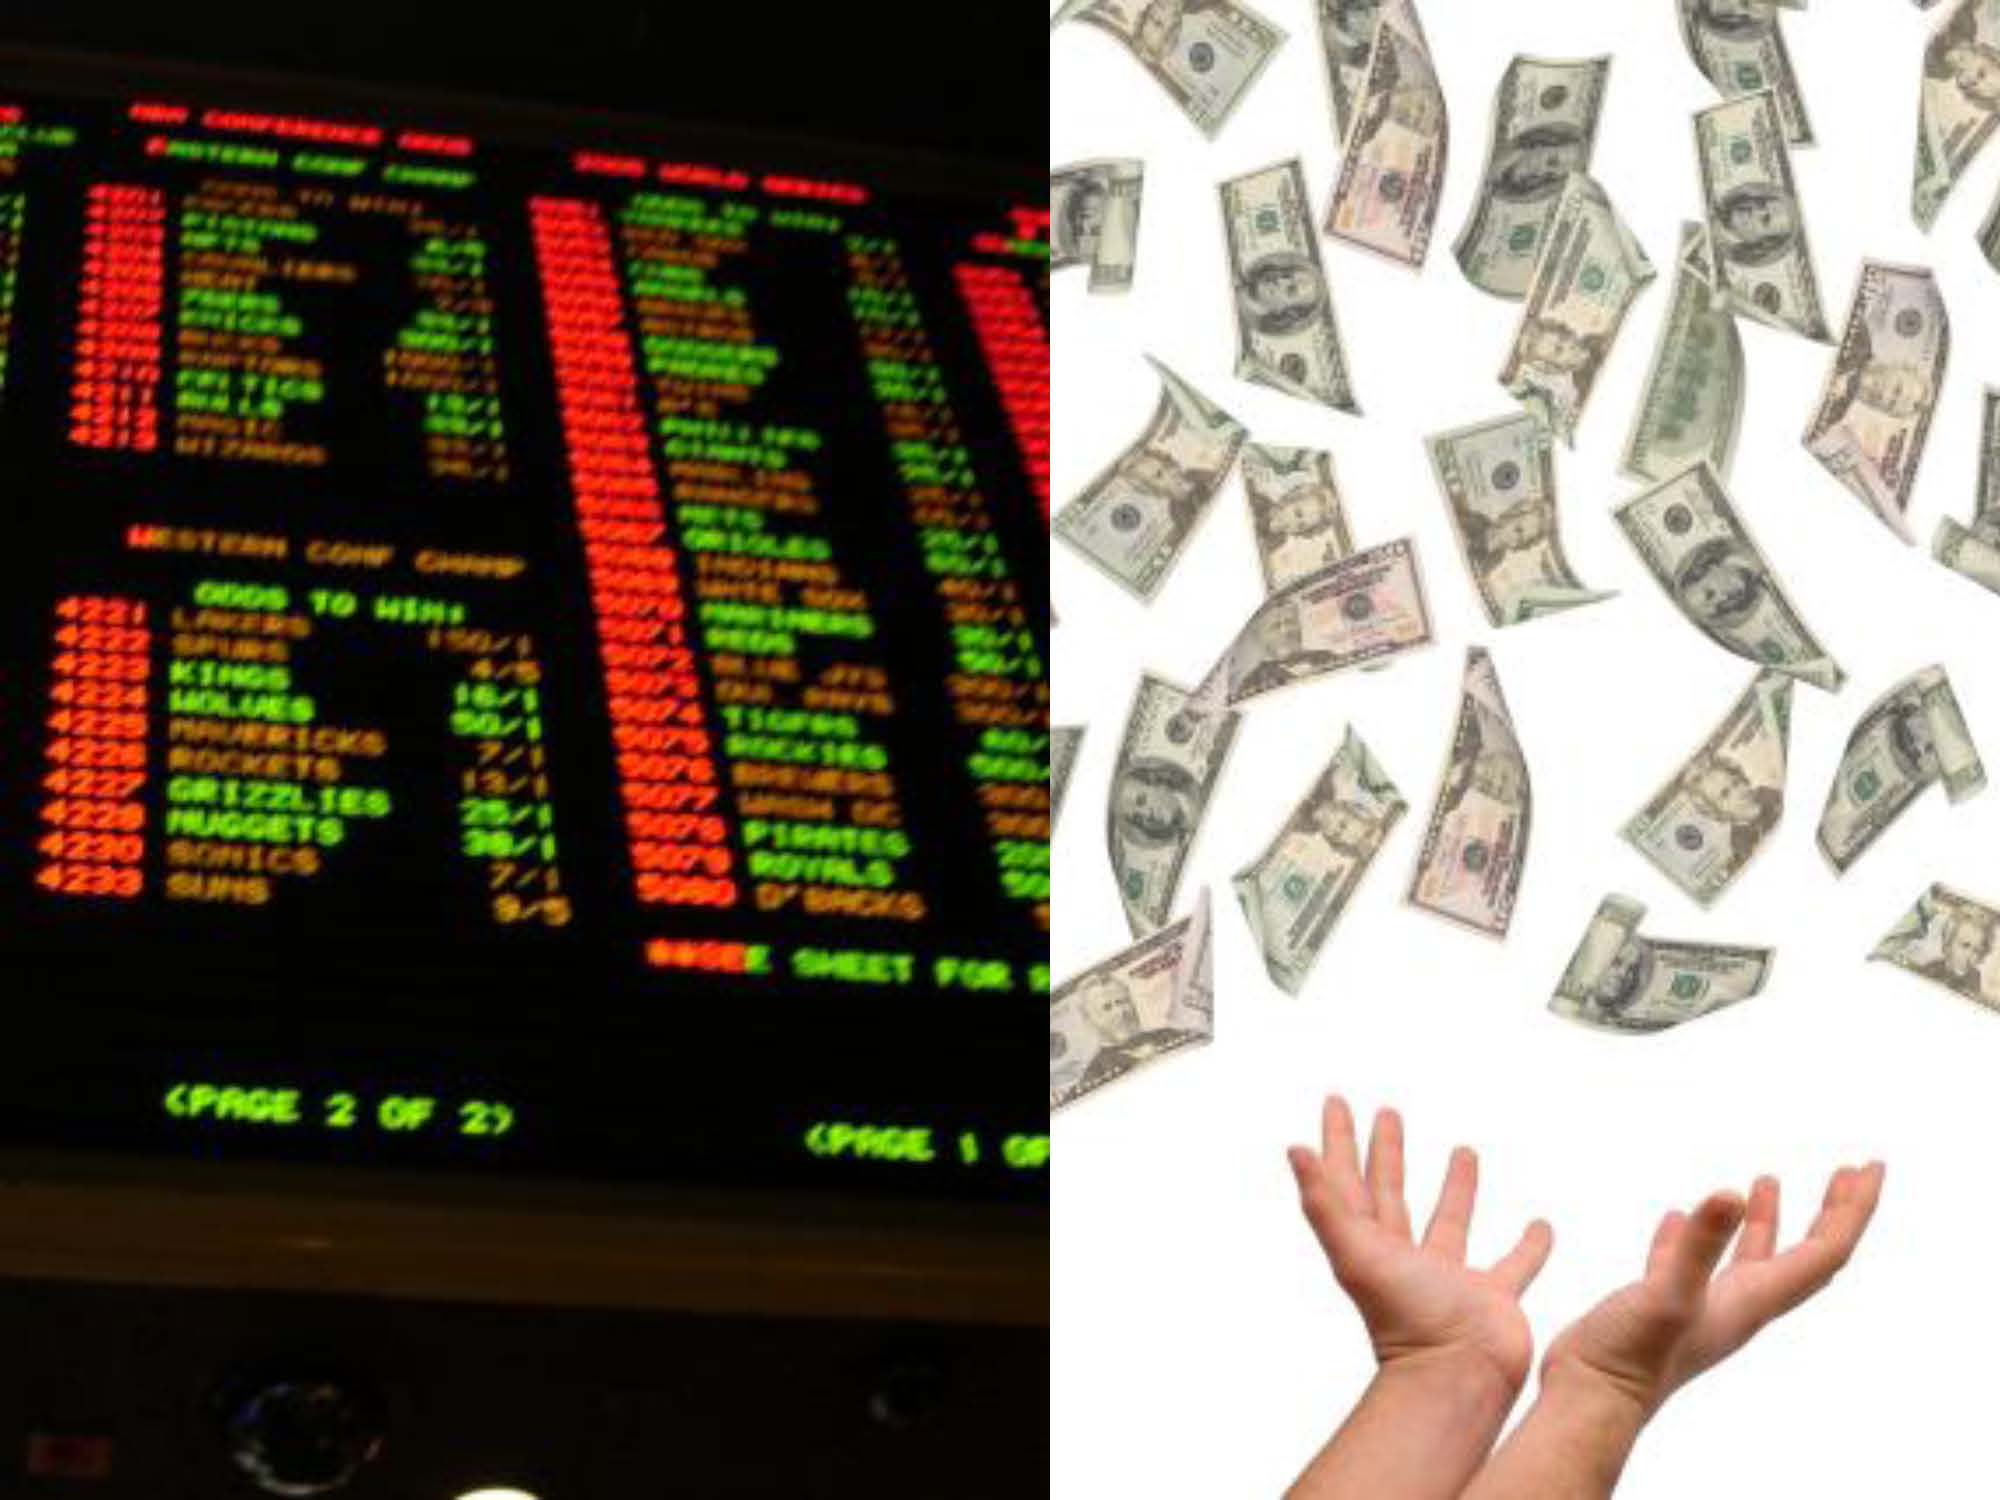
Picking stocks is a tricky game and so is sports betting. With the NFL and NCAA football seasons only a few months away, we can analyze the professional sports-betting industry to better understand the complexities behind making money in the stock market. Anybody who has traveled to Las Vegas, and bet on a sporting event, understands that simply choosing a game winner is not enough for a casino to pay you winnings. You also need to forecast how many points you think a certain team will win or lose by (i.e., the so-called “spread”) – see also What Happens in Vegas, Stays on Wall Street. In the world of stocks, winning/losing is not measured by spreads but rather equities are measured by valuation (e.g., Price/Earnings or P/E ratios).
To make my point, here is a sports betting example from some years back:
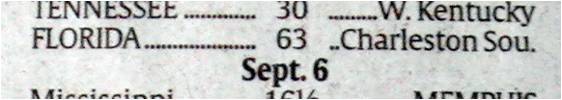
Florida Gators vs. Charleston Southern Buccaneers: Without knowing a lot about the powerhouse Southern Buccaneers squad from South Carolina, 99% of respondents polled before the game are likely to unanimously select the winner as Florida – a consistently dominant, nationally ranked powerhouse program. The tougher question becomes trickier if football observers are asked, “Will the Florida Gators win by more than 63 points?”(see picture below). Needless to say, although the Buccs kept it close in the first half, and only trailed by 42-3 at halftime, the Gators still managed to squeak by with a 62-3 victory. Importantly, if you had bet on this game and placed money on the Florida Gators, the overwhelming pre-game favorite, the 59 point margin of victory would have resulted in a losing wager. In order for Gator fans to win money, they would have needed Florida to win by 64 points.
If investing and sports betting were easy, everybody would do it. The reason sports betting is so challenging is due to very intelligent statisticians and odds-makers that create very accurate point spreads. In the investing world, a broad swath of traders, market makers, speculators, investment bankers, and institutional/individual investors set equally efficient valuations over the long-term.
The goal in investing is very similar to sports betting. Successful professionals in both industries are able to consistently identify inefficiencies and then exploit them. Inefficiencies occur for a bettor when point spreads are too high or low, while investors identify inefficient prices in the marketplace by shorting expensive stocks and buying cheap stocks (i.e., undervalued or overvalued).
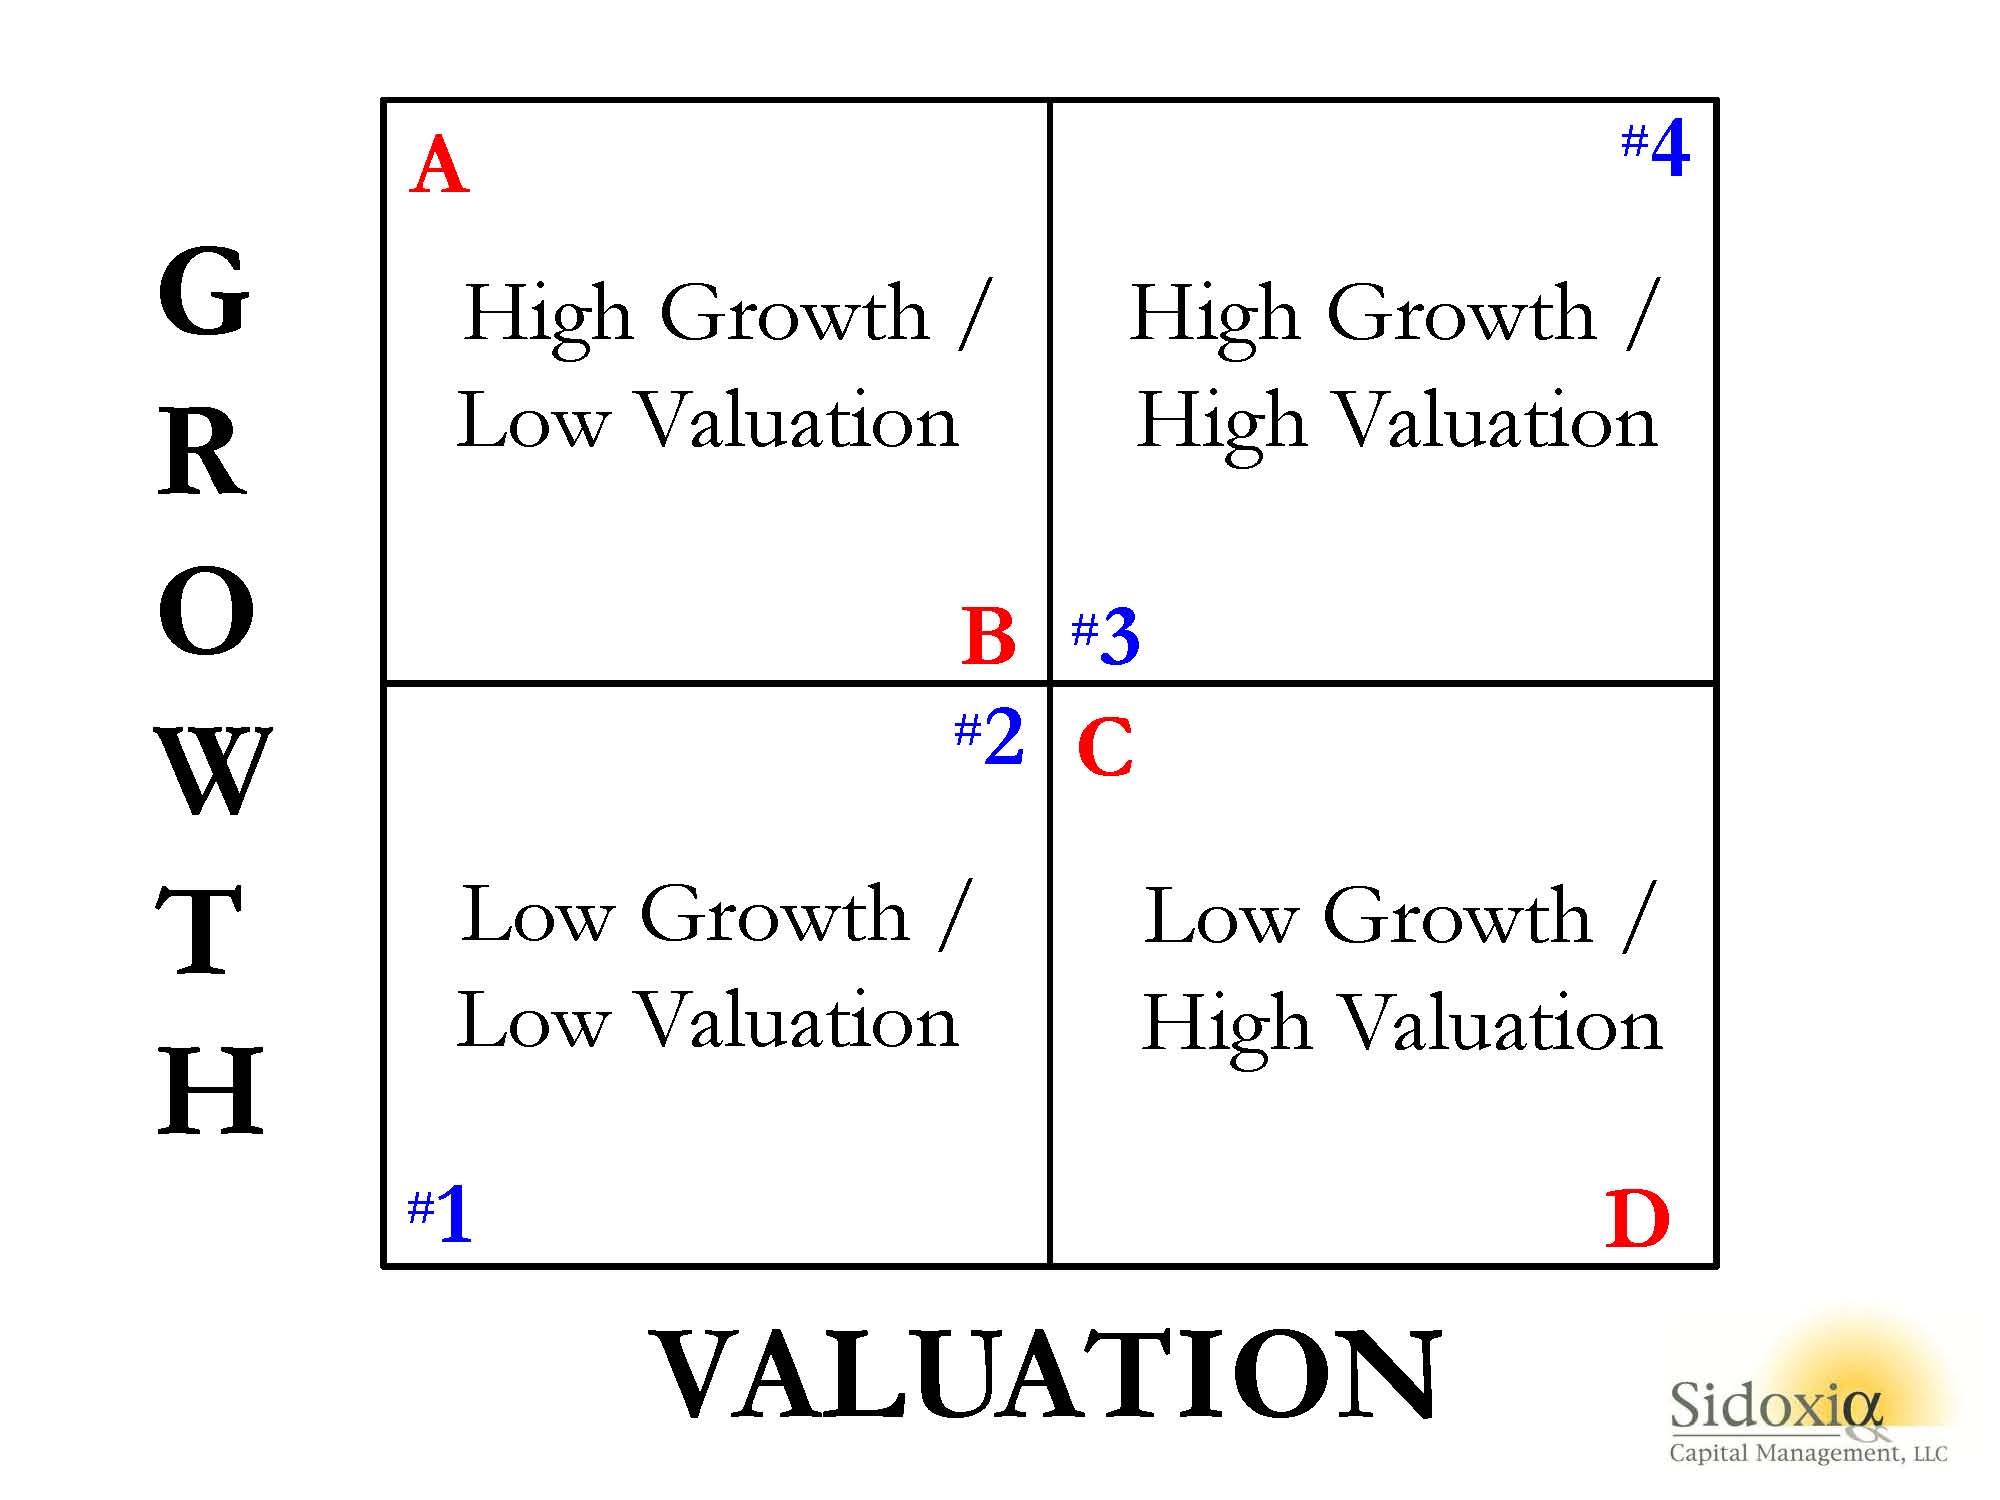
To illustrate my point, let’s take a look at Sidoxia’s “Magic Quadrant“:
 A-B-Cs & 1-2-3s
What Sidoxia’s “Magic Quadrant” demonstrates is a framework for evaluating stocks. By devoting a short period of time reviewing the quadrants, it becomes apparent fairly quickly that Stock A is preferred over Stock B, which is preferred over Stock C, which is preferred over Stock D. In each comparison, the former is preferred over the latter because the earlier letters all have higher growth, and lower (cheaper) valuations. The same relative attractive relationships cannot be applied to stocks #1, #2, #3, and #4. Each successive numbered stock has higher growth, but in order to obtain that higher growth, investors must pay a higher valuation. In other words, Stock #1 has an extremely low valuation with low growth, while Stock #4 has high growth, but an investor must pay an extremely high valuation to own it.
While debating the efficiency of the stock market can escalate into a religious argument, I would argue the majority of stocks fall in the camp of #1, #2, #3, or #4. Or stated differently, you get what you pay for. For example, investors are paying a much higher valuation (high P/E) for Tesla Motors, Inc (TSLA) for its rapid electric car growth vs. paying a much lower valuation (low P/E) for Pitney Bowes Inc (PBI) for its more mature mail equipment business.
The real opportunities occur for those investors capable of identifying companies in the upper-left quadrant (i.e., Stock A) and lower-right quadrant (i.e., Stock D). If the analysis is done correctly, investors will load up on the undervalued Stock A and aggressively short the expensive Stock D. Sidoxia has its own proprietary valuation model (Sidoxia Holy Grail Ranking – SHGR or a.k.a. “SUGAR”) designed specifically to identify these profitable opportunities.
The professions of investing and sports betting are extremely challenging, however establishing a framework like Sidoxia’s “Magic Quadrants” can help guide you to find inefficient and profitable investment opportunities.
Wade W. Slome, CFA, CFP®
Plan. Invest. Prosper.
DISCLOSURE: Sidoxia Capital Management (SCM) and some of its clients hold positions in certain exchange traded funds (ETFs) and TSLA, but at the time of publishing, SCM had no direct position in PBI, or any other security referenced in this article. No information accessed through the Investing Caffeine (IC) website constitutes investment, financial, legal, tax or other advice nor is the information to be relied on in making an investment or other decision. Please read disclosure language on IC Contact page.
Sleeping and Napping Through Bubbles

We have lived through many investment bubbles in our history, and unfortunately, most investors sleep through the early wealth-creating inflation stages. Typically, the average investor wakes up later to a hot idea once every man, woman, and child have identified the clear trend…right as the bubble is about burst. Sadly, the masses do a great job of identifying financial bubbles at the end of a cycle, but have a tougher time realizing the catastrophic consequences of exiting a tired winner. Or as strategist Jim Stack states, “Bubbles, for the most part, are invisible to those trapped inside the bubble.” The challenge of recognizing bubbles explains why they are more easily classified as bubbles after a colossal collapse occurs. For those speculators chasing a precise exit point on a bubblicious investment, they may be better served by waiting for the prick of the bubble, then take a decade long nap before revisiting the fallen angel investment idea.
Even for the minority of pundits and investors who are able to accurately identify these financial bubbles in advance, a much smaller number of these professionals are actually able to pinpoint when the bubble will burst. Take for example Alan Greenspan, the ex-Federal Reserve Chairman from 1987 to 2006. He managed to correctly identify the technology bubble in late-1996 when he delivered his infamous “irrational exuberance” speech, which questioned the high valuation of the frothy, tech-driven stock market. The only problem with Greenspan’s speech was his timing was massively off. Stated differently, Greenspan was three years premature in calling out the pricking of the bubble, as the NASDAQ index subsequently proceeded to more than triple from early 1997 to early 2000 (the index exploded from about 1,300 to over 5,000).
One of the reasons bubbles are so difficult to time during their later stages is because the deflation period occurs so quickly. As renowned value investor Howard Marks fittingly notes, “The air always goes out a lot faster than it went in.”
Bubbles, Bubbles, Everywhere
Financial bubbles do not occur every day, but thanks to the psychological forces of investor greed and fear, bubbles do occur more often than one might think. As a matter of fact, famed investor Jeremy Grantham claims to have identified 28 bubbles in various global markets since 1920. Definitions vary, but Webster’s Dictionary defines a financial bubble as the following:
A state of booming economic activity (as in a stock market) that often ends in a sudden collapse.
Although there is no numerical definition of what defines a bubble or collapse, the financial crisis of 2008 – 2009, which was fueled by a housing and real estate bubble, is the freshest example in most people minds. However, bubbles go back much further in time – here are a few memorable ones:
Dutch Tulip-Mania: Fear and greed have been ubiquitous since the dawn of mankind, and those emotions even translate over to the buying and selling of tulips. Believe it or not, some 400 years ago in the 1630s, individual Dutch tulip bulbs were selling for the same prices as homes ($61,700 on an inflation-adjusted basis). This bubble ended like all bubbles, as you can see from the chart below.

Source: The Stock Market Crash.net
British Railroad Mania: In the mid-1840s, hundreds of companies applied to build railways in Britain. Like all bubbles, speculators entered the arena, and the majority of companies went under or got gobbled up by larger railway companies.
Roaring 20s: Here in the U.S., the Roaring 1920s eventually led to the great Wall Street Crash of 1929, which finally led to a nearly -90% plunge in the Dow Jones Industrial stock index over a relatively short timeframe. Leverage and speculation were contributors to this bust, which resulted in the Great Depression.
Nifty Fifty: The so-called Nifty Fifty stocks were a concentrated set of glamor stocks or “Blue Chips” that investors and traders piled into. The group of stocks included household names like Avon (AVP), McDonald’s (MCD), Polaroid, Xerox (XRX), IBM and Disney (DIS). At the time, the Nifty Fifty were considered “one-decision” stocks that investors could buy and hold forever. Regrettably, numerous of these hefty priced stocks (many above a 50 P/E) came crashing down about 90% during the 1973-74 period.
Japan’s Nikkei: The Japanese Nikkei 225 index traded at an eye popping Price-Earnings (P/E) ratio of about 60x right before the eventual collapse. The value of the Nikkei index increased over 450% in the eight years leading up to the peak in 1989 (from 6,850 in October 1982 to a peak of 38,957 in December 1989).

Source: Thechartstore.com
The Tech Bubble: We all know how the technology bubble of the late 1990s ended, and it wasn’t pretty. PE ratios above 100 for tech stocks was the norm (see table below), as compared to an overall PE of the S&P 500 index today of about 14x.

Source: Wall Street Journal – March 14, 2000
The Next Bubble
What is/are the next investment bubble(s)? Nobody knows for sure, but readers of Investing Caffeine know that long-term bonds are one fertile area. Given the generational low in yields and rates, and the 35-year bull run in bond prices, it can be difficult to justify heavy allocations of inflation losing bonds for long time-horizon investors. Commercial real estate and Silicon Valley unicorns could be other potential over-heated areas. However, as we discussed earlier, identifying and timing bubble bursts is extremely challenging. Nevertheless, the great thing about long-term investing is that probabilities and valuations ultimately do matter, and therefore a diversified portfolio skewed away from extreme valuations and speculative sectors will pay handsome dividends over the long-run.
Many traders continue to daydream as they chase performance through speculative investment bubbles, looking to squeeze the last ounce of an easily identifiable trend. As the lead investment manager at Sidoxia Capital Management, I spend less time sucking the last puff out of a cigarette, and spend more time opportunistically devoting resources to valuation-sensitive growth trends. As demonstrated with historical examples, following the popular trend du jour eventually leads to financial ruin and nightmares. Avoiding bubbles and pursuing fairly priced growth prospects is the way to achieve investment prosperity…and provide sweet dreams.
Wade W. Slome, CFA, CFP®
Plan. Invest. Prosper.
DISCLOSURE: Sidoxia Capital Management (SCM) and some of its clients hold positions in certain exchange traded funds (ETFs), MCD, DIS and are short TLT, but at the time of publishing SCM had no direct positions in AVP, XRX, IBM,or any other security referenced in this article. No information accessed through the Investing Caffeine (IC) website constitutes investment, financial, legal, tax or other advice nor is to be relied on in making an investment or other decision. Please read disclosure language on IC Contact page.
Growth Stocks – Cheaper by the Day

Are you a value investor? If you said “yes,” how would you feel about buying an $18 stock with a P/E (Price/Earnings) ratio of greater than 100x and a Price/Sales ratio of 14x for a company that three years earlier was started in a garage? This may not sound like a value stock, but had you bought this stock at the initial public offering (IPO), it would have been a screaming bargain – priced at less than 1x P/E ratio, based on this year’s earnings estimates.
You may be surprised to know, this company with a meager $18 IPO share price is now worth $9,192 per share today (if you adjust for three stock splits)! Yes, that’s correct, a +50,900% return. If you are wondering to which stock I’m referring, I am talking about Amazon.com Inc. (AMZN). Incredibly, ever since Amazon went public in 1997, the CEO Jeff Bezos has managed to command the start-up e-commerce company from $31 million in revenues to $121 billion (with a “b”) on an annual basis in 2016 (a +389,000% increase).
Discovering the next IPO that turns into a $363 billion behemoth is easier said than done, and unfortunately these types of companies are a rare breed. Even if you are lucky enough to identify these diamonds-in-the-rough, early in their growth cycle, very few investors have the fortitude and discipline to continually own the stocks through the perpetual volatility (i.e., peaks and valleys).
The good news is, although you may be unable to find every unicorn out there, you can still apply the same principles and characteristics to any growth stock you invest in. In order to prudently achieve outsized returns, one must identify innovative market leaders that have gained some type of sustainable competitive advantage, which will serve as the profit and cash flow growth engine for the stock over the long-term.
If a company does not have a unique advantage over industry competitors, they will likely be unable to compound earnings growth – the key to becoming a big winner. Albert Einstein, Nobel Prize winner is credited with identifying compounding as the “eighth wonder of the world,” and without compounding there will be no gigantic results.
Amazon may be a rare breed, but there are plenty of other examples of so-called “expensive” stocks that get dismissed or fall through the cracks as they explode in value to the stratosphere. Consider Starbucks Corp. (SBUX), which at the time of its IPO in 1992 was priced at a very rich P/E of 52x. Sound expensive? Actually, this was a greatest offer in a generation. Adjusted for stock splits, the IPO shares were valued at $0.27 – in the most recent trading session Starbucks shares closed at $55.90, a +20,600% increase. Similar to Amazon, had you purchased Starbucks shares at the IPO price, you would have been paying less than a measly, eye-popping 1x P/E ratio based on 2016 earnings.
Alphabet Inc. (GOOGL), formerly Google Inc., is another case of growth stock appearing pricey on the outside, but really a value of a lifetime on the inside. The hype surrounding the Google IPO was so palpable in 2004, the stock priced at a relatively nose-bleed level of 60x P/E level, approximately. The unconventional auction bidding method to buy the initial shares made investors even more skeptical. Suffice it to say, the greater than +1,600% gain has once again shown that investors can reap handsome rewards, if they do thorough enough due diligence and ignore the illusory big ticket IPO prices.
What most investors fail to realize is that P/E ratios are temporary. By purchasing a growth stock, the numerator of the P/E ratio (price) becomes static or fixed. As earnings of a growth company expand, the stock becomes cheaper by the day. More specifically, the numerator of the P/E (price) is flat, while the denominator (earnings) grows, thereby making the P/E ratio smaller (cheaper). And as you can see from the few previous examples I have provided, if you are able to identify winners, and hold them long enough, you will eventually realize the initial hefty price tag at purchase will be considered almost free after all the earnings compounding.
Legendary growth investor Peter Lynch summed it up concisely when he noted, “People concentrate too much on the P, but the E really makes the difference.” Lynch goes on to highlight the importance of patience in growth investing because stocks often go down or move sideways for long periods of time before dramatic increases occur:
“My best stocks performed in the 3rd year, 4th year, 5th year, not in the 3rd week or 4th week.”
I’ve illustrated a few successful examples of meteoric growth stocks, but more importantly the misconception many investors place on the current P/E ratio. There still is no substitute for hard-nosed, detailed fundamental research for finding big growth winners, because true growth stocks bought and held for a long enough period, will become cheaper by the day. If you don’t have the time, discipline, or patience to execute this winning strategy, find and hire an experienced investment manager who understands these concepts.
Wade W. Slome, CFA, CFP®
Plan. Invest. Prosper.
DISCLOSURE: Sidoxia Capital Management (SCM) and some of its clients hold positions in certain exchange traded funds (ETFs), AMZN, and GOOGL, but at the time of publishing had no direct position in SBUX, or any other security referenced in this article. No information accessed through the Investing Caffeine (IC) website constitutes investment, financial, legal, tax or other advice nor is to be relied on in making an investment or other decision. Please read disclosure language on IC Contact page.
Avoiding Cigarette Butts

Too many investors hang their hat on investments that seem “cheap”. Unfortunately, too often something that looks like a bargain turns out to be a cigarette butt from which investors are hoping to take a last puff. As the old adage states, “you get what you pay for,” and that certainly applies to the world of investments. There are endless examples of cheap stocks getting cheaper, or in other words, stocks with low price/earnings ratios going lower. Stocks that appear cheap today, in many cases turn out to be expensive tomorrow because of deteriorating or collapsing profitability.
For instance, take Haliburton Company (HAL), an energy services company. Wall Street analysts are forecasting the Houston, Texas based oil services company to achieve 2016 EPS (earnings per share) of $0.32, down -79%. The share price currently stands at $37, so this translates into an eye-popping valuation of 128x P/E ratio, based on 2016 earnings estimates. What has effectively occurred in the HAL example is earnings have declined faster than the share price, which has caused the P/E to go higher. If you were to look at the energy sector overall, the same phenomenon is occurring with the P/E ratio standing at a whopping 97x (at the end of Q1).
These inflated P/E ratios are obviously not sustainable, so two scenarios are likely to occur:
- The price of the P/E (numerator) will decline faster than earnings (denominator)
- AND/OR
- The earnings of the P/E (denominator) will rise faster than the price (numerator)
Under either scenario, the current nose-bleed P/E ratio should moderate. Energy companies are doing their best to preserve profitability by cutting expenses as fast as possible, but when the product you are selling plummets about -70% in 18 months (from $100 per barrel to $30), producing profits can be challenging.
The Importance of Price (or Lack Thereof)
Similarly to the variables an investor would consider in purchasing an apartment building, “price” is supreme. With that said, “price” is not the only important variable. As famed investor Warren Buffett shrewdly notes, the quality of a company can be even more important than the price paid, especially if you are a long-term investor.
“It’s far better to buy a wonderful company at a fair price than a fair company at a wonderful price.”
The advantage of identifying and owning a “wonderful company” is the long-term stream of growing earnings. The trajectory of future earnings growth, more than current price, is the key driver of long-term stock performance.
Growth investor extraordinaire Peter Lynch summed it up well when he stated,
“People Concentrate too much on the P, but the E really makes the difference.”
Albert Einstein identified the power of “compounding” as the 8th Wonder of the World, which when applied to earnings growth of a stock can create phenomenal outperformance – if held long enough. Warren Buffett emphasized the point here:
“If you aren’t willing to own a stock for ten years, don’t even think about owning it for ten minutes. Put together a portfolio of companies whose aggregate earnings march upward over the years, and so also will the portfolio’s market value.”
Throw Away Cigarette Butts
I have acknowledged the importance of aforementioned price, but your investment portfolio will perform much better, if you throw away the cigarette butts and focus on identifying market leading franchise that can sustain earnings growth. The lower the growth potential, the more important price becomes in the investment question. (see also Magic Quadrant)
Here are the key factors in identifying wining stocks:
- Market Share Leaders: If you pay peanuts, you usually get monkeys. Paying a premium for the #1 or #2 player in an industry is usually the way to go. Certainly, there is plenty of money to be made by smaller innovative companies that disrupt an industry, so for these exceptions, focus should be placed on share gains – not absolute market share numbers.
- Proven Management Team: It’s nice to own a great horse (i.e., company), but you need a good jockey as well. There have been plenty of great companies that have been run into the ground by inept managers. Evaluating management’s financial track record along with a history of their strategic decisions will give you an idea what you’re working with. Performance doesn’t happen in a vacuum, so results should be judged relative to the industry and their competitors. There are plenty of incredible managers in the energy sector, even if the falling tide is sinking all ships.
- Large and/or Growing Markets: Spotting great companies in niche markets may be a fun hobby, but with limited potential for growth, playing in small market sandboxes can be hazardous for your investment health. On the other hand, priority #1, #2, and #3 should be finding market leaders in growth markets or locating disruptive share gainers in large markets. Finding fertile ground on long runways of growth is how investors benefit from the power of compound earnings.
- Capital Allocation Prowess: Learning the capital allocation skillset can be demanding for executives who climb the corporate ladder from areas like marketing, operations, or engineering. Regrettably, these experiences don’t prepare them for the ultimate responsibility of distributing millions/billions of dollars. In the current low/negative interest rate environment, allocating capital to the highest return areas is more imperative than ever. Cash sitting on the balance sheet earning 0% and losing value to inflation is pure financial destruction. Conservatism is prudent, however, excessive piles of cash and overpaying for acquisitions are big red flags. Managers with a track record of organically investing in their businesses by creating moats for long-term competitive advantage are the leaders we invest in.
Many so-called “value” investors solely use price as a crutch. Anyone can print out a list of cheap stocks based on Price-to-Earnings, Enterprise Value/EBITDA, or Price/Cash Flow, but much of the heavy lifting occurs in determining the future trajectory of earnings and cash flows. Taking that last puff from that cheap, value stock cigarette butt may seem temporarily satisfying, but investing into too many value traps may lead you gasping for air and force you to change your stock analysis habits.
Wade W. Slome, CFA, CFP®
Plan. Invest. Prosper.
DISCLOSURE: Sidoxia Capital Management (SCM) and some of its clients hold positions in certain exchange traded funds (ETFs), but at the time of publishing had no direct position in HAL or any security referenced in this article. No information accessed through the Investing Caffeine (IC) website constitutes investment, financial, legal, tax or other advice nor is to be relied on in making an investment or other decision. Please read disclosure language on IC Contact page.
NASDAQ Redux

The NASDAQ Composite index once again crossed the psychologically, all-important 5,000 threshold this week for the first time since the infamous tech-bubble burst in the year 2000. Of course, naturally, the media jumped on a non-stop, multi-day offensive comparing and contrasting today’s NASDAQ vs. the NASDAQ twin of yesteryear. Rather than rehash the discussion once again, I have decided to post three articles I published in recent years on the topic covering the outperformance of the spotlighted, tech-heavy index.
NASDAQ 5,000 Irrational Exuberance Déjà Vu?

Investors love round numbers and with the Dow Jones Industrial index recently piercing 17,000 and the S&P 500 index having broken 2,000 , even novice investors have something to talk about around the office water cooler. While new all-time records are being set for the major indices during September, the unsung, tech-laden NASDAQ index has yet to surpass its all-time high of 5,132 achieved 14 and ½ years ago during March of 2000.
Click Here to Read the Rest of the Article
NASDAQ and the R&D Tech Revolution

It’s been a bumpy start for stocks so far in 2014, but the fact of the matter is the NASDAQ Composite Index is up this year and hit a 14-year high in the latest trading session (highest level since 2000). The same cannot be said for the Dow Jones Industrial and S&P 500 indices, which are both lagging and down for the year. Not only did the NASDAQ outperform the Dow by almost +12% in 2013, but the NASDAQ has also trounced the Dow by over +70% over the last five years.
Click Here to Read the Rest of the Article
NASDAQ: The Ugly Stepchild

All the recent media focus has been fixated on whether the Dow Jones Industrial Average index (“The Dow”) will close above the 13,000 level. In the whole scheme of things, this specific value doesn’t mean a whole lot, but it does make for a great topic of conversation at a cocktail party. Today, the Dow is trading at 12,983, a level not achieved in more than three and a half years. Not a bad accomplishment, given the historic financial crisis on our shores and the debacle going on overseas, but I’m still not so convinced a miniscule +0.1% move in the Dow means much. While the Dow and the S&P 500 indexes garner the hearts and minds of journalists and TV reporters, the ugly stepchild index, the NASDAQ, gets about as much respect as Rodney Dangerfield (see also No Respect in the Investment World).
Click Here to Read the Rest of the Article

Wade W. Slome, CFA, CFP®
Plan. Invest. Prosper.
DISCLOSURE: Sidoxia Capital Management (SCM) and some of its clients hold positions in certain exchange traded funds (ETFs) , but at the time of publishing, SCM had no direct position in any other security referenced in this article. No information accessed through the Investing Caffeine (IC) website constitutes investment, financial, legal, tax or other advice nor is to be relied on in making an investment or other decision. Please read disclosure language on IC Contact page.
Here Comes the Great Rotation…Finally?

For decades interest rates have continually gravitated to zero like flies attracted to stink. For a split second in 2013, as long-term U.S. Treasury rates about doubled from 1.5% to 3.0% before reversing, it appeared the declining rate cycle could finally be broken. At the time, pundits of all types were calling for the “great rotation” out of bonds into stocks. Half of this forecast came to fruition as stocks grinded to record highs in 2014, but even I the big stock bull admittedly did not expect interest rates on 10-year Switzerland bonds to turn negative (see also Draghi QE Beer Goggles), especially after U.S. quantitative easing (QE) came to an end.
With rates already at a generational low, how could anyone be expected to accept a measly 0.3% annual return for a whole decade? Well, that’s exactly what’s happening in massive developed markets like Germany and Japan. While investors and retirees are painted into a corner by being forced to accept near-0% interest payments, savvy corporate borrowers are taking advantage of this once in a lifetime opportunity. Take for example the recently unprecedented $1.35 billion Switzerland bond issuance by Apple Inc. (AAPL), which included a tranche of bonds maturing in 2024 that yielded a paltry 0.25%.
With bonds offering lower and lower yield possibilities for investors of all stripes, at Sidoxia we are still finding plenty of opportunities in stocks, especially in high dividend-paying equity investments. In the U.S., the average S&P 500 stock is yielding approximately the same as the 10-Year Treasury Note (2.0%), but in other parts of the world, equity markets such as the following are offering significantly higher yields:
- iShares MSCI Australia (Yield 5.0% – EWA)
- Europe FTSE Europe (Yield: 4.6% – VGK)
- Market Vectors Russia (Yield 4.6% – RSX)
- iShares MSCI Brazil (Yield 4.0% – EWZ)
- iShares MSCI Sweden (Yield 3.8% – EWD)
- iShares MSCI Malaysia (Yield 3.8% – EWM)
- iShares MSCI Singapore (Yield 3.4% – EWS)
- iShares China (Yield 2.5% – FXI)
A New “Great Rotation” in 2015?
If you look at the 2014 ICI (Investment Company Institute) fund flow data, it becomes clear the great rotation out of bonds into U.S. stocks has not occurred. More specifically, despite the S&P 500 index reaching new record highs, -$60 billion flowed out of U.S. stock funds last year, and about +$44 billion flowed into all bond funds. Could the “great rotation” out of bonds into stocks finally happen in 2015? Certainly, this scenario is a possibility, but given the barren bond yield environment, perhaps the new “great rotation” in 2015 will be out of domestic equities into higher yielding international equity markets. In addition to the higher international market yields listed above, many of these foreign markets are priced more attractively (i.e., lower Price-Earnings (P/E) ratios) as you can see from the chart below created by strategist Dr. Ed Yardeni.
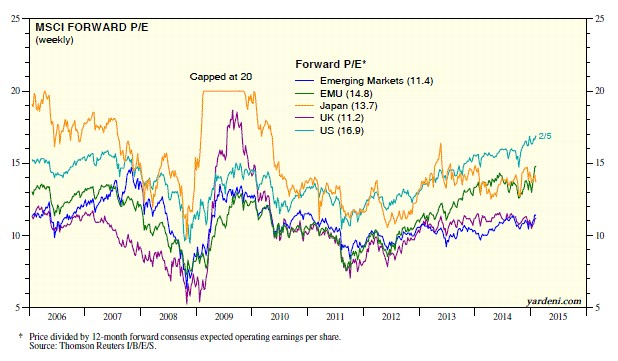
Source: Ed Yardeni – Dr. Ed’s Blog
Obviously, any asset shifting scenario is not mutually exclusive, and there could be a combination of investor reallocations made in 2015. It’s possible that previously unloved emerging markets and international developed markets could receive new investor capital from several areas.
With defensive sectors like utilities (up +25%) and healthcare (up +24%) leading the U.S. sector higher last year, it’s evident to me that “skepticism” remains the operative word in investors’ minds and there is no clear evidence of widespread euphoria hitting the U.S. stock market. Valuations as measured by trailing P/E ratios have objectively moved above historical averages, however this has occurred within the context of all-time record low interest rates and inflation. If you take into account the near-0% interest rate environment into your calculus, current stock prices (P/E ratios) are well within historical norms (see also The Rule of 20 Can Make You Plenty), which still leaves room for expansion.
If some of the half-glass full economic waters spill into the half-glass empty emerging markets/international markets, conceivably the eagerly anticipated “great rotation” out of bonds into U.S. stocks may also flow into even more attractively valued foreign equity opportunities.
Wade W. Slome, CFA, CFP®
Plan. Invest. Prosper.
DISCLOSURE: Sidoxia Capital Management (SCM) and some of its clients hold positions in AAPL and certain exchange traded funds (ETFs) including VGK, EWZ, FXI, but at the time of publishing SCM had no direct position in EWA, RSX, EWD, EWM, EWS, and any other security referenced in this article. No information accessed through the Investing Caffeine (IC) website constitutes investment, financial, legal, tax or other advice nor is to be relied on in making an investment or other decision. Please read disclosure language on IC Contact page.
Supply & Demand: The Lesson of a Lifetime

Between all the sporting events, road trips, and parties, I had a difficult time balancing my academic responsibilities just like any other college student. Nonetheless, after a few jobs and a few decades post my graduation, it is refreshing to see my economics college degree was able to teach me one valuable lesson…”supply & demand” actually works.
Emotions and animal spirits can separate fact from fiction in the short-run, but over the long-run, the economic forces of “supply & demand” will ultimately determine the direction of asset prices. If you can think of any bubble market, ranging from tulips and tech stocks (see Bubbles and Naps) to commodities and houses, sooner or later new supply will enter the market, and/or some other factor, which will prick the demand side of the bubble equation.
The same economic rules apply to currencies. Gut-based, day-traders may be skeptical, but economics’ longest enduring axiom shined last week when we saw the Swiss franc spike +20% against the euro in a single day. On the heels of a weakening euro currency and heightened demand for the franc, the Swiss National Bank (SNB) decided to remove its artificial peg to the euro. Effectively, the SNB has been selling francs and buying $490 billion in reserves (the majority of which is in euros and U.S. dollars). As a result, exports of Swiss army knives, watches, and industrial equipment will be more expensive now, which could potentially crimp demand for the country’s goods and services. The SNB, however, could no longer afford to buy euros and dollars to artificially depress the franc. Swiss bankers were very worried about the possible amplified costs of a currency war in the face of this week’s expected European Central Bank (ECB) announcements on quantitative easing (QE) monetary stimulus, so they decided to allow the franc to free-float versus global currencies.
Another asset class heavily impacted by volatile supply-demand dynamics has been the oil market. Weaker demand from Europe/Russia combined with the higher supply from U.S. shale has created a recipe for a crude price collapse (> -50% declines over the last year). Thus far, OPEC (Organization of Petroleum Exporting Countries) has remained committed to maintaining its supply/production levels.
Interest Rates and Supply-Demand
Not every asset price is affected by direct supply-demand factors. Take for example the stock market. I have been writing and commentating about the fascinating persistence and accelerated decline in global interest rates recently (see Why 0% Rates?). Near-0% rates are important because interest rates are just another name for the “cost of money” (or “opportunity cost of money”). When the Prime Rate was 20% in the early 1980s, the cost of money was high and a 16% CD at the bank looked pretty attractive relative to rolling the dice on volatile/risky stocks. Any economics, finance, or accounting student knows through their studies of the “time value of money” that interest rates have a tight inverse correlation to asset values (i.e., lower interest rates = higher asset values, and vice versa).
More practically speaking, we see stock prices supported by the lower borrowing costs tied to low interest rates. Just look at the $500,000,000,000+ conducted in share buybacks over the past 12 months (chart below). Economics works quite effectively when you can borrow at 3% and then purchase your own stock yielding 6% (the inverse percentage of the current 16x P/E ratio). What makes this mathematical equation even more accretive for corporate CFOs is the 6% rate earned today should double to 12% in 10 years, if a company resembles an average S&P 500 company. In other words, S&P 500 earnings have historically grown at a 7% annual clip, therefore the 6% earnings yield should double to 12% in about a decade, based on current prices. This basic arbitrage strategy is a no-brainer for corporate execs because it provides instantaneous EPS (earnings per share) growth with minimal risk, given the current bullet proof status of many blue-chip company balance sheets.

Source: Financial Times
I have provided a few basic examples of how straightforward supply-demand dynamics can be used to analyze market relationships and trends. Although supply-demand analysis is a great rudimentary framework at looking at markets and various asset classes, unanticipated exogenous factors such regulation, terrorism, politics, weather, and a whole host of other influences can throw a wrench into your valuation conclusions. Until rates normalize, the near-0% interest rates we are experiencing now will continue to be a significant tailwind for stock prices. As interest rates have been declining for the last three and a half decades, it appears I still have time before I will need to apply the other important concept I learned in college…mean reversion.
Wade W. Slome, CFA, CFP®
Plan. Invest. Prosper.
DISCLOSURE: Sidoxia Capital Management (SCM) and some of its clients own a range of positions, including positions in certain exchange traded funds positions , but at the time of publishing SCM had no direct position in any other security referenced in this article. No information accessed through the Investing Caffeine (IC) website constitutes investment, financial, legal, tax or other advice nor is to be relied on in making an investment or other decision. Please read disclosure language on IC Contact page.
NASDAQ 5,000…Irrational Exuberance Déjà Vu?
Investors love round numbers and with the Dow Jones Industrial index recently piercing 17,000 and the S&P 500 index having broken 2,000 , even novice investors have something to talk about around the office water cooler. While new all-time records are being set for the major indices during September, the unsung, tech-laden NASDAQ index has yet to surpass its all-time high of 5,132 achieved 14 and ½ years ago during March of 2000.
A lot has changed since then. Leading up to the pricking of the technology bubble, talks of an overhyped market started as early as December 5, 1996, when then Federal Reserve Chairman Alan Greenspan made his infamous “irrational exuberance” speech.
“But how do we know when irrational exuberance has unduly escalated asset values, which then become subject to unexpected and prolonged contractions as they have in Japan over the past decade?”-Alan Greenspan (Federal Reserve Chairman 1987 – 2006)
On that date, the NASDAQ closed at 1,300. A little over three years later, before values cratered by -78%, the index almost quadrupled higher to 5,132. Looked at from a slightly different lens, here is how the major indexes have fared since Greenspan’s widely referenced speech almost 18 years ago:

Despite the world’s most powerful banker calling stock prices irrational, the Dow & S&P have almost tripled in value (+164% & +167%, respectively) and the NASDAQ has almost quadrupled (+251%). The 80%+ outperformance (excluding dividends) is impressive, but reasonable if you consider this increase amounts to about a +7.2% compounded annual appreciation value. Investors have experienced a lot of heartburn over that long timeframe, but for any buy-and-holders, these returns would have trounced returns realized in alternative safe haven vehicles like CDs, savings accounts, or bonds.
Price: The Almighty Metric
There are many valuation metrics to evaluate but the most universal one is the Price/Earnings ratio (P/E). Just as in the process of assessing the value of a car, house, or stock, the price you pay is usually the most important factor of the purchase. The same principle applies to stock indexes. The cheaper the price paid, the greater probability of earning superior returns in the future. Unfortunately for investors in technology stocks, there was not much value in the NASDAQ index during late-1999, early-2000. Historical P/E data for the NASDAQ index is tough to come by, but some estimates pegged the index value at 200x’s its earnings at the peak of the 2000 technology mania. In other words, for every $1 in profit the average NASDAQ company earned, investors were willing to pay $200…yikes.
Today, the NASDAQ 100 index (the largest 100 non-financial companies in the NASDAQ index), which can serve as a proxy for the overll NASDAQ index, carries a reasonable P/E ratio of approximately 20x on a forward basis (24x on a trailing basis) – about 90% lower than the peak extremes of the NASDAQ index in the year 2000.
Although NASDAQ valuations are much lower today than during the bursting 2000 tech bubble, P/E ratios for the NASDAQ 100 still remain about +20% higher than the S&P 500, which begs the question, “Is the premium multiple deserved?”
As I wrote about in the NASDAQ Tech Revolution, you get what you pay for. If you pay a peanut multiple, many times you get a monkey stock. In the technology world, there is often acute obsolescence risk (remember Blackberry – BBRY?) that can lead to massive losses, but there also exists a winner-takes-all dynamic. Just think of the dominance of Google (GOOG/L) in search advertising, Microsoft (MSFT) in the PC, or Amazon (AMZN) in e-commerce. It’s a tricky game, but following the direction of cash, investments, and product innovation are key in my mind if you plan on finding the long-term winners. For example, the average revenue growth for the top 10 companies in the NASDAQ 100 averaged more than +100% annually from the end of 1999 to the end of 2013. Identifying the “Old Tech Guard” winners is not overly challenging, but discovering the “New Tech Guard” is a much more demanding proposition.
In the winner-takes-all hunt, one need not go any further than looking at the massive role technology plays in our daily lives. Twenty years ago, cell phones, GPS, DVRs (Digital Video Recorders), e-Readers, tablets, electric cars, iPods/MP3s, WiFi mobility, on-demand digital media, video-conferencing, and cloud storage either did not exist or were nowhere near mainstream. Many of these technologies manifest themselves into a whole host of different applications that we cannot live without. One can compile a list of these life-critical applications by thumbing through your smartphone or PC bookmarks. The list is ever-expanding, but companies like Twitter (TWTR), Facebook (FB), Amazon (AMZN), Uber, Netflix (NFLX), Priceline (PCLN), Yelp, Zillow (Z), and a bevy of other “New Tech Guard” companies have built multi-billion franchises that have become irreplaceable applications in our day-to-day lives.
Underlying all the arbitrary index value milestones (e.g., Dow 17,000 and S&P 2,000) since the 1990s has a persistent and unstoppable proliferation of technology adoption across virtually every aspect of our lives. NASDAQ 5,000 may not be here quite yet, but getting there over the next year or two may not be much of a stretch. Speculative tendencies could get us there sooner, and macro/geopolitical concerns could push the milestone out, but when we do get there the feeling of NASDAQ 5,000 déjà vu will have a much stronger foundation than the fleeting euphoric emotions felt when investors tackled the same level in year 2000.
Wade W. Slome, CFA, CFP®
Plan. Invest. Prosper.
DISCLOSURE: Sidoxia Capital Management (SCM) and some of its clients own AAPL, GOOG/L, AMZN, NFLX bonds (short the equity), FB (non-discretionary), MSFT (non-discretionary), PCLN (non-discretionary) and a range of positions in certain exchange traded fund positions, but at the time of publishing SCM had no direct position in TWTR, Uber, YELP, Z, or any other security referenced in this article. No information accessed through the Investing Caffeine (IC) website constitutes investment, financial, legal, tax or other advice nor is to be relied on in making an investment or other decision. Please read disclosure language on IC Contact page.
Shiller CAPE Peaches Smell Like BS

If something sounds like BS, looks like BS, and smells like BS, there’s a good chance you’re probably eyeball-deep in BS. In the investment world, I encounter a lot of very intelligent analysis, but at the same time I also continually step into piles of investment BS. One of those piles of BS I repeatedly step into is the CAPE ratio (Cyclically Adjusted Price-to-Earnings) created by Robert Shiller. For those who are not familiar with Shiller, he is a Nobel Prize winner in economics who won the award in 2013 for his work on the “empirical analysis of asset prices.” Shiller vaulted into fame in large part due to the timing of his book, Irrational Exuberance, which was published during the 2000 technology market peak. He gained additional street-credibility in the mid-2000s when he spoke about the bubble developing in the real estate markets.
What is the CAPE?
Besides being a scapegoat for every bear that has missed the tripling of stock prices in the last five years, the CAPE effectively is a simple 10-year average of the P/E ratio for the S&P 500 index. The logic is simple, like many theories in finance and economics, there often are inherent mean-reverting principles that are accepted as rules-of-thumb. It follows that if the current 10-year CAPE is above the 134-year CAPE average, then stocks are expensive and you should avoid them. On the other hand, if the current CAPE were below the long-term CAPE average, then stocks are cheap and you should buy. Here is a chart of the Shiller CAPE:
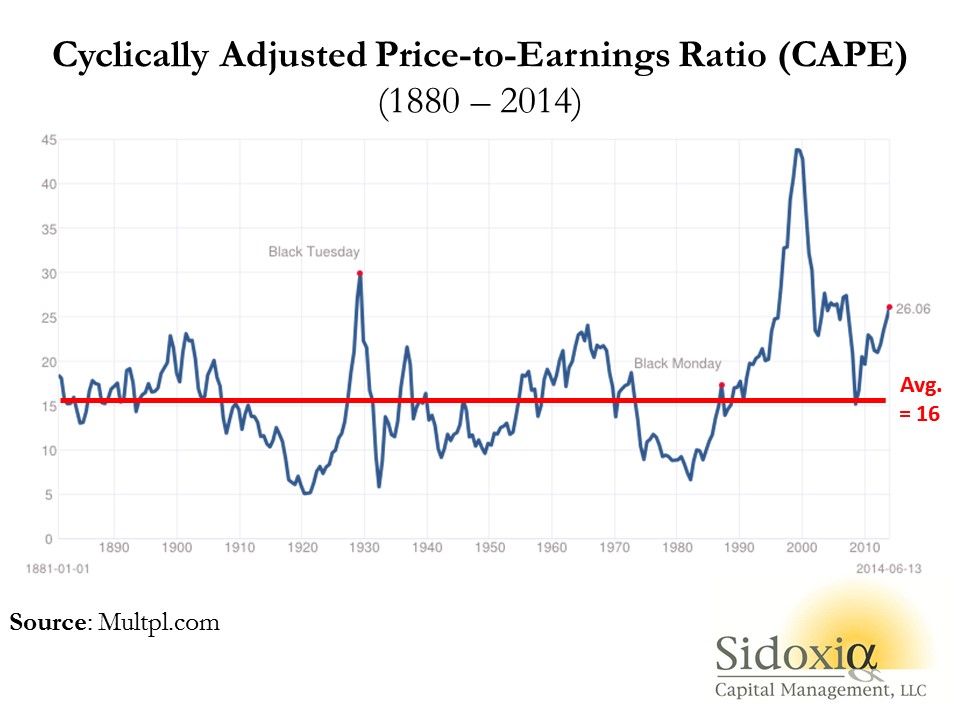
As you can see from the chart above, the current CAPE ratio of 26x is well above the 134-year average of 16x, which according to CAPE disciples makes the stock market very expensive. Or as a recent Business Insider article stated, the Shiller CAPE is “higher than at any point in the 20th century with the exception of the peaks of 1929 and 2000 – you know what happened after those.”
Problems Behind the Broken CAPE Tool
There are many problems with Shiller’s CAPE analysis, but let’s start with the basics by first asking, how useful has this tool actually been over the last, 10, 20, or 30 years? The short answer…not very. For example, if investors followed the implicit recommendation of the CAPE for the periods when Shiller’s model showed stocks as expensive (see above chart 1990 – 2014), they would have missed a more than quintupling (+469% ex-dividends) in the S&P 500 index. Over a shorter timeframe (2009 – 2014) the S&P 500 is up +114% ex-dividends (+190% since March 2009).
Even if you purchased at the worst time at the peak of the stock market in 2000 when the CAPE was 44 (S&P 500 – 1553), an investor would still have earned a total return of about +45% from 2000 – 2014, despite the CAPE still being 63% higher (more expensive) than the 134-year CAPE average of 16.
Peaches for $.25 Post-Bubble?
To illustrate a point, let’s assume you are a peach lover and due to a bubble in peach demand, prices spiked to an elevated level of $2.60 per pound for 9 years, but in year 10 the price plummeted to $.25 per pound today (see chart below). Assuming the 134-year average for peach prices was $1.60 per pound, would you still want to purchase your beloved peaches for the fire sale price of $.25 per pound? Common sense tells you $.25/lb. is a bargain, but if you asked the same question to Robert Shiller, he would say absolutely “NO”! The 10-year Peach CAPE ratio would be $2.37 ([9 yrs X $2.60] + [1 yr X $.25]) #1, but since the 10-year CAPE is greater than the LT-Average peach price of $1.60 per pound #2, Shiller would say peaches are too expensive, even though you could go to Kroger (KR) and buy a pound of peaches today for $0.25 #3.
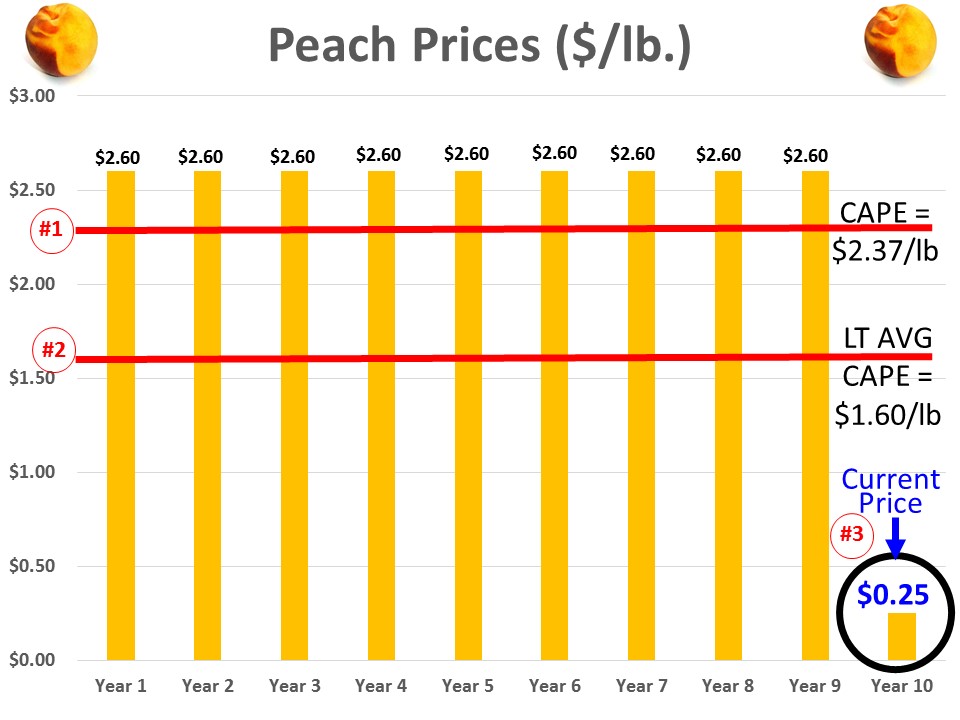
This complete neglect of current market prices in the calculation of CAPE makes absolutely no sense, but this same dynamic of ignoring current pricing reality is happening today in the stock market. Effectively what’s occurring is the higher P/E ratios experienced over the last 10 years are distorting the Shiller CAPE ratio, thereby masking the true current value of stocks. In other words the current CAPE of 26x vastly exaggerates the pricey-ness of the actual S&P 500 P/E ratio of 16x for 2014 and 14x for 2015.
There are plenty of other holes to poke into CAPE, but the last major component of Shiller’s ratio I want to address is interest rates. Even if you disregard my previous negative arguments against Shiller’s CAPE, should anyone be surprised that the ratio troughed in the early 1980s of 7x when long-term interest rates peaked. If I could earn 18% on a CD with little risk in 1981, not many people should be dumbfounded that demand for risky stocks was paltry. Today, the reverse environment is in place – interest rates are near record lows. It should therefore come as no surprise, that all else equal, a higher P/E (and CAPE) is deserved when interest rates are this low. Nevertheless, this discussion of P/E and CAPE rarely integrates the critical factor of interest rates.
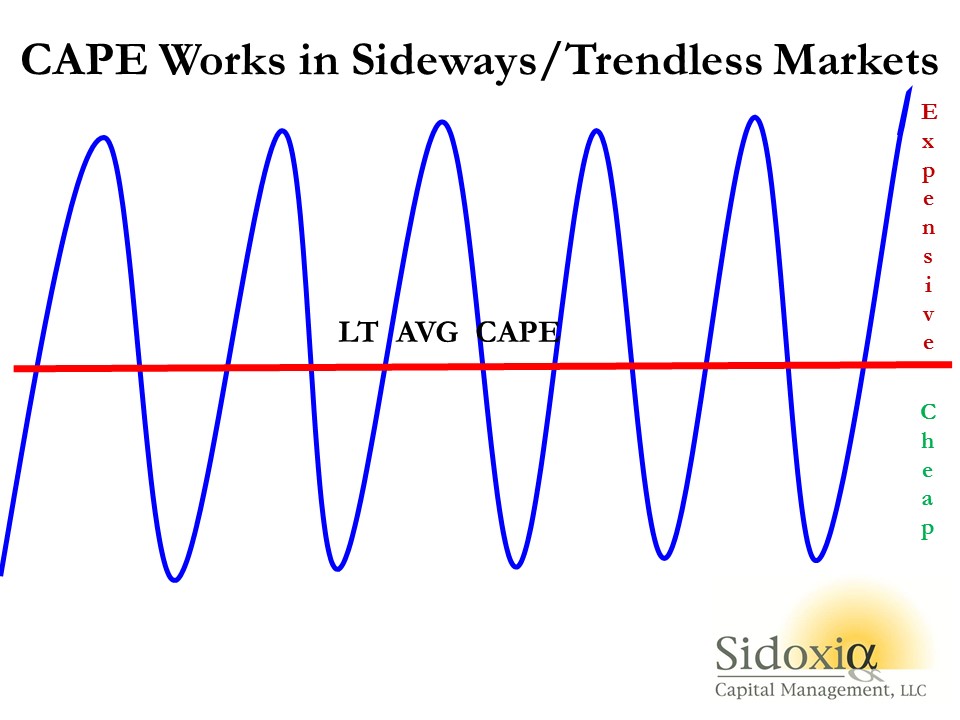
While I have spent a decent amount of time trashing the CAPE-BS ratio, I want to give my pal Bob Shiller a fair shake. I can do this by looking into a mirror and admitting there are periods when the CAPE ratio can actually work. Although the CAPE is effectively useless during long, multi-year upward and downward trending markets (think bubbles & depressions), the CAPE makes perfect sense in sideway, trendless markets (see chart below).
The investing public is always looking for a Holy Grail financial indicator that will magically guide them to riches in both up and down markets. Despite the popularity of Shiller’s CAPE ratio, regrettably no one perfect indicator exists. So before you jump on the bandwagon and chase the hot indicator du jour, make sure to look down and make sure you haven’t stepped in any Shiller CAPE-BS.
Wade W. Slome, CFA, CFP®
Plan. Invest. Prosper.
DISCLOSURE: Sidoxia Capital Management (SCM) and some of its clients hold long positions in certain exchange traded funds, but at the time of publishing SCM had no direct position in KR, or any other security referenced in this article. No information accessed through the Investing Caffeine (IC) website constitutes investment, financial, legal, tax or other advice nor is to be relied on in making an investment or other decision. Please read disclosure language on IC Contact page.


