Archive for June, 2013
Fed Fatigue Setting In

Uncle…uncle! There you have it – I have finally cried “uncle” because I cannot take it anymore. I don’t think I can listen to another panel or read another story debating about the timing of Fed “tapering”, or heaven forbid the Fed actually “tighten” the Federal Funds rate (i.e., increasing the targeted rate for inter-bank lending). Type in the words “Bernanke” and “tapering” into Google and you will get back more than 41,000,000 results. The build up to the 600-word FOMC (Federal Open Market Committee) statement was almost deafening, so much so that live coverage of Federal Reserve Chairman Ben Bernanke was available at your fingertips:

Source: Yahoo! Finance
Like a toddler (or a California-based, investment blog writer) going to the doctor’s office to receive an inoculation, the anxiety and mental anguish caused in anticipation of the event is often more painful than the actual injection. As I highlighted in a previous Investing Caffeine article, the 1994 interest rate cycle wasn’t Armageddon for equity markets, and the same can be said for the rate hikes from 1.0% to 5.25% in the 2004-20006 period (see chart below). Even if QE3 ends in mid-2014 and the new Federal Reserve Chairman (thank you President Obama) raises rates in 2015, this scenario would not be the first (or last) time the Federal Reserve has tightened monetary policy.
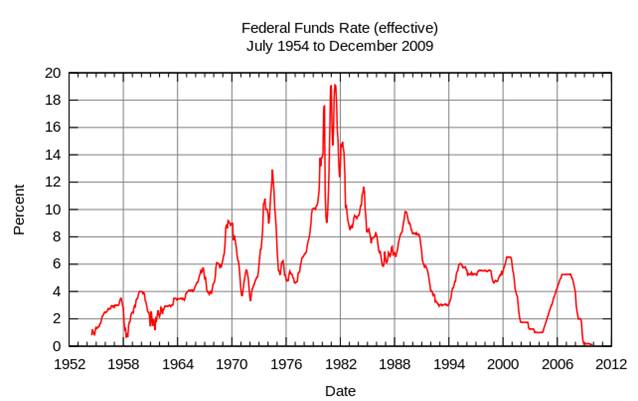
Source: Wikipedia
Short Memories – What Have You Done for Me Lately?
People are quick to point out the one-day -350 Dow point loss earlier this week, but many of them forget about the +3,000 point moon shot in the Dow Jones Industrial index that occurred in six short months (November 2012 – May 2013). The same foggy recollection principle applies to interest rates. The recent rout in 10-year Treasury prices is easily recalled as rates have jumped from 1.5% to 2.5% over the last year, however amnesia often sets in for others if you ask them where rates were a few years ago. It’s easy to forget that 30-year fixed rate mortgages exceeded 5% and the 10-year reached 4% just three short years ago.
Bernanke: The Center of the Universe?
Does Ben Bernanke deserve credit for implementing extraordinary measures during extraordinary times during the 2008-09 financial crisis? Absolutely. But should every man, women, and child wait with bated breath to see if a word change or tonal adjustment is made in the eight annual FOMC meetings?
Like the public judging Ben Bernanke, my Sidoxia clients probably give me too much credit when things go well and too much blame when things don’t. I love how Bernanke gets blamed/credited for the generational low interest rates caused by his money printing ways and QE punch bowl tactics. Last I checked, the interest rate downtrend has been firmly in place over the last three decades, well before Bernanke came into the Fed and worked his monetary magic. How much credit/blame are we forgetting to give former Federal Reserve Chairmen Paul Volcker, Alan Greenspan, and other government policy-makers? Regardless of what happens economically for the remainder of 2013, Bernanke will do whatever he can to solidify his legacy in the waning sunset months of his term.
Another forgotten fact I like to point out: There is more than one central banker living on this planet. If you haven’t been asleep over the last few decades, our financial markets have increasingly become globally interconnected with the assistance of technology. I know our 10-year Treasury rates are hovering around 2.50%, and our egotistical patriotism leads us to hail Bernanke as a monetary god, but don’t any other central bankers or government officials around the world deserve any recognition for achieving yields even lower than ours? Here’s a partial list (June 22, 2013 – Financial Times):
- Japan – 0.86%
- Germany – 1.67%
- Canada – 2.33%
- U.K. – 2.31%
- France – 2.27%
- Sweden – 2.15%
- Austria – 2.09%
- Switzerland – 0.92%
- Netherlands – 2.07%
Although it may be fun to look at Ben Bernanke as our country’s financial Superman who is there to save the day, there are a lot more important factors to consider than the 47 words added and 19 subtracted from the latest FOMC statement. If investing was as easy as following central bank monetary policy, everyone would be continually jet setting to their private islands. Rather than wasting your time listening to speculative blathering about direction of Fed monetary policy, why not focus on finding solid investment ideas and putting a long-term investment plan in place. Now please excuse me – Fed fatigue has set in and I need to take a nap.
Wade W. Slome, CFA, CFP®
Plan. Invest. Prosper.
DISCLOSURE: Sidoxia Capital Management (SCM) and some of its clients hold positions in certain exchange traded funds (ETFs) and GOOG, but at the time of publishing, SCM had no direct position in any other security referenced in this article. No information accessed through the Investing Caffeine (IC) website constitutes investment, financial, legal, tax or other advice nor is to be relied on in making an investment or other decision. Please read disclosure language on IC Contact page.
U.S. Small-Caps Become Global Big Dog

With the emerging market currencies and financial markets under attack; Japan’s Nikkei index collapsing in the last three weeks; and the Federal Reserve hinting about its disciplinarian tapering of $85 billion in monthly QE3 bond purchases, one would expect higher beta small cap stocks to get hammered in this type of environment.
Before benchmarking results in the U.S., let’s take a closer look at some of the international carnage occurring from this year’s index value highs:
- Japan: -19% (Nikkei 225 index)
- Brazil: -22% (IBOVESPA index)
- Hong Kong: -12% (Hang Seng index)
- Russia: -19% (MICEX/RTS indexes)
Not a pretty picture. Given this international turmoil and the approximately -60% disintegration in U.S. small-cap stock prices during the 2007-2009 financial crisis, surely these economically sensitive stocks must be getting pummeled in this environment? Well…not necessarily.
Putting the previously mentioned scary aspects aside, let’s not forget the higher taxes, Sequestration, and ObamaCare, which some are screaming will push us off a ledge into recession. Despite these headwinds, U.S. small-caps have become the top dog in global equity markets. Since the March 2009 lows, the S&P 600 SmallCap index has more than tripled in value ( about +204%, excluding dividends), handily beating the S&P 500 index, which has advanced a respectable +144% over a similar timeframe. Even during the recent micro three-week pullback/digestion phase, small cap stocks have retreated -2.8% from all-time record highs (S&P 600 index). Presumably higher dividend, stable, globally-diversified, large-cap stocks would hold up better than their miniature small-cap brethren, but that simply has not been the case. The S&P 500 index has underperformed the S&P 600 by about -80 basis points during this limited period.
How can this be the case when currencies and markets around the world are under assault? Attempting to explain short-term moves in any market environment is a hazardous endeavor, but that has never slowed me down in trying. I believe these are some of the contributing factors:
1) No Recession. There is no imminent recession coming to the U.S. As the saying goes, we hear about 10 separate recessions before actually experiencing an actual recession. The employment picture continues to slowly improve, and the housing market is providing a slight tailwind to offset some the previously mentioned negatives. If you want to fill that half-full glass higher, you could even read the small-cap price action as a leading indicator for a pending acceleration in a U.S. cyclical recovery.
2) Less International. The United States is a better house in a shaky global neighborhood (see previous Investing Caffeine article), and although small cap companies are expanding abroad, their exposure to international markets is less than their large-cap relatives. Global investors are looking for a haven, and U.S. small cap companies are providing that service now.
3) Inflation Fears. Anxiety over inflation never seems to die, and with the recent +60 basis point rise in 10-year Treasury yields, these fears appear to have only intensified. Small-cap stocks cycle in and out of favor just like any other investment category, so if you dig into your memory banks, or pull out a history book, you will realize that small-cap stocks significantly outperformed large-caps during the inflationary period of the 1970s – while the major indexes effectively went nowhere over that decade. Small-cap outperformance may simply be a function of investors getting in front of this potential inflationary trend.
Following the major indexes like the Dow Jones Industrials index and reading the lead news headlines are entertaining activities. However, if you want to become a big dog in the investing world and not get dog-piled upon, then digging into the underlying trends and market leadership dynamics of the market indexes is an important exercise.
Wade W. Slome, CFA, CFP®
Plan. Invest. Prosper.
DISCLOSURE: Sidoxia Capital Management (SCM) and some of its clients hold positions in certain exchange traded funds (ETFs) including emerging market ETFs, IJR, and EWZ, but at the time of publishing, SCM had no direct position in Hong Kong ETFs, Japanese ETFs, Russian ETFs, or any other security referenced in this article. No information accessed through the Investing Caffeine (IC) website constitutes investment, financial, legal, tax or other advice nor is to be relied on in making an investment or other decision. Please read disclosure language on IC Contact page.
1994 Bond Repeat or 2013 Stock Defeat?

Interest rates are moving higher, bond prices are collapsing, and fear regarding a stock market plunge is palpable. Sound like a recent news headline or is this a description of a 1994 financial market story? For those with a foggy, double-decade-old memory, here is a summary of the 1994 economic environment:
- The economy registered its 34th month of expansion and the stock market was on a record 40-month advance
- The Federal Reserve embarked on its multi-hike, rate-tightening monetary policy
- The 10-year Treasury note exhibited an almost 2.5% jump in yields
- Inflation was low with a threat of rising inflation lurking in the background
- An upward sloping yield curve encouraged speculative bond carry-trade activity (borrow short, invest long)
- Globalization and technology sped up the pace of price volatility
Many of these listed items resemble factors experienced today, but bond losses in 1994 were much larger than the losses of 2013 – at least so far. At the time, Fortune magazine called the 1994 bond collapse the worst bond market loss in history, with losses estimated at upwards of $1.5 trillion. The rout started with what might have appeared as a harmless 0.25% increase in the Federal Funds rate (the rate that banks lend to each other) from 3% to 3.25% in February 1994. By the time 1994 came to a close, acting Federal Reserve Chairman Alan Greenspan had jacked up this main monetary tool by 2.5%.
Rising rates may have acted as the flame for bond losses, but extensive use of derivatives and leverage acted as the gasoline. For example, over-extended Eurobond positions bought on margin by famed hedge fund manager Michael Steinhardt of Steinhardt Partners lead to losses of about-30% (or approximately $1.5 billion). Renowned partner of Omega Partners, Leon Cooperman, took a similar beating. Cooperman’s $3 billion fund cratered -24% during the first half of 1994. Insurance company bond portfolios were hit hard too, as collective losses for the industry exceeded $20 billion, or more than the claims paid for Hurricane Andrew’s damage. Let’s not forget the largest casualty of this era – the public collapse of Orange County, California. Poor derivatives trades led to $1.7 billion in losses and ultimately forced the county into bankruptcy.
There are plenty of other examples, but suffice it to say, the pain felt by other bond investors was widespread as a massive number of margin calls caused a snowball of bond liquidations. The speed of the decline was intensified as bond holders began selling short and using derivatives to hedge their portfolios, accelerating price declines.
Just as the accommodative interest rate punch bowl was eventually removed by Greenspan, so too is Ben Bernanke (current Fed Chairman) threatening to do today. Even if Bernanke unleashes a cold-turkey tapering of the $85 billion per month in bond-purchases, massive losses in bond values won’t necessarily mean catastrophe for stock values. For evidence, one needs to look no further than this 1994-1995 chart of the stock market:
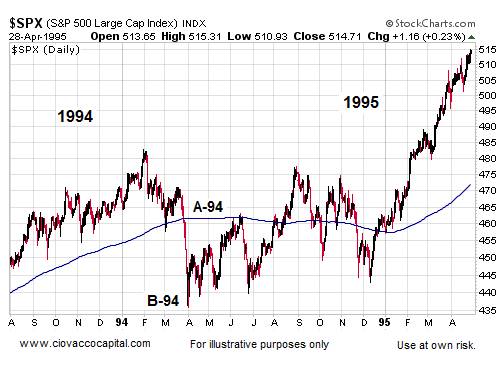
Source: Ciovaccocapital.com
Volatility for stocks definitely increased in 1994 with the S&P 500 index correcting about -10% early in the year. But as you can see, by the end of the year the market was off to the races, tripling in value over the next five years. Volatility has been the norm for the current bull market rally as well. Despite the more than doubling in stock prices since early 2009, we have experienced two -20% corrections and one -10% pullback.
What’s more, the onset of potential tapering is completely consistent with core economic principles. Capitalism is built on free trading markets, not artificial intervention. Extraordinary times required extraordinary measures, but the probabilities of a massive financial Armageddon have been severely diminished. As a result, the unprecedented scale of quantitative easing (QE) will eventually become more harmful than beneficial. The moral of the story is that volatility is always a normal occurrence in the equity markets, therefore any significant stock pullback associated with potential bond tapering (or fed fund rate hikes) shouldn’t be viewed as the end of the world, nor should a temporary weakening in stock prices be viewed as the end to the bull market in stocks.
Why have stocks historically provided higher returns than bonds? The short answer is that stocks are riskier than bonds. The price for these higher long-term returns is volatility, and if investors can’t handle volatility, then they shouldn’t be investing in stocks.
If you are an investor that thinks they can time the market, you wouldn’t be wasting your time reading this article. Rather, you’d be spending time on your personal island while drinking coconut drinks with umbrellas (see Market Timing Treadmill).
Although there are some distinct similarities between the economic backdrop of 1994 and 2013, there are quite a few differences also. For starters, the economy was growing at a much healthier clip then (+4.1% GDP growth), which stoked inflationary fears in the mind of Greenspan. Moreover, unemployment was quite low (5.5% by year-end vs. 7.6% today) and the Fed did not communicate forward looking Fed policy back then.
It’s unclear if the recent 50 basis point ascent in 10-year Treasury rates was just an appetizer for what’s to come, but simple mathematics indicate there is really only one direction left for interest rates to go…higher. If history repeats itself, it will likely be bond investors choking on higher rates (not stock investors). For the sake of optimistic bond speculators, I hope Ben Bernanke knows the Heimlich maneuver. Studying history may help bond bulls avoid indigestion.
Wade W. Slome, CFA, CFP®
Plan. Invest. Prosper.
DISCLOSURE: Sidoxia Capital Management (SCM) and some of its clients hold positions in certain exchange traded funds (ETFs), but at the time of publishing SCM had no direct position in any other security referenced in this article. No information accessed through the Investing Caffeine (IC) website constitutes investment, financial, legal, tax or other advice nor is to be relied on in making an investment or other decision. Please read disclosure language on IC Contact page.
What’s Going on with This Crazy Market?!

The massive rally of the stock market since March 2009 has been perplexing for many, but the state of confusion has reached new heights as the stock market has surged another +2.0% in May, surpassing the Dow 15,000 index milestone and hovering near all-time record highs. Over the last few weeks, the volume of questions and tone of disbelief emanating from my social circles has become deafening. Here are some of the questions and comments I’ve received lately:
“Wade, why in the heck is the market up so much?”; “This market makes absolutely no sense!”; “Why should I buy at the peak when I can buy at the bottom?”; “With all this bad news, when is the stock market going to go down?”; “You must be shorting (betting against) this market, right?”
If all the concerns about the Benghazi tragedy, IRS conservative targeting, and Federal Reserve bond “tapering” are warranted, then it begs the question, “How can the Dow Jones and other indexes be setting new all-time highs?” In short, here are a few reasons:
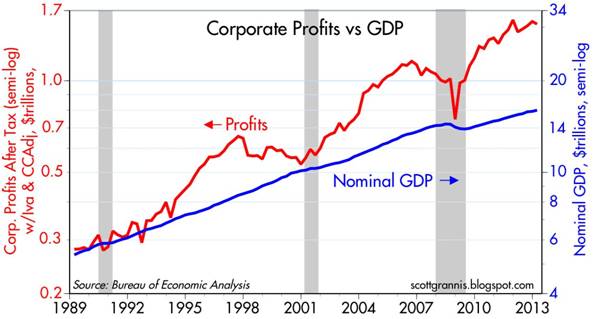
You hear a lot of noise on TV and read a lot of blathering in newspapers/blogs, but what you don’t hear much about is how corporate profits have about tripled since the year 2000 (see red line in chart above), and how the profit recovery from the recent recession has been the strongest in 55 years (Scott Grannis). The profit collapse during the Great Recession was closely chronicled in nail-biting detail, but a boring profit recovery story sells a lot less media advertising, and therefore gets swept under the rug.
II.) Reasonable Prices (Comparing Apples & Oranges):
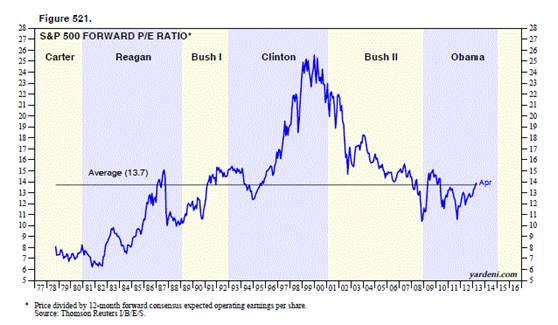
Source: Dr. Ed’s Blog
The Price-Earnings ratio (P/E) is a general barometer of stock price levels, and as you can see from the chart above (Ed Yardeni), current stock price levels are near the historical average of 13.7x – not at frothy levels experienced during the late-1990s and early 2000s.
Comparing Apples & Oranges:

At the most basic level of analysis, investors are like farmers who choose between apples (stocks) and oranges (bonds). On the investment farm, growers are generally going to pick the fruit that generates the largest harvest and provide the best return. Stocks (apples) have historically offered the best prices and yielded the best harvests over longer periods of time, but unfortunately stocks (apples) also have wild swings in annual production compared to the historically steady crop of bonds (oranges). The disastrous apple crop of 2008-2009 led a massive group of farmers to flood into buying a stable supply of oranges (bonds). Unfortunately the price of growing oranges (i.e., buying bonds) has grown to the highest levels in a generation, with crop yields (interest rates) also at a generational low. Even though I strongly believe apples (stocks) currently offer a better long-term profit potential, I continue to remind every farmer (investor) that their own personal situation is unique, and therefore they should not be overly concentrated in either apples (stocks) or oranges (bonds).
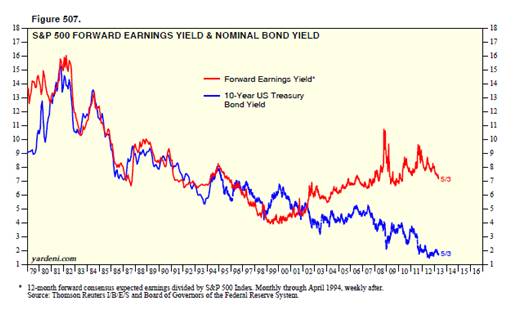
Source: Dr. Ed’s Blog
Regardless, you can see from the chart above (Dr. Ed’s Blog), the red line (stocks) is yielding substantially more than the blue line (bonds) – around 7% vs. 2%. The key for every investor is to discover an optimal balance of apples (stocks) and oranges (bonds) that meets personal objectives and constraints.
III.) Skepticism (Market Climbs a Wall of Worry):

Source: Calafia Beach Pundit
Although corporate profits are strong, and equity prices are reasonably priced, investors have been withdrawing hundreds of billions of dollars from equity funds (negative blue lines in chart above – Calafia Beach Pundit). While the panic of 2008-2009 has been extinguished from average investors’ psyches, the Recession in Europe, slowing growth in China, Washington gridlock, and the fresh memories of the U.S. financial crisis have created a palpable, nervous skepticism. Most recently, investors were bombarded with the mantra of “Selling in May, and Going Away” – so far that advice hasn’t worked so well. To buttress my point about this underlying skepticism, one need not look any further than a recent CNBC segment titled, “The Most Confusing Market Ever” (see video below):
Source: CNBC
It’s clear that investors remain skittish, but as legendary investor Sir John Templeton so aptly stated, “Bull markets are born on pessimism, grow on skepticism, mature on optimism and die on euphoria.” The sentiment pendulum has been swinging in the right direction (see previous Investing Caffeine article), but when money flows sustainably into equities and optimism/euphoria rules the day, then I will become much more fearful.
Being a successful investor or a farmer is a tough job. I’ll stop growing apples when my overly optimistic customers beg for more apples, and yields on oranges also improve. In the meantime, investors need to remember that no matter how confusing the market is, don’t put all your oranges (bonds) or apples (stocks) in one basket (portfolio) because the financial markets do not need to get any crazier than they are already.
Wade W. Slome, CFA, CFP®
Plan. Invest. Prosper.
DISCLOSURE: Sidoxia Capital Management (SCM) and some of its clients hold positions in certain exchange traded funds (ETFs), but at the time of publishing SCM had no direct position in any other security referenced in this article. No information accessed through the Investing Caffeine (IC) website constitutes investment, financial, legal, tax or other advice nor is to be relied on in making an investment or other decision. Please read disclosure language on IC Contact page.


