Posts tagged ‘irrational exuberance’
Rational or Irrational Exuberance?

The government may be shut down, but the stock market hasn’t noticed. In fact, stocks just capped another record-breaking month. The S&P 500 gained +2.3%, the NASDAQ climbed +4.7%, and the Dow rose +2.5%.
Millions of Americans are feeling the downside of the shutdown—from disrupted travel to stalled services and furloughed workers. Historically, such uncertainty rattles Wall Street. This time? Investors seem more captivated by the transformative promise of artificial intelligence (AI).
So, the key question today: Is this AI-driven exuberance rational—or irrational?
Exuberance Then vs. Exuberance Now
Having invested for more than 35 years, I’ve seen periods of euphoria and fear. I vividly remember December 1996 when Fed Chair Alan Greenspan famously questioned whether markets were becoming “irrationally exuberant.” Back then, the NASDAQ sat near 1,300. Over the next three years it soared past 5,100 (almost quadrupling), only to crash nearly 80% by 2002.
But here’s the twist: it’s true, we did experience a “tech bubble burst”, but where is the NASDAQ index value today? Amazingly, the index stands at 23,000 (see chart below) – an 18x increase above the 1996 level when Greenspan gave his irrational exuberance speech! So, in hindsight, the sound we heard during 2000 was not the tech bubble bursting but rather an internet Big Bang! The internet wasn’t a speculative fad—it was the foundation of a global transformation.
So, what about AI?

Source: Macrotrends LLC
Internet Cycle vs. AI Supercycle
The internet era lifted the number of online users from zero to five billion—over 60% of the planet (see chart below). The AI wave kicked off publicly in November 2022 with ChatGPT’s release. In under three years, the NASDAQ has more than doubled. That pace isn’t sustainable forever, of course. Bubbles form, emotions swing, and markets correct. But dismissing AI as a fad ignores its unmistakable—and accelerating—impact.

Source: BOND – Mary Meeker
With the rapid appreciation in the stock market, it’s important for investors to identify and understand the warning signs of potential bubble bursting or market crash. In fact, I continue to do my part by studying past crashes. My shipment of Andrew Ross Sorkin’s book, 1929: Inside the Greatest Crash in Wall Street History just arrived and all these lessons remind us that not all booms are bubbles, and not all crashes end innovation.
Not All Bubbles are Created Equal
Major market drawdowns are part of a long-term investor’s journey:
- 1929: Great Crash
- 1973-74: Nifty-Fifty
- 1987: Black Monday
- 2000: Dot-com bust
- 2008: Financial crisis
- 2020: COVID crash
Many pundits today are now asking is this AI surge the next bubble? Valuations, as measured by P/E ratios (Price/Earnings), suggest a very different setup than in 2000.
Back then, many tech leaders traded at 100x+ earnings. Today’s Magnificent Seven tech leaders are elevated, but nowhere near dot-com extremes:
- NVIDIA Corporation (NVDA): 57x
- Apple Inc. (AAPL): 36x
- Microsoft Corp. (MSFT): 36x
- Alphabet Inc. (GOOG): 32x
- Amazon.com, Inc. (AMZN): 31x
- Meta Platforms, Inc. (META): 23x
*Source: MarketSurge – only Tesla, Inc. (TSLA) has a P/E higher than 100x.
For the S&P 500 overall, the index has a forward P/E of 22.8x (Yardeni Research), significantly lower than 2000 levels and nowhere near bubble territory.
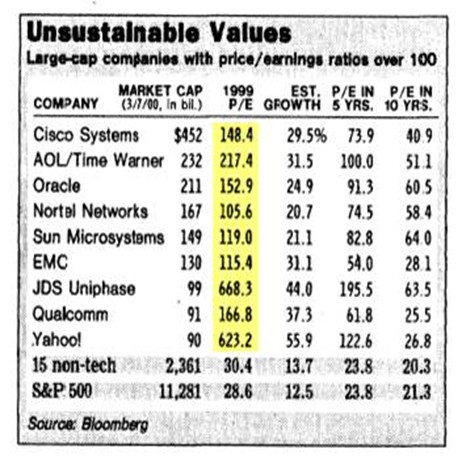
Source: Wall Street Journal – March 14, 2000
Life After the Internet and Life After AI Introduction
Think back 25 years:
- Renting movies at Blockbuster before Netflix went digital
- Driving to the bank for deposits
- Buying stamps to mail checks before Venmo or Zelle
Today, those activities feel prehistoric. AI is set to reshape daily life on an even faster timeline — from medicine and logistics to entertainment and marketing.
I’m discovering “AI epiphanies” weekly.
- With a few prompts, I created a beautiful Mother’s Day poem and became a poet hero despite never writing poetry before.
- When I recently needed to write an obituary for my mother, AI helped structure and refine it in minutes instead of taking me hours.
- Just last month I needed to hunt down lobster bisque for a shrimp pasta recipe I wanted to make. It turned into a time-wasting scavenger hunt. Thankfully, AI found it in stock, even when multiple apps insisted it wasn’t available. Needless to say, the recipe was incredibly delicious, and my stomach thanked ChatGPT.
And when it comes to investing? Evaluating biotech companies used to take weeks. Now, detailed research can be synthesized in days without sacrificing rigor. AI isn’t replacing insight — it’s amplifying output.
Not All AI Stories Are “Unicorns and Rainbows”
AI boosts productivity. Higher productivity means some companies need fewer people. Amazon recently announced 14,000 layoffs despite reporting amazing financial results. Microsoft and Meta have also announced thousands of employee layoffs even as profits rise.
This isn’t doom and gloom — it’s innovation cycles in action. Technology displaces tasks before ultimately creating new industries and roles.
So… Rational or Irrational?
Although there has been much debate regarding whether we are in an AI bubble, from my perspective, we are in the very early innings of a long AI revolutionary game. There are definitely pockets of frothiness that expose investors to undue risk, but if you can follow a disciplined, diversified, valuation-sensitive investment strategy, like we implement at Sidoxia Capital Management, I feel that the current exuberance is more rational than irrational.
Wade W. Slome, CFA, CFP®
Plan. Invest. Prosper.
This article is an excerpt from a previously released Sidoxia Capital Management complimentary newsletter (Nov. 3, 2025). Subscribe Here to view all monthly articles.
DISCLOSURE: Sidoxia Capital Management (SCM) and some of its clients hold positions in NVDA, AAPL, MSFT, GOOGL, AMZN, META, TSLA, and certain exchange traded funds (ETFs), but at the time of publishing had no direct position in any other security referenced in this article. No information accessed through the Investing Caffeine (IC) website constitutes investment, financial, legal, tax or other advice nor is to be relied on in making an investment or other decision. Please read disclosure language on IC Contact page.
Yellen is “Yell-ing” About High Stock Prices!

Earlier this week, Janet Yellen, chair of the U.S. Federal Reserve, spoke at the Institute for New Economic Thinking conference at the IMF headquarters in Washington, D.C. In addition to pontificating about the state of the global economy and the direction of interest rates, she also decided to chime in with her two cents regarding the stock market by warning stock values are “quite high.” She went on to emphasize “there are potential dangers” in the equity markets.
Unfortunately, those investors who have hinged their investment careers on the forecasts of economists, strategists, and Fed Chairmen have suffered mightily. Already, Yellen’s soapbox rant about elevated stock prices is being compared to former Fed Chairman Alan Greenspan’s “Irrational Exuberance” speech, which I have previously discussed on numerous occasions (see Irrational Exuberance Déjà Vu).
Greenspan’s bubble warning talk was given on December 5, 1996 when the NASDAQ closed around 1,300 (it closed at 5,003 this week). Greenspan specifically said the following:
“But how do we know when irrational exuberance has unduly escalated asset values, which then become subject to unexpected and prolonged contractions as they have in Japan over the past decade?”
After his infamous speech, the NASDAQ index almost quadrupled in value to 5,132 in the ensuing three years before cratering by approximately -78%,
Greenspan’s successor, economics professor Ben Bernanke, didn’t fare much better than the previous Fed Chairmen. Unlike many, I give full credit where credit is due. Bernanke deserves extra credit for his nimble but aggressive actions that helped prevent a painful recession from expanding into a protracted and lethal depression.
With that said, as late as May 2007, Bernanke noted Fed officials “do not expect significant spillovers from the subprime market to the rest of the economy.” Moreover, in 2005, near the peak in housing prices, Bernanke said the probability of a housing bubble was “a pretty unlikely possibility.” Bernanke went on to add housing price increases, “largely reflect strong economic fundamentals.” Greenspan concurred with Bernanke. Just a year prior, Greenspan noted that the increase in home values was “not enough in our judgment to raise major concerns.” History has proven how Bernanke and Greenspan could not have been more wrong.
If you still believe Yellen is the bee’s knees when it comes to the investing prowess of economists, perhaps you should review Long Term Capital Management (LTCM) debacle. In the midst of the 1998 Asian financial crisis, Robert Merton and Myron Scholes, two world renowned Nobel Prize winners almost single handedly brought the global financial market to its knees. Merton and Scholes used their lifetime knowledge of economics to create complex computerized investment algorithms. Everything worked just fine until LTCM lost $500 million in one day, which required a $3.6 billion bailout from a consortium of banks.
NASDAQ 5,000…Bubble Repeat?
Janet Yellen’s recent prognostication about the valuation of the U.S. stock market happens to coincide with the NASDAQ index breaking through the 5,000 threshold, a feat not achieved since the piercing of the technology bubble in the year 2000. Investing Caffeine readers and investors of mine understand today’s NASDAQ index is much different than the NASDAQ index of 15 years ago (see also NASDAQ Redux), especially when it comes to valuation. The folks at Bespoke put NASDAQ 5,000 into an interesting context by adding the important factor of inflation to the mix. Even though the NASDAQ index is within spitting distance of its all-time high of 5,132 (reached in 2000), the index would actually need to rally another +40% to reach an all-time “inflation adjusted” closing high (see chart below).

Source: Bespoke Investment Group
Economists and strategists are usually articulate, and their arguments sound logical, but they are notorious for being horribly bad at predicting the future, Janet Yellen included. I agree valuation is an all-important factor in determining future stock market returns. Howeer, by Robert Shiller, Janet Yellen, and a host of other economists relying on one flawed metric (CAPE PE), they have not only been wildly wrong year after year, but they are recklessly neglecting many other key factors (see also Shiller CAPE Smells Like BS).
I freely admit stocks will eventually go down, most likely a garden variety -20% recessionary decline in prices. While from a historical standpoint we are overdue for another recession (about two recessions per decade), this recovery has been the slowest since World War II, and the yield curve is currently not flashing any warning signals. When the eventual stock market decline happens, it likely will not be driven by high valuations. The main culprit for a bear market will be a decline in earnings – high valuations just act as gasoline on the fire. Janet Yellen will continue to offer her opinions on many aspects of the economy, but if she steps on her soapbox again and yells about stock market valuations, you will be best served by purchasing a pair of earplugs.

Wade W. Slome, CFA, CFP®
Plan. Invest. Prosper.
DISCLOSURE: Sidoxia Capital Management (SCM) and some of its clients hold positions in certain exchange traded funds (ETFs), but at the time of publishing, SCM had no direct position in any other security referenced in this article. No information accessed through the Investing Caffeine (IC) website constitutes investment, financial, legal, tax or other advice nor is to be relied on in making an investment or other decision. Please read disclosure language on IC Contact page.
NASDAQ Redux

The NASDAQ Composite index once again crossed the psychologically, all-important 5,000 threshold this week for the first time since the infamous tech-bubble burst in the year 2000. Of course, naturally, the media jumped on a non-stop, multi-day offensive comparing and contrasting today’s NASDAQ vs. the NASDAQ twin of yesteryear. Rather than rehash the discussion once again, I have decided to post three articles I published in recent years on the topic covering the outperformance of the spotlighted, tech-heavy index.
NASDAQ 5,000 Irrational Exuberance Déjà Vu?

Investors love round numbers and with the Dow Jones Industrial index recently piercing 17,000 and the S&P 500 index having broken 2,000 , even novice investors have something to talk about around the office water cooler. While new all-time records are being set for the major indices during September, the unsung, tech-laden NASDAQ index has yet to surpass its all-time high of 5,132 achieved 14 and ½ years ago during March of 2000.
Click Here to Read the Rest of the Article
NASDAQ and the R&D Tech Revolution

It’s been a bumpy start for stocks so far in 2014, but the fact of the matter is the NASDAQ Composite Index is up this year and hit a 14-year high in the latest trading session (highest level since 2000). The same cannot be said for the Dow Jones Industrial and S&P 500 indices, which are both lagging and down for the year. Not only did the NASDAQ outperform the Dow by almost +12% in 2013, but the NASDAQ has also trounced the Dow by over +70% over the last five years.
Click Here to Read the Rest of the Article
NASDAQ: The Ugly Stepchild

All the recent media focus has been fixated on whether the Dow Jones Industrial Average index (“The Dow”) will close above the 13,000 level. In the whole scheme of things, this specific value doesn’t mean a whole lot, but it does make for a great topic of conversation at a cocktail party. Today, the Dow is trading at 12,983, a level not achieved in more than three and a half years. Not a bad accomplishment, given the historic financial crisis on our shores and the debacle going on overseas, but I’m still not so convinced a miniscule +0.1% move in the Dow means much. While the Dow and the S&P 500 indexes garner the hearts and minds of journalists and TV reporters, the ugly stepchild index, the NASDAQ, gets about as much respect as Rodney Dangerfield (see also No Respect in the Investment World).
Click Here to Read the Rest of the Article
Wade W. Slome, CFA, CFP®
Plan. Invest. Prosper.
DISCLOSURE: Sidoxia Capital Management (SCM) and some of its clients hold positions in certain exchange traded funds (ETFs) , but at the time of publishing, SCM had no direct position in any other security referenced in this article. No information accessed through the Investing Caffeine (IC) website constitutes investment, financial, legal, tax or other advice nor is to be relied on in making an investment or other decision. Please read disclosure language on IC Contact page.
NASDAQ 5,000…Irrational Exuberance Déjà Vu?
Investors love round numbers and with the Dow Jones Industrial index recently piercing 17,000 and the S&P 500 index having broken 2,000 , even novice investors have something to talk about around the office water cooler. While new all-time records are being set for the major indices during September, the unsung, tech-laden NASDAQ index has yet to surpass its all-time high of 5,132 achieved 14 and ½ years ago during March of 2000.
A lot has changed since then. Leading up to the pricking of the technology bubble, talks of an overhyped market started as early as December 5, 1996, when then Federal Reserve Chairman Alan Greenspan made his infamous “irrational exuberance” speech.
“But how do we know when irrational exuberance has unduly escalated asset values, which then become subject to unexpected and prolonged contractions as they have in Japan over the past decade?”-Alan Greenspan (Federal Reserve Chairman 1987 – 2006)
On that date, the NASDAQ closed at 1,300. A little over three years later, before values cratered by -78%, the index almost quadrupled higher to 5,132. Looked at from a slightly different lens, here is how the major indexes have fared since Greenspan’s widely referenced speech almost 18 years ago:

Despite the world’s most powerful banker calling stock prices irrational, the Dow & S&P have almost tripled in value (+164% & +167%, respectively) and the NASDAQ has almost quadrupled (+251%). The 80%+ outperformance (excluding dividends) is impressive, but reasonable if you consider this increase amounts to about a +7.2% compounded annual appreciation value. Investors have experienced a lot of heartburn over that long timeframe, but for any buy-and-holders, these returns would have trounced returns realized in alternative safe haven vehicles like CDs, savings accounts, or bonds.
Price: The Almighty Metric
There are many valuation metrics to evaluate but the most universal one is the Price/Earnings ratio (P/E). Just as in the process of assessing the value of a car, house, or stock, the price you pay is usually the most important factor of the purchase. The same principle applies to stock indexes. The cheaper the price paid, the greater probability of earning superior returns in the future. Unfortunately for investors in technology stocks, there was not much value in the NASDAQ index during late-1999, early-2000. Historical P/E data for the NASDAQ index is tough to come by, but some estimates pegged the index value at 200x’s its earnings at the peak of the 2000 technology mania. In other words, for every $1 in profit the average NASDAQ company earned, investors were willing to pay $200…yikes.
Today, the NASDAQ 100 index (the largest 100 non-financial companies in the NASDAQ index), which can serve as a proxy for the overll NASDAQ index, carries a reasonable P/E ratio of approximately 20x on a forward basis (24x on a trailing basis) – about 90% lower than the peak extremes of the NASDAQ index in the year 2000.
Although NASDAQ valuations are much lower today than during the bursting 2000 tech bubble, P/E ratios for the NASDAQ 100 still remain about +20% higher than the S&P 500, which begs the question, “Is the premium multiple deserved?”
As I wrote about in the NASDAQ Tech Revolution, you get what you pay for. If you pay a peanut multiple, many times you get a monkey stock. In the technology world, there is often acute obsolescence risk (remember Blackberry – BBRY?) that can lead to massive losses, but there also exists a winner-takes-all dynamic. Just think of the dominance of Google (GOOG/L) in search advertising, Microsoft (MSFT) in the PC, or Amazon (AMZN) in e-commerce. It’s a tricky game, but following the direction of cash, investments, and product innovation are key in my mind if you plan on finding the long-term winners. For example, the average revenue growth for the top 10 companies in the NASDAQ 100 averaged more than +100% annually from the end of 1999 to the end of 2013. Identifying the “Old Tech Guard” winners is not overly challenging, but discovering the “New Tech Guard” is a much more demanding proposition.
In the winner-takes-all hunt, one need not go any further than looking at the massive role technology plays in our daily lives. Twenty years ago, cell phones, GPS, DVRs (Digital Video Recorders), e-Readers, tablets, electric cars, iPods/MP3s, WiFi mobility, on-demand digital media, video-conferencing, and cloud storage either did not exist or were nowhere near mainstream. Many of these technologies manifest themselves into a whole host of different applications that we cannot live without. One can compile a list of these life-critical applications by thumbing through your smartphone or PC bookmarks. The list is ever-expanding, but companies like Twitter (TWTR), Facebook (FB), Amazon (AMZN), Uber, Netflix (NFLX), Priceline (PCLN), Yelp, Zillow (Z), and a bevy of other “New Tech Guard” companies have built multi-billion franchises that have become irreplaceable applications in our day-to-day lives.
Underlying all the arbitrary index value milestones (e.g., Dow 17,000 and S&P 2,000) since the 1990s has a persistent and unstoppable proliferation of technology adoption across virtually every aspect of our lives. NASDAQ 5,000 may not be here quite yet, but getting there over the next year or two may not be much of a stretch. Speculative tendencies could get us there sooner, and macro/geopolitical concerns could push the milestone out, but when we do get there the feeling of NASDAQ 5,000 déjà vu will have a much stronger foundation than the fleeting euphoric emotions felt when investors tackled the same level in year 2000.
Wade W. Slome, CFA, CFP®
Plan. Invest. Prosper.
DISCLOSURE: Sidoxia Capital Management (SCM) and some of its clients own AAPL, GOOG/L, AMZN, NFLX bonds (short the equity), FB (non-discretionary), MSFT (non-discretionary), PCLN (non-discretionary) and a range of positions in certain exchange traded fund positions, but at the time of publishing SCM had no direct position in TWTR, Uber, YELP, Z, or any other security referenced in this article. No information accessed through the Investing Caffeine (IC) website constitutes investment, financial, legal, tax or other advice nor is to be relied on in making an investment or other decision. Please read disclosure language on IC Contact page.
Shiller CAPE Peaches Smell Like BS

If something sounds like BS, looks like BS, and smells like BS, there’s a good chance you’re probably eyeball-deep in BS. In the investment world, I encounter a lot of very intelligent analysis, but at the same time I also continually step into piles of investment BS. One of those piles of BS I repeatedly step into is the CAPE ratio (Cyclically Adjusted Price-to-Earnings) created by Robert Shiller. For those who are not familiar with Shiller, he is a Nobel Prize winner in economics who won the award in 2013 for his work on the “empirical analysis of asset prices.” Shiller vaulted into fame in large part due to the timing of his book, Irrational Exuberance, which was published during the 2000 technology market peak. He gained additional street-credibility in the mid-2000s when he spoke about the bubble developing in the real estate markets.
What is the CAPE?
Besides being a scapegoat for every bear that has missed the tripling of stock prices in the last five years, the CAPE effectively is a simple 10-year average of the P/E ratio for the S&P 500 index. The logic is simple, like many theories in finance and economics, there often are inherent mean-reverting principles that are accepted as rules-of-thumb. It follows that if the current 10-year CAPE is above the 134-year CAPE average, then stocks are expensive and you should avoid them. On the other hand, if the current CAPE were below the long-term CAPE average, then stocks are cheap and you should buy. Here is a chart of the Shiller CAPE:
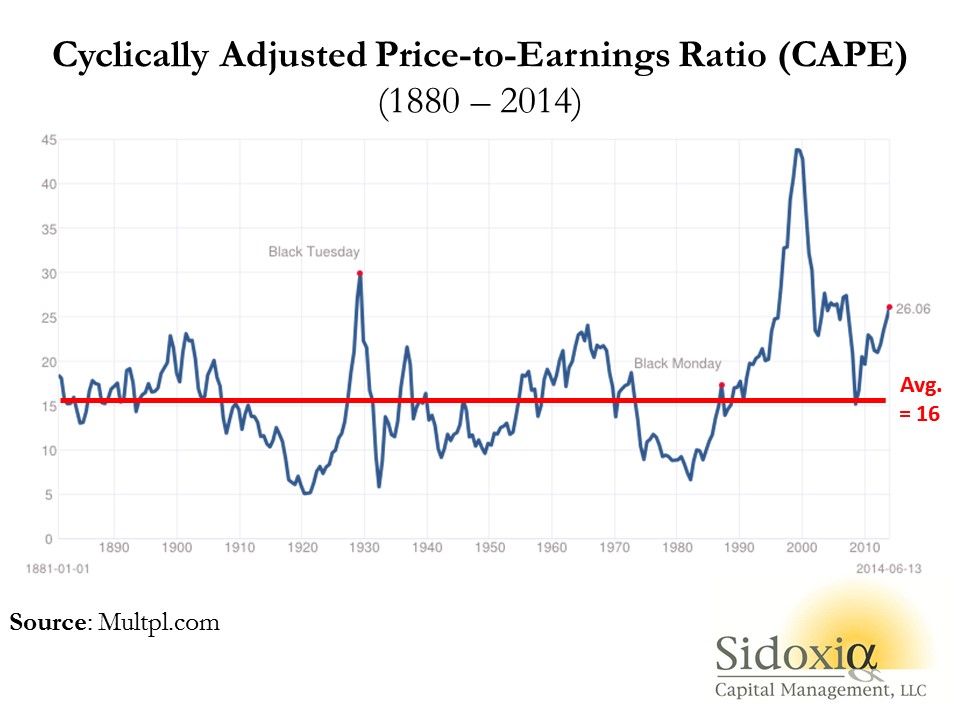
As you can see from the chart above, the current CAPE ratio of 26x is well above the 134-year average of 16x, which according to CAPE disciples makes the stock market very expensive. Or as a recent Business Insider article stated, the Shiller CAPE is “higher than at any point in the 20th century with the exception of the peaks of 1929 and 2000 – you know what happened after those.”
Problems Behind the Broken CAPE Tool
There are many problems with Shiller’s CAPE analysis, but let’s start with the basics by first asking, how useful has this tool actually been over the last, 10, 20, or 30 years? The short answer…not very. For example, if investors followed the implicit recommendation of the CAPE for the periods when Shiller’s model showed stocks as expensive (see above chart 1990 – 2014), they would have missed a more than quintupling (+469% ex-dividends) in the S&P 500 index. Over a shorter timeframe (2009 – 2014) the S&P 500 is up +114% ex-dividends (+190% since March 2009).
Even if you purchased at the worst time at the peak of the stock market in 2000 when the CAPE was 44 (S&P 500 – 1553), an investor would still have earned a total return of about +45% from 2000 – 2014, despite the CAPE still being 63% higher (more expensive) than the 134-year CAPE average of 16.
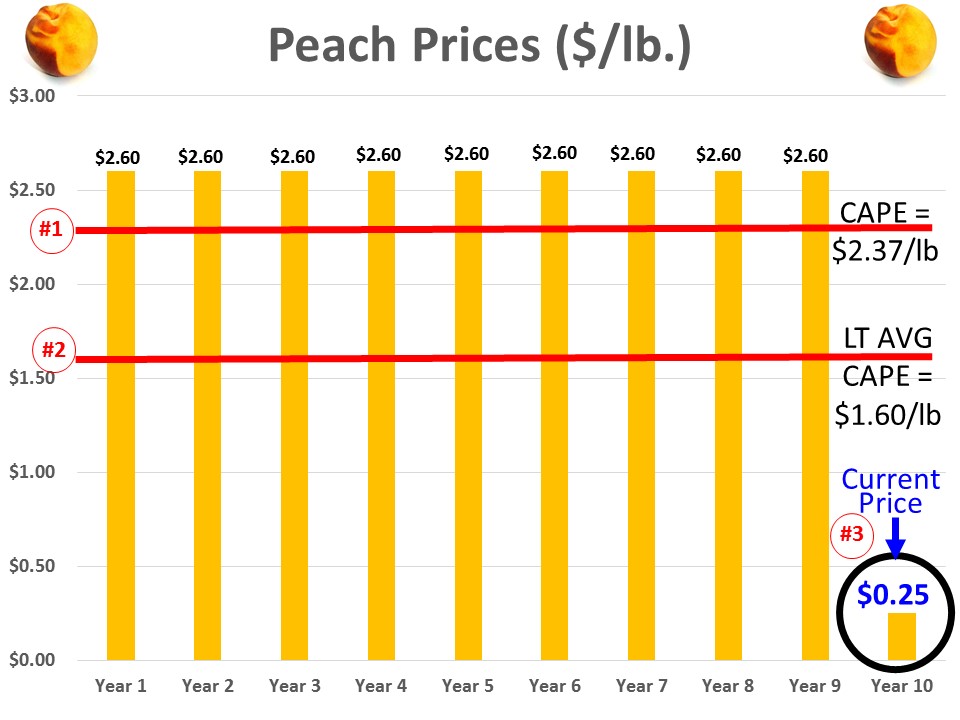
Peaches for $.25 Post-Bubble?
To illustrate a point, let’s assume you are a peach lover and due to a bubble in peach demand, prices spiked to an elevated level of $2.60 per pound for 9 years, but in year 10 the price plummeted to $.25 per pound today (see chart below). Assuming the 134-year average for peach prices was $1.60 per pound, would you still want to purchase your beloved peaches for the fire sale price of $.25 per pound? Common sense tells you $.25/lb. is a bargain, but if you asked the same question to Robert Shiller, he would say absolutely “NO”! The 10-year Peach CAPE ratio would be $2.37 ([9 yrs X $2.60] + [1 yr X $.25]) #1, but since the 10-year CAPE is greater than the LT-Average peach price of $1.60 per pound #2, Shiller would say peaches are too expensive, even though you could go to Kroger (KR) and buy a pound of peaches today for $0.25 #3.
This complete neglect of current market prices in the calculation of CAPE makes absolutely no sense, but this same dynamic of ignoring current pricing reality is happening today in the stock market. Effectively what’s occurring is the higher P/E ratios experienced over the last 10 years are distorting the Shiller CAPE ratio, thereby masking the true current value of stocks. In other words the current CAPE of 26x vastly exaggerates the pricey-ness of the actual S&P 500 P/E ratio of 16x for 2014 and 14x for 2015.
There are plenty of other holes to poke into CAPE, but the last major component of Shiller’s ratio I want to address is interest rates. Even if you disregard my previous negative arguments against Shiller’s CAPE, should anyone be surprised that the ratio troughed in the early 1980s of 7x when long-term interest rates peaked. If I could earn 18% on a CD with little risk in 1981, not many people should be dumbfounded that demand for risky stocks was paltry. Today, the reverse environment is in place – interest rates are near record lows. It should therefore come as no surprise, that all else equal, a higher P/E (and CAPE) is deserved when interest rates are this low. Nevertheless, this discussion of P/E and CAPE rarely integrates the critical factor of interest rates.
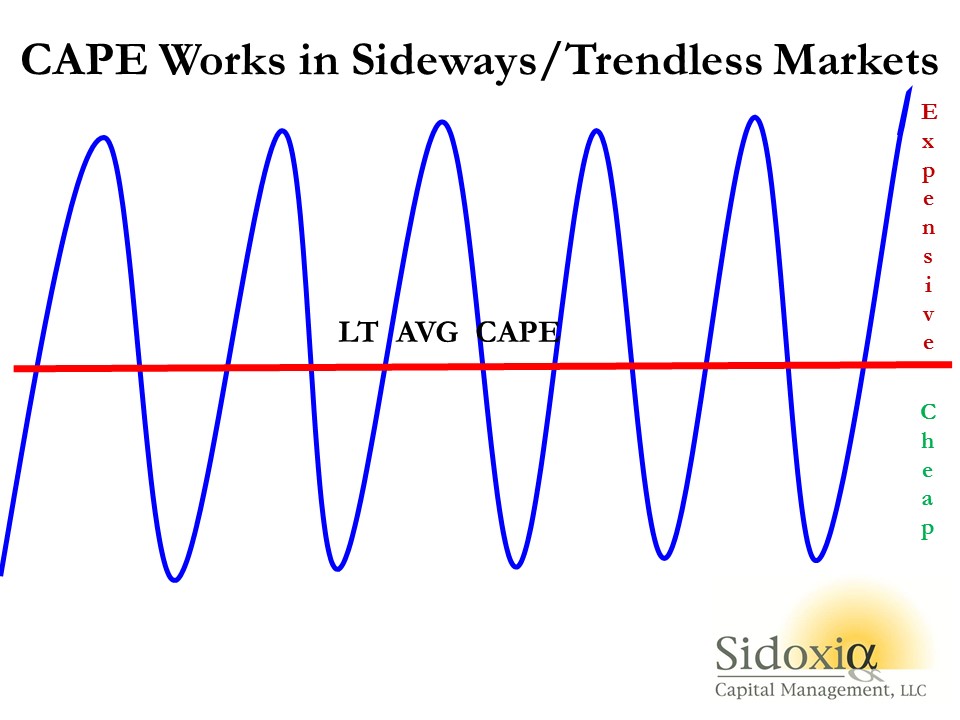
While I have spent a decent amount of time trashing the CAPE-BS ratio, I want to give my pal Bob Shiller a fair shake. I can do this by looking into a mirror and admitting there are periods when the CAPE ratio can actually work. Although the CAPE is effectively useless during long, multi-year upward and downward trending markets (think bubbles & depressions), the CAPE makes perfect sense in sideway, trendless markets (see chart below).
The investing public is always looking for a Holy Grail financial indicator that will magically guide them to riches in both up and down markets. Despite the popularity of Shiller’s CAPE ratio, regrettably no one perfect indicator exists. So before you jump on the bandwagon and chase the hot indicator du jour, make sure to look down and make sure you haven’t stepped in any Shiller CAPE-BS.
Wade W. Slome, CFA, CFP®
Plan. Invest. Prosper.
DISCLOSURE: Sidoxia Capital Management (SCM) and some of its clients hold long positions in certain exchange traded funds, but at the time of publishing SCM had no direct position in KR, or any other security referenced in this article. No information accessed through the Investing Caffeine (IC) website constitutes investment, financial, legal, tax or other advice nor is to be relied on in making an investment or other decision. Please read disclosure language on IC Contact page.
Confusing Fear Bubbles with Stock Bubbles
With the Dow Jones Industrial Average approaching and now breaking the 16,000 level, there has been a lot of discussion about whether the stock market is an inflating bubble about to burst due to excessive price appreciation? The reality is a fear bubble exists…not a valuation bubble. This fear phenomenon became abundantly clear from 2008 – 2012 when $100s of billions flowed out of stocks into bonds and trillions in cash got stuffed under the mattress earning near 0% (see Take Me Out to the Stock Game). The tide has modestly turned in 2013 but as I’ve written over the last six months, investor skepticism has reigned supreme (see Most Hated Bull Market Ever & Investors Snore).
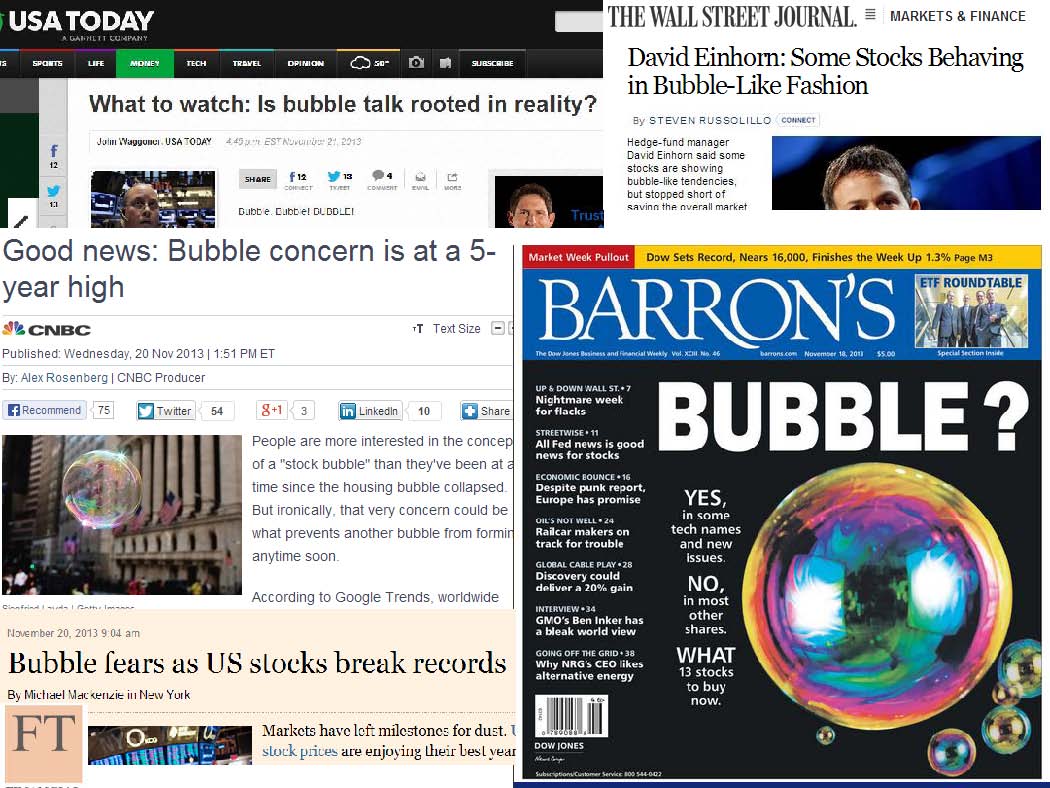
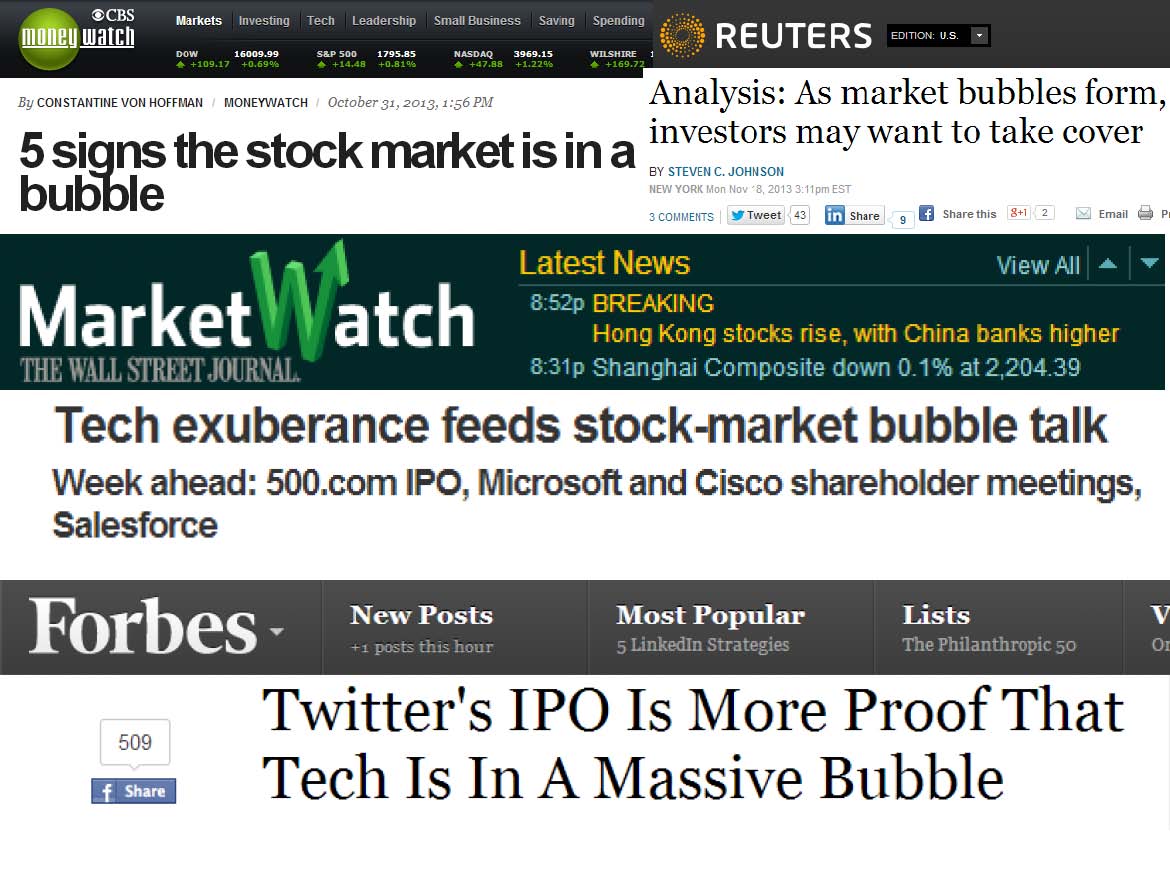
Volatility in stocks will always exist, but standard ups-and-downs don’t equate to a bubble. The fact of the matter is if you are reading about bubble headlines in prominent newspapers and magazines, or listening to bubble talk on the TV or radio, then those particular bubbles likely do not exist. Or as strategist and investor Jim Stack has stated, “Bubbles, for the most part, are invisible to those trapped inside the bubble.”
All the recent bubble talk scattered over all the media outlets only bolsters my fear case more. If we actually were in a stock bubble, you wouldn’t be reading headlines like these:
From 1,300 Bubble to 5,000
If you think identifying financial bubbles is easy, then you should buy former Federal Reserve Chairman Alan Greenspan a drink and ask him how easy it is? During his chairmanship in late-1996, he successfully managed to identify the existence of an expanding technology bubble when he delivered his infamous “irrational exuberance” speech. The only problem was he failed miserably on his timing. From the timing of his alarming speech to the ultimate pricking of the bubble in 2000, the NASDAQ index proceeded to more than triple in value (from about 1,300 to over 5,000).
Current Fed Chairman Ben Bernanke was no better in identifying the housing bubble. In his remarks made before the Federal Reserve Board of Chicago in May 2007, Bernanke had this to say:
“…We believe the effect of the troubles in the subprime sector on the broader housing market will likely be limited, and we do not expect significant spillovers from the subprime market to the rest of the economy or to the financial system. The vast majority of mortgages, including even subprime mortgages, continue to perform well.”
If the most powerful people in finance are horrible at timing financial market bubbles, then perhaps you shouldn’t stake your life’s savings on that endeavor either.
Bubbles History 101
Each bubble is unique in its own way, but analyzing previous historic bubbles can help understand future ones (see Sleeping Through Bubbles):
• Dutch Tulip-Mania: About 400 years ago in the 1630s, rather than buying a new house, Dutch natives were paying over $60,000 for tulip bulbs.
• British Railroad Mania: The overbuilding of railways in Britain during the 1840s.
• Roaring 20s: Preceding the Wall Street Crash of 1929 (-90% plunge in the Dow Jones Industrial average) and Great Depression, the U.S. economy experienced an extraordinary boom during the 1920s.
• Nifty Fifty: During the early 1970s, investors and traders piled into a set of glamour stocks or “Blue Chips” that eventually came crashing down about -90%.
• Japan’s Nikkei: The value of the Nikkei index increased over 450% in the eight years leading up to the peak of 38,957 in December 1989. Today, almost 25 years later, the index stands at about 15,382.
• Tech Bubble: Near the peak of the technology bubble in 2000, stocks like JDS Uniphase Corp (JDSU) and Yahoo! Inc (YHOO) traded for over 600x’s earnings. Needless to say, things ended pretty badly once the bubble burst.
As long as humans breathe, and fear and greed exist (i.e., forever), then we will continue to encounter bubbles. Unfortunately, we are unlikely to be notified of future bubbles in mainstream headlines. The objective way to unearth true economic bubbles is by focusing on excessive valuations. While stock prices are nowhere near the towering valuations of the technology and Japanese bubbles of the late 20th century, the bubble of fear originating from the 2008-2009 financial crisis has pushed many long-term bond prices to ridiculously high levels. As a result, these and other bonds are particularly vulnerable to spikes in interest rates (see Confessions of a Bond Hater).
Rather than chasing bubbles and nervously fretting over sensationalistic headlines, you will be better served by devoting your attention to the creation of a globally diversified investment portfolio. Own a portfolio that integrates a wide range of asset classes, and steers clear of popularly overpriced investments that the masses are talking about. When fear disappears and everyone is clamoring to buy stocks, you can be confident the stock bubble is ready to burst.
Wade W. Slome, CFA, CFP®
Plan. Invest. Prosper.
DISCLOSURE: Sidoxia Capital Management (SCM) and some of its clients hold positions in certain exchange traded funds (ETFs), but at the time of publishing SCM had no direct position in TWTR, JDSU, YHOO or any other security referenced in this article. No information accessed through the Investing Caffeine (IC) website constitutes investment, financial, legal, tax or other advice nor is to be relied on in making an investment or other decision. Please read disclosure language on IC Contact page.


