Archive for September, 2015
Coast is Clear Until 2019

The economic recovery since the Great Financial Crisis of 2008-09 has been widely interpreted as the slowest recovery since World War II. Bill McBride of Calculated Risk captures this phenomenon incredibly well in his historical job loss chart (see red line in chart below):
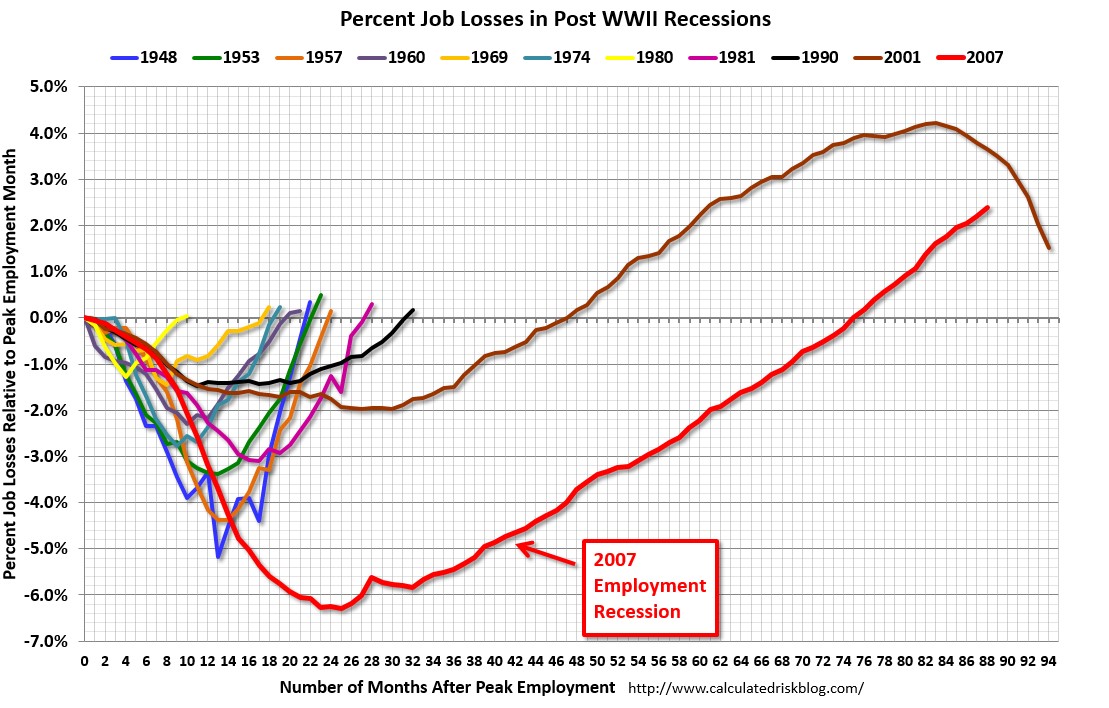
Source: Calculated Risk
History tells us that the economy traditionally suffers from an economic recession twice per decade, but we are closing in on seven years since the last recession with little evidence of impending economic doom.
So, are we due for another recession? Logic would dictate that since this recovery has been the slowest in a generation, the duration of this recovery should also be the longest. Strategist Ed Yardeni of Dr. Ed’s Blog uses data from historical economic cycles and CEI statistics (Coincident Economic Indicators) to make the same case. Based on his analysis, Yardeni does not see the next recession arriving until March 2019 (see chart below). If you take a look at the last five previous cycle peaks, recoveries generally last for an additional five and a half years (roughly 65 months). Since the last rebound to a cyclical peak occurred in October 2013, 65 months from then would imply the next downturn would begin in March 2019.
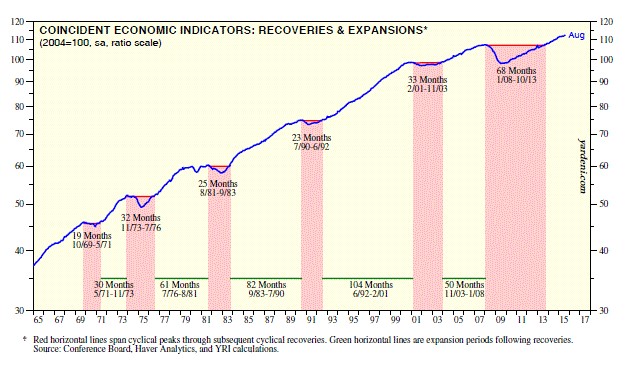
Source: Dr. Ed’s Blog
Typically, an economy loses steam and enters a recession after a phase of over-investment, tight labor conditions, and an extended period of tight central bank monetary policies. Over the last seven years, we have experienced quite the opposite. Corporations have been very slow to invest or hire new employees. For those employees hired, many of them are “under-employed” (i.e., working part-time), or in other words, these workers want more work hours. Our country’s slower-than-expected growth has created an output gap. Scott Grannis at Calafia Beach Pundit estimates this gap to approximate $2.8 trillion (see chart below). The CBO expects a smaller gap estimate of about $580 billion to narrow over the next few years. By Grannis’s calculations, there is a reservoir of 5 – 10 million jobs that could be tapped if the economy was operating more efficiently.
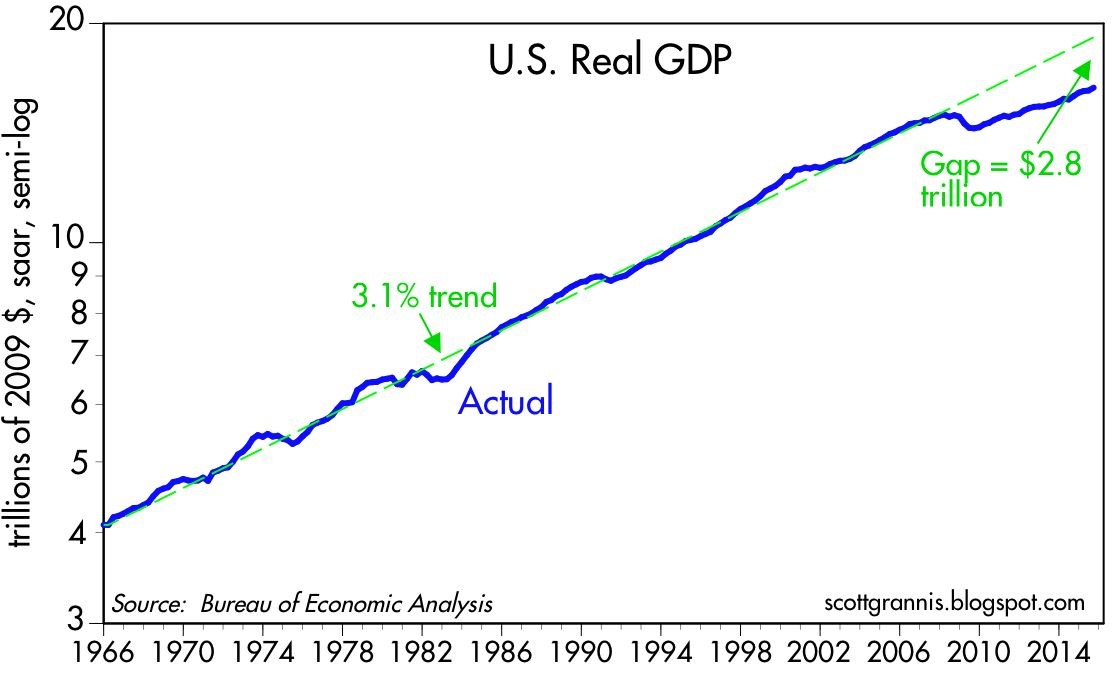
Source: Calafia Beach Pundit
Bolstering his argument, Grannis points out that the risk of a recession rises when there are significant capacity constraints and tight money. He sees the opposite happening – an enormous supply of unused capacity remains underutilized as he describes here:
“Today, money is abundant and resources are abundant. Even energy is abundant, because its price has fallen by over 50% in the past year or so. Corporate profits are near record highs, the supply of labor is virtually unconstrained, energy is suddenly cheap, and productive capacity is relatively abundant.”
While new uncertainties have been introduced (e.g., slowing China, potential government shutdown/sequestration, emerging market weakness), the reality remains there is always uncertainty. Even if you truly believe there is more uncertainty today relative to yesterday, the economy has some relatively strong shock absorbers to ride out the volatility.
There are plenty of potentially bad things to worry about, but if it’s a cyclical recession that you are worried about, then why don’t you grab a seat, order a coconut drink with an umbrella, and wait another three and a half years until you reach the circled date of March 2019 on your calendar.

Wade W. Slome, CFA, CFP®
Plan. Invest. Prosper.
DISCLOSURE: Sidoxia Capital Management (SCM) and some of its clients hold positions in certain exchange traded funds (ETFs) , but at the time of publishing, SCM had no direct position in any other security referenced in this article. No information accessed through the Investing Caffeine (IC) website constitutes investment, financial, legal, tax or other advice nor is to be relied on in making an investment or other decision. Please read disclosure language on IC Contact page.
To Test or Retest?

In Shakespeare’s tragedy Hamlet, the main character Prince Hamlet raises the existential question to himself, “To be, or not to be, that is the question?” With the recent -13% correction in the S&P 500 index, and subsequent mini-rebound, a lot of investors have also been talking to themselves and asking the fundamental question, “To test or retest, that is the question?” The inability of Fed Chairwoman dove, Janet Yellen, to increase the Federal Funds interest rate target by 0.25% after nine years only increased short-term uncertainty.
For investors playing in the stock market, uncertainty and corrections are par for the course. Howard Getson at Capitalogix recently pointed out the following.
Since 1900, on average, we’ve experienced…
- -5% market corrections: 3 times/year.
- -10% market corrections: 1 time/ year.
- -20% market corrections: 1 time/3.5 years.
However, no market correction is the same. Sure it would be nice if, during every bull market, the pain from any -10% correction lasted a second – similar to ripping off a Band-Aid. Unfortunately, when you live through such rapid and violent corrections, as we just did, volatility tends to stick around for a while. And in many instances, any brief rebound in stock prices is met with another downdraft in prices that retests the recent lows in prices.
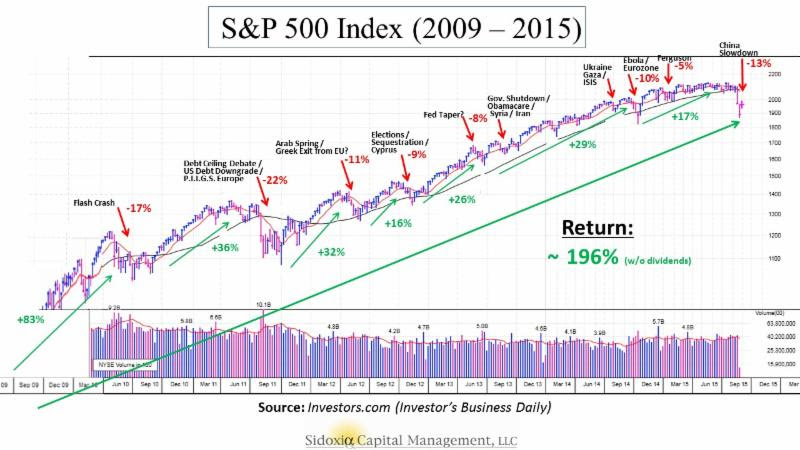
In the recent correction example, a retest of the lows would mean another -5% drop, on top of Friday’s -2% cut, to a level of 1,867 on the S&P 500 index. This is definitely a realistic probability (see chart below).
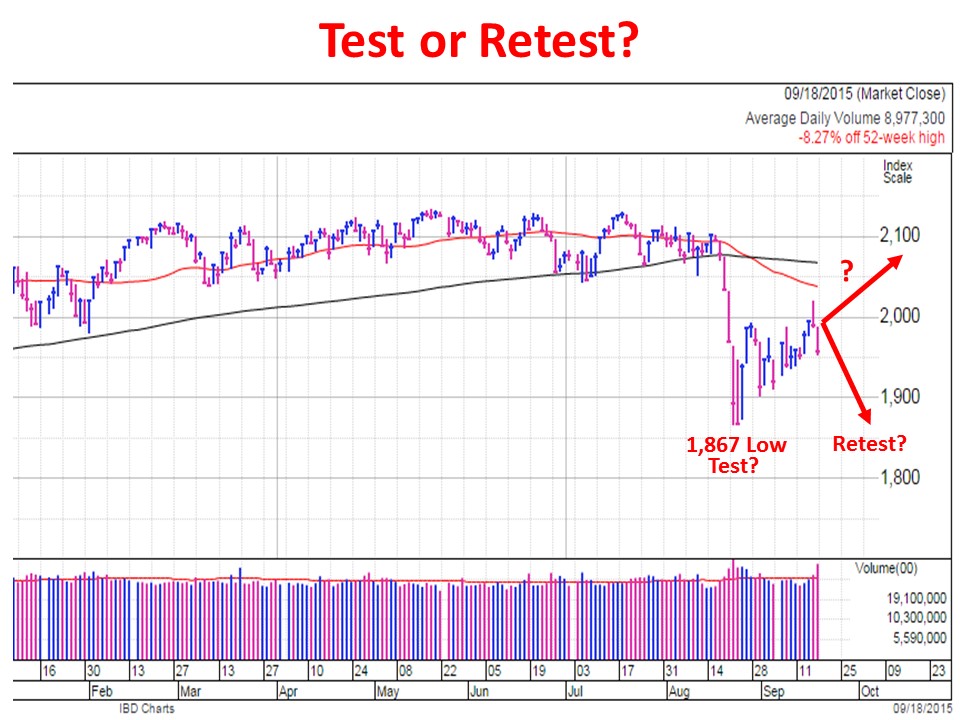
Chart Source: Investors.com (Powered by IBD)
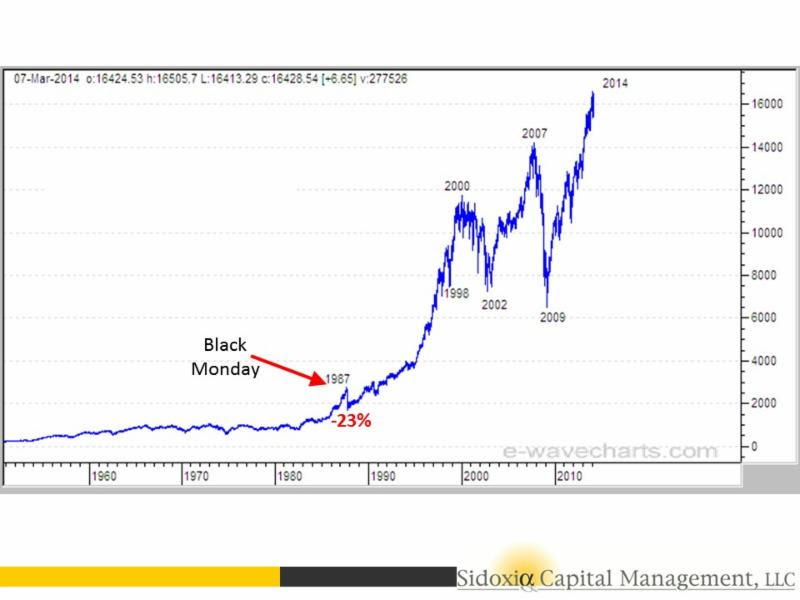
Although corrections are quite common, violent corrections are less common. Scott St. Clair, an analyst at MarketSmith, a division of William O’Neil & Co., recently did a study examining the frequency of 10%+ corrections occurring in four days or less across the three major indices (Dow Jones Industrial, S&P 500, and NASDAQ). Before the latest -15% decline in the NASDAQ from August 19th to August 24th, St. Clair only identified drops of -10% or more (in four trading sessions) eight previous times since the Great Depression (six of the eight periods are listed below).
- DJIA May 1940 -26% in eight days
- DJIA May 1962 -16% in 10 days
- S&P 500 Aug 1998 -15% in five days
- S&P 500 July 2002 -25% in 13 days
- S&P 500 October 2008 -33% in 15 days.
- S&P 500 August 2011 -19% in 13 days
Following all these corrections, the market always rebounded, but what St. Clair showed was in many cases stock prices had to retest the previous lows before advancing again.
As Mark Twain said, “History doesn’t repeat itself but it often rhymes,” which explains why this study is a useful historical exercise to prepare investors for potential future downdrafts. With that said, for long-term investors, much of this utility is marginal at best and useless at worst.
If you can’t handle the volatility, you need a more diversified portfolio, or you need to park your money in a savings account or CD and watch it melt away to inflation.
In reviewing corrections, famed growth investor Peter Lynch said it best:
“I can’t recall ever once having seen the name of a market timer on Forbes’ annual list of the richest people in the world. If it were truly possible to predict corrections, you’d think somebody would have made billions by doing it.”
Whether the August 24th low was the only test of this correction, or investors retest it again, is a moot point. Ignoring irrelevant headlines and focusing your attention on a low-cost, tax-efficient, globally diversified investment portfolio is a better use of your time. That is a tenet for which Hamlet would certainly be willing to die.

Wade W. Slome, CFA, CFP®
Plan. Invest. Prosper.
DISCLOSURE: Sidoxia Capital Management (SCM) and some of its clients hold positions in certain exchange traded funds (ETFs) , but at the time of publishing, SCM had no direct position in any other security referenced in this article. No information accessed through the Investing Caffeine (IC) website constitutes investment, financial, legal, tax or other advice nor is to be relied on in making an investment or other decision. Please read disclosure language on IC Contact page.
Oxymoron: Shrewd Government Refis Credit Card

With the upcoming Federal Reserve policy meetings coming up this Wednesday and Thursday, investors’ eyes remain keenly focused on the actions and words of Federal Reserve Chairwoman Janet Yellen.
If you have painstakingly filled out an IRS tax return or frustratingly waited in long lines at the DMV or post office, you may not be a huge fan of government services. Investors and liquidity addicted borrowers are also irritated with the idea of the Federal Reserve pulling away the interest rate punch bowl too soon. We will find out early enough whether Yellen will hike the Fed Funds interest rate target to 0.25%, or alternatively, delay a rate increase when there are clearer signs of inflation risks.
Regardless of the Fed decision this week, with interest rates still hovering near generational lows, it is refreshing to see some facets of government making shrewd financial market decisions – for example in the area of debt maturity management. Rather than squeezing out diminishing benefits by borrowing at the shorter end of the yield curve, the U.S. Treasury has been taking advantage of these shockingly low rates by locking in longer debt maturities. As you can see from the chart below, the Treasury has increased the average maturity of its debt by more than 20% from 2010 to 2015. And they’re not done yet. The Treasury’s current plan based on the existing bond issuance trajectory will extend the average bond maturity from 70 months in 2015 to 80 months by the year 2022.
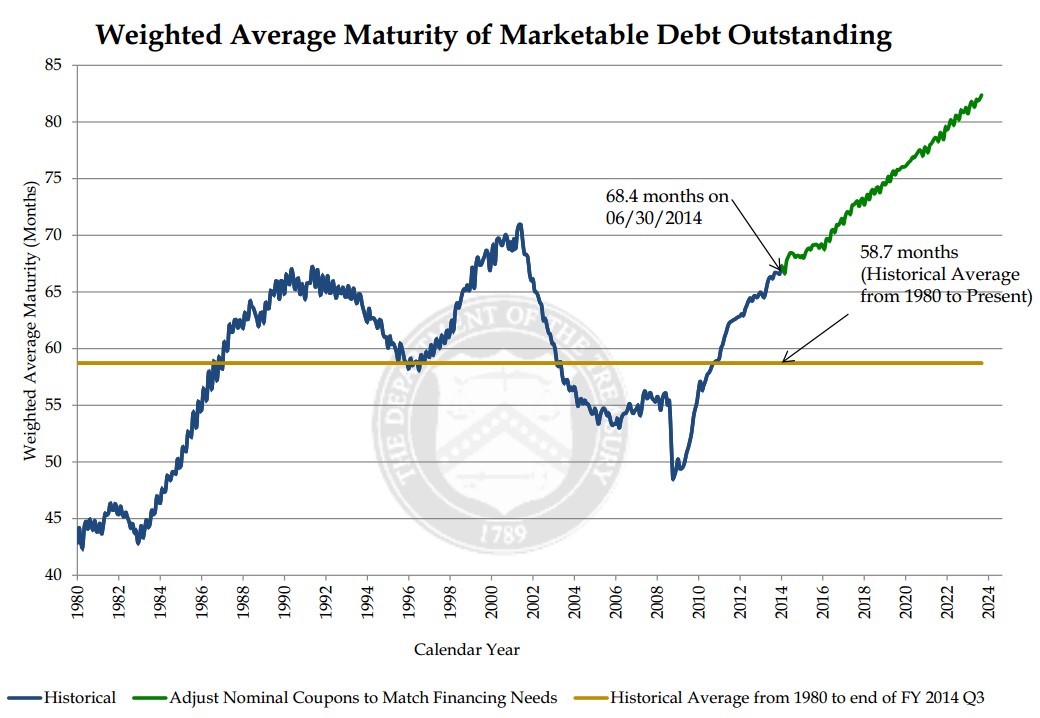
If you were racking up large sums of credit card debt at an 18% interest rate with payments due one month from now, wouldn’t you be relieved if you were given the offer to pay back that same debt a year from now at a more palatable 2% rate? Effectively, that is exactly what the government is opportunistically taking advantage of by extending the maturity of its borrowings.
Most bears fail to acknowledge this positive trend. The typical economic bear argument goes as follows, “Once the Fed pushes interest rates higher, interest payments on government debt will balloon, and government deficits will explode.” That argument definitely holds up some validity as newly issued debt will require higher coupon payments to investors. But at a minimum, the Treasury is mitigating the blow of the sizable government debt currently outstanding by extending the average Treasury maturity (i.e., locking in low interest rates).
It is worth noting that while extending the average maturity of debt by the Treasury is great news for U.S. tax payers (i.e., smaller budget deficits because of lower interest payments), maturity extension is not so great news for bond investors worried about potentially rising interest rates. Effectively, by the Treasury extending bond maturities on the debt owed, the government is creating a larger proportion of “high octane” bonds. By referring to “high octane” bonds, I am highlighting the “duration” dynamic of bonds. All else equal, a lengthening of bond maturities, will increase a bond’s duration. Stated differently, long duration, “high octane” bonds will collapse in price if in interest rates spike higher. The government will be somewhat insulated to that scenario, but not the bond investors buying these longer maturity bonds issued by the Treasury.
All in all, you may not have the greatest opinion about the effectiveness of the IRS, DMV, and/or post office, but regardless of your government views, you should be heartened by the U.S. Treasury’s shrewd and prudent extension of the average debt maturity. Now, all you need to do is extend the maturity and lower the interest rate on your personal credit card debt.

Wade W. Slome, CFA, CFP®
Plan. Invest. Prosper.
DISCLOSURE: Sidoxia Capital Management (SCM) and some of its clients hold positions in certain exchange traded funds (ETFs) , but at the time of publishing, SCM had no direct position in any other security referenced in this article. No information accessed through the Investing Caffeine (IC) website constitutes investment, financial, legal, tax or other advice nor is to be relied on in making an investment or other decision. Please read disclosure language on IC Contact page.
The Bungee Market

This article is an excerpt from a previously released Sidoxia Capital Management complimentary newsletter (September 1, 2015). Subscribe on the right side of the page for the complete text.
Are you an adrenaline junkie? You may be one and not even know it. If you are an investor in the stock market, you may have noticed a sinking feeling in your investment portfolio before a sharp bounce-back, much like a bungee jump. Before the recent drop of -6.6% in the Dow during August, some stock investors got lulled into a state of complacency, considering a tripling in stock prices over the last six years.
Almost any current or future news headline has the capability of potentially triggering a short-term bungee jump in stock prices. Now, worries over the health of the Chinese economy and financial markets, coupled with concerns of an impending rate hike by the Federal Reserve have created some tension for global financial markets. The slowdown in China should not be ignored, but as famed investor Bill Nygren pointed out, its impact should be placed in the proper context. China only represents 15% of global economic activity and U.S. exports to China only account for 0.7% of our GDP.
- 5% market corrections, 3 times per year on average (“correction” = price decline);
- 10% market corrections, 1 time per year on average; and
- 20% market corrections, 1 time every 3.5 years on average.
Welcome Back Volatility! Mini Flash Crash
- Economic growth revised higher (Q2 GDP raised to +3.7% from +2.3%)
- Unemployment rate continues to drop ( at 5.3%, a 7-year low)
- Interest rates near historic lows (3.95%, 30-year mortgage rate), which will remain massively stimulative even if the Fed modestly increases short-term rates
- U.S. corporate profits are near record highs (despite dampening effect of the strong U.S. dollar on exports)
- Reasonable valuations (improved after latest index price declines)
- Housing market on a steady recovery (existing home sales at multi-year highs and pricing up +6% vs. July of last year)
- Massively accommodative central banks around the globe (e.g., European Central Bank and People’s Bank of China)
Wade W. Slome, CFA, CFP®
Plan. Invest. Prosper.


