Archive for September, 2016
Invest or Die

Seventy-six million Baby Boomers are earning near 0% (or negative rates) and aren’t getting any younger in the process, which is forcing them and others to decide…invest or die. The risk of outliving your savings is becoming a larger reality these days. Demographics and economics are dictating that our aging population is living longer and earning less due to generationally low interest rates.
Richard Fisher, the former Dallas Federal Reserve president, understands these looming dynamics. Fisher has identified how low-interest rates are increasing investor discontent by pushing consumers to save more in order to meet retirement needs. The unintended consequence from low rates, he said, is “you’re going to have to save a hell of a lot more before you consume.”
Besides saving, the other option investors have is to lower your standard of living. For example, you could continually eat mac & cheese and sleep in a tent – that is indeed one way you could save money. However, your kids and/or desired lifestyle may make this way of life unpalatable for all. Rather, the proper approach to achieving a comfortable standard of living requires you to invest more efficiently and prudently.
What a lot of individuals fail to understand is that accepting too much risk can be just as dangerous as being too conservative, over the long run. Case in point, depositing your savings into a CD at current interest rates (near 0%) is the equivalent of burning your cash, as any income produced is overwhelmed by the deleterious effects of inflation. It would take more than a lifetime of CD interest income to equal equity returns earned over the last seven years. Since early 2009, stocks have more than tripled in value.
Given the prevailing economic and demographic trends, investors are slowly realizing the attractive income-producing nature of stocks relative to bonds. It has been a rare occurrence, but stocks, as measured by the S&P 500, continue to yield more than 10-Year Treasury Notes (2.0% vs. 1.6%, respectively) – see chart below. The picture for bonds looks even worse in many international markets, where $13 trillion in bonds are yielding negative interest rates. Unlike bonds, which generally pay fixed coupon payments for years at a time, stocks overall have historically increased their dividend payouts by approximately 6% annually.
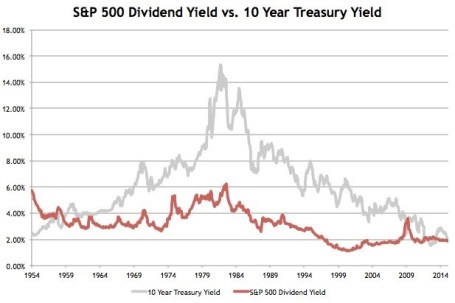
Source: Avondale Asset Management
With a scarcity of attractive investment alternatives available, investors will eventually be forced to adopt higher levels of equity risk, like it or not. However, this dynamic has yet to happen. Currently, actions are speaking louder than words, and as you can see, risk aversion reigns supreme with Americans tucking over $8 trillion dollars under their mattress (see chart below), in the form of savings accounts, earning next to nothing and jeopardizing retirements.
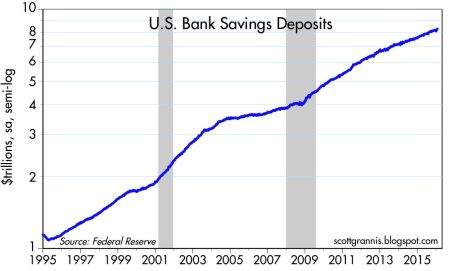
Source: Calafia Beach Pundit
Even if you fall into the camp that believes rates are artificially low by central bank printing presses, that doesn’t mean every company is recklessly leveraging their balance sheets up to the hilt. Many companies are still scared silly from the financial crisis and conservatively managing every penny of expense, like a stingy retiree living on a fixed income. Thanks to this reluctance to spend and hire aggressively, profit margins are at/near record highs. This financial stewardship has freed up corporations’ ability to pay higher dividends and implement discretionary stock buybacks as means to return capital to shareholders.
With the dovish Fed judiciously raising interest rates – only one rate hike of 0.25% over a decade (2006 – 2016) – there are no signs this ultra-low interest rate environment is going to turn aggressively higher anytime soon. Until economic growth, inflation, and interest rates return with a vengeance, and the persistent investor risk aversion abates, it behooves all the cash hoarders to….invest or die!

Wade W. Slome, CFA, CFP®
Plan. Invest. Prosper.
DISCLOSURE: Sidoxia Capital Management (SCM) and some of its clients hold positions in certain exchange traded funds (ETFs), but at the time of publishing had no direct position in any other security referenced in this article. No information accessed through the Investing Caffeine (IC) website constitutes investment, financial, legal, tax or other advice nor is to be relied on in making an investment or other decision. Please read disclosure language on IC Contact page.
EBITDA: Sniffing Out the Truth

Financial analysts are constantly seeking the Holy Grail when it comes to financial metrics, and to some financial number crunchers, EBITDA (Earnings Before Interest Taxes Depreciation and Amortization – pronounced “eebit-dah”) fits the bill. On the flip side, Warren Buffett’s right hand man Charlie Munger advises investors to replace EBITDA with the words “bullsh*t earnings” every time you encounter this earnings metric. We’ll explore the good, bad, and ugly attributes of this somewhat controversial financial metric.
The Genesis of EBITDA
The origin of the EBITDA measure can be traced back many years, and rose in popularity during the technology boom of the 1990s. “New Economy” companies were producing very little income, so investment bankers became creative in how they defined profits. Under the guise of comparability, a company with debt (Company X) that was paying high interest expenses could not be compared on an operational profit basis with a closely related company that operated with NO debt (Company Z). In other words, two identical companies could be selling the same number of widgets at the same prices and have the same cost structure and operating income, but the company with debt on their balance sheet would have a different (lower) net income. The investment banker and company X’s answer to this apparent conundrum was to simply compare the operating earnings or EBIT (Earnings Before Interest and Taxes) of each company (X and Z), rather than the disparate net incomes.
The Advantages of EBITDA
Although there is no silver bullet metric in financial statement analysis, nevertheless there are numerous benefits to using EBITDA. Here are a few:
- Operational Comparability: As implied above, EBITDA allows comparability across a wide swath of companies. Accounting standards provide leniency in the application of financial statements, therefore using EBITDA allows apples-to-apples comparisons and relieves accounting discrepancies on items such as depreciation, tax rates, and financing choice.
- Cash Flow Proxy:Since the income statement traditionally is the financial statement of choice, EBITDA can be easily derived from this statement and provides a simple proxy for cash generation in the absence of other data.
- Debt Coverage Ratios:In many lender contracts, certain debt provisions require specific levels of income cushion above the required interest expense payments. Evaluating EBITDA coverage ratios across companies assists analysts in determining which businesses are more likely to default on their debt obligations.
The Disadvantages of EBITDA
While EBITDA offers some benefits in comparing a broader set of companies across industries, the metric also carries some drawbacks.
- Overstates Income: To Charlie Munger’s point about the B.S. factor, EBITDA distorts reality by measuring income before a bunch of expenses. From an equity holder’s standpoint, in most instances, investors are most concerned about the level of income and cash flow available AFTERaccounting for all expenses, including interest expense, depreciation expense, and income tax expense.
- Neglects Working Capital Requirements: EBITDA may actually be a decent proxy for cash flows for many companies, however this profit measure does not account for the working capital needs of a business. For example, companies reporting high EBITDA figures may actually have dramatically lower cash flows once working capital requirements (i.e., inventories, receivables, payables) are tabulated.
- Poor for Valuation: Investment bankers push for more generous EBITDA valuation multiples because it serves the bankers’ and clients’ best interests. However, the fact of the matter is that companies with debt or aggressive depreciation schedules do deserve lower valuations compared to debt-free counterparts (assuming all else equal).
Wading through the treacherous waters of accounting metrics can be a dangerous game. Despite some of EBITDA’s comparability benefits, and as much as bankers and analysts would like to use this very forgiving income metric, beware of EBITDA’s shortcomings. Although most analysts are looking for the one-size-fits-all number, the reality of the situation is a variety of methods need to be used to gain a more accurate financial picture of a company. If EBITDA is the only calculation driving your analysis, I urge you to follow Charlie Munger’s advice and plug your nose.
Wade W. Slome, CFA, CFP®
Plan. Invest. Prosper.
DISCLOSURE: Sidoxia Capital Management (SCM) and some of its clients hold positions in certain exchange traded funds (ETFs), but at the time of publishing had no direct position in any other security referenced in this article. No information accessed through the Investing Caffeine (IC) website constitutes investment, financial, legal, tax or other advice nor is to be relied on in making an investment or other decision. Please read disclosure language on IC Contact page.
The Sky is Falling?

Investors reacted like the sky was falling on Friday. Commentators mostly blamed the -400 point decline in the Dow on heightened probabilities for a September rate hike by Janet Yellen and her fellow Federal Reserve colleagues. Geopolitical concerns over a crazy dictator in North Korea with nuclear weapons were identified as contributing factors to frazzled nerves.
The real question should be, “Are these stories complete noise, or should I pay close attention?” For the vast majority of times, the response to questions like these should be “yes”, the media headlines are mere distractions and you should simply ignore them. During the last rate hike cycle from mid-2004 to mid-2006, guess how many times the Fed raised rates? Seventeen times! And over those 17 rate hikes, stocks managed to respectably rise over 11%.
So far this cycle, Yellen and the Fed have raised interest rates one time, and the one and only hike was the first increase in a decade. Given all this data, does it really make sense to run in a panic to a bunker or cave? Whether the Fed increases rates by 0.25% during September or Decemberis completely irrelevant.
If we look at the current situation from a slightly different angle, you can quickly realize that making critical investment decisions based on short-term Federal Reserve actions would be foolish. Would you buy or sell a house based solely on this month’s Fed policy? For most, the answer is an emphatic “no”. The same response should hold true for stocks as well. The real reason anyone should consider buying any type of asset, including stocks, is because you believe you are paying a fair or discounted price for a stream of adequate future cash flows (distributions) and/or price appreciation in the asset value over the long-term.
The problem today for many investors is “short-termism.” This is what Jack Gray of Grantham, Mayo, Van Otterloo and Company had to say on the subject, “Excessive short-termism results in permanent destruction of wealth, or at least permanent transfer of wealth.” I couldn’t agree more.
Many people like to speculate or trade stocks like they are gambling in Las Vegas. One day, when the market is up, they buy. And the other day, when the market is down, they sell. However, those same people don’t wildly speculate with short-term decision-making when they buy larger ticket items like a lawn-mower, couch, refrigerator, car, or a house. They rationally buy with the intention of owning for years.
Yes, it’s true appliances, vehicles, and homes have utility characteristics different from other assets, but stocks have unique utility characteristics too. You can’t place leftovers, drive inside, or sit on a stock, but the long-term earnings and dividend growth of a diversified stock portfolio provides plenty of distinctive income and/or retirement utility benefits to a long-term investor.
You don’t have to believe me – just listen to investing greats like Warren Buffett:
“If you aren’t willing to own a stock for ten years, don’t even think about owning it for ten minutes. Put together a portfolio of companies whose aggregate earnings march upward over the years, and so also will the portfolio’s market value.”
The common sense test can also shed some light on the subject. If short-term trading, based on the temperature of headlines, was indeed a lucrative strategy, then the wealthiest traders in the world would be littered all over the Forbes 100 list. There are many reasons that is not the case.
Even though the Volatility Index (aka, “Fear Gauge” – VIX) spiked +40% in a single day, that does not necessarily mean stock investors are out of the woods yet. We saw similar volatility occur last August and during January and June of this year. At the same time, there is no need to purchase a helmet and run to a bunker…the sky is not falling.
Other related article: Invest with a Telescope…Not a Microscope
Wade W. Slome, CFA, CFP®
Plan. Invest. Prosper.
DISCLOSURE: Sidoxia Capital Management (SCM) and some of its clients hold positions in certain exchange traded funds (ETFs), but at the time of publishing had no direct position in any other security referenced in this article. No information accessed through the Investing Caffeine (IC) website constitutes investment, financial, legal, tax or other advice nor is to be relied on in making an investment or other decision. Please read disclosure language on IC Contact page.
Huh… Stocks Reach a Record High?

This article is an excerpt from a previously released Sidoxia Capital Management complimentary newsletter (September 1, 2016). Subscribe on the right side of the page for the complete text.
The stock market hit all-time record highs again in August, but despite the +6.2% move in 2016 S&P 500 stock prices (and +225% since early 2009), investors continue to scratch their heads in confusion. Individuals continue to ask, “Huh, how can stocks be trading at or near record levels (+6% for the year) when Brexit remains a looming overhang, uncertainty surrounds the U.S. presidential election, global terrorist attacks are on the rise, negative interest rates are ruling the day, and central banks around the globe are artificially propping up financial markets (see also Fed Myths vs. Reality)? Does this laundry list of concerns stress you out? If you said “yes”, you are not alone.
As I’ve pointed out in the past, we live in a different world today. In the olden days, terrorist attacks, natural disasters, currency crises, car chases, bank failures, celebrity DUIs, and wars happened all the time. However, before the internet existed, people either never heard about these worries, or they just didn’t care (or both). Today, we live in a Twitter, Facebook, Instagram, Snapchat, society with 500+ cable channels, and supercomputers in the palm of our hands (i.e., smartphones) with more computing power than existed on the Apollo mission to the moon. In short, doom-and-gloom captures human attention and sells advertising, the status quo does not.
- Record corporate profits are on the rise
- Stabilizing value of the dollar
- Stabilizing energy and commodity prices
- Record low interest rates
- Skeptical investing public
Fortunately, the stock market pays more attention to these important dynamics, rather than the F.U.D. (Fear, Uncertainty, Doubt) peddled by the pundits, bloggers, and TV talking heads. Certainly, any or all of the previously mentioned positive factors could change or deteriorate over time, but for the time being, the bulls are winning.
Let’s take a closer look at the influencing components that are driving stock prices higher:
Record Corporate Profits

Source: Yardeni.com
Profits are the mother’s milk that feeds the stock market. During recessions, profits are starved and stock prices decline. On the flip side, economic expansions feed profits and cause share prices to rise. As you can see from the chart above, there was a meteoric rise in corporate income from 2009 – 2014 before a leveling off occurred from 2015 going into 2016. The major headwinds causing profits to flatten was a spike of 25% in the value of the U.S. dollar relative to the value of other global currencies, all within a relatively short time span of about nine months (see chart below).

Why is this large currency shift important? The answer is that approximately 40% of multinational profits derived by S&P 500 companies come from international markets. Therefore, when the value of the dollar rose 25%, the cost to purchase U.S. products and services by foreign buyers became 25% costlier. Selling dramatically higher cost goods abroad squeezed exports, which in turn led to a flattening of profits. Time will tell, but as I showed in the first chart, the slope of the profit line has resumed its upwards trajectory, which helps explain why stock prices have been advancing in recent months.
Besides a strong dollar, another negative factor that temporarily weakened earnings was the dramatic decline in oil prices (see chart below) Two years ago, WTI oil prices were above $100 per barrel. Today, prices are hovering around $45 per barrel. As you can imagine, this tremendous price decline has had a destructive impact on the profits of the energy sector in general. The good news is that after watching prices plummet below $30 earlier this year, prices have since stabilized at higher levels. In other words, the profits headwind has been neutralized, and if global economic growth recovers further, the energy headwind could turn into an energy tailwind.

Record Low Interest Rates
Stocks were not popular during the early 1980s. In fact, the Dow Jones Industrial Average traded at 2,600 in 1980 vs 18,400 today. The economy was much smaller back then, but another significant overhang to lower stock prices was higher interest rates (and inflation). Back in 1980, the Federal Funds target rate set by the Federal Reserve reached a whopping 20.0% versus today the same rate sits at < 0.5%.
Why is this data important? When you can earn a 16.99% yield in a one-year bank CD (see advertisement below), generally there is a much smaller appetite to invest in riskier, more volatile stocks. Another way to think about rates is to equate interest rates to the cost of owning stocks. When interest rates were high, the relative cost to own stocks was also high, so many investors liquidated stocks. It makes perfect sense that stocks in that high interest rate environment of 1980 would be a lot less attractive compared to a relatively safe CD that paid 17% over a 12-month period.

On the other hand, when interest rates are low, the relative cost of owning stocks is low, so it makes sense that stock prices are rising in this environment. Just like profits, interest rates are not static, and they too can change rapidly. But as long as rates remain near record lows, and profits remain healthy, stocks should remain an appealing asset class, especially given the scarcity of strong alternatives.
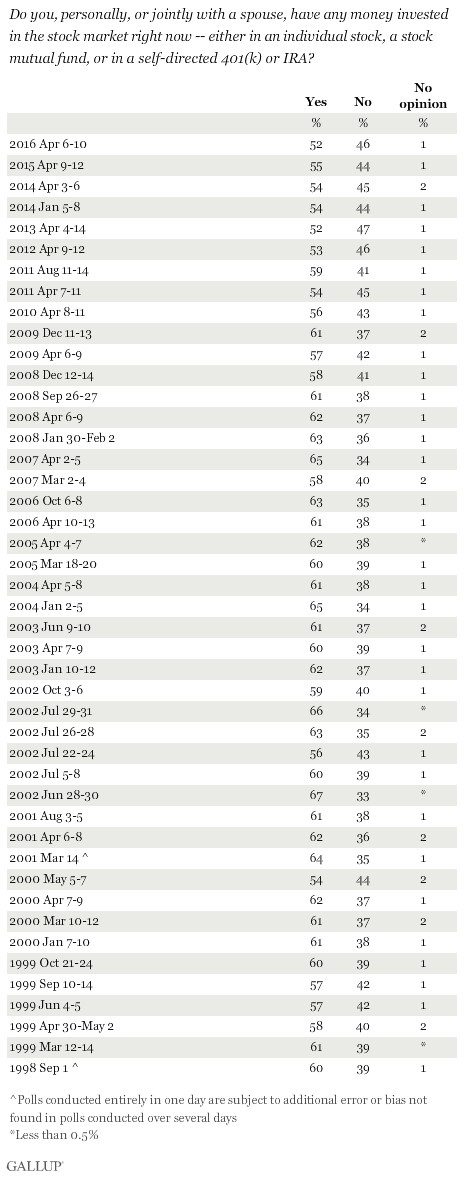
Skeptical Investing Public
The last piece of the puzzle to examine in order to help explain the head-scratching record stock prices is the pervasive skepticism present in the current stock market. How can Brexit, presidential election, terrorism, negative interest rates, and uncertain Federal Reserve policies be good for stock prices? Investing in many respects can be like navigating through traffic. When everyone wants to drive on the freeway, it becomes congested and a bad option, therefore taking side-streets or detours is a better strategy. The same principle applies to the stock market. When everyone wants to invest in the stock market (like during the late 1990s) or buy housing (mid-2000s), prices are usually too inflated, and shrewd investors decide to choose a different route by selling.
The same holds true in reverse. When nobody is interested in investing (see also, 18-year low in stock ownership and two trillion of stocks sold), then generally that is a strong sign that it is a good time to buy. Currently, skepticism is plentiful, for all the reasons cited above, which is a healthy investment indicator. Many individuals continue reading the ominous headlines and scratching their heads in confusion over today’s record stock prices. In contrast, at Sidoxia, we have opportunistically benefited from investors’ skepticism by discovering plenty of attractive opportunities for our clients. There’s no confusion about that.
Wade W. Slome, CFA, CFP®
Plan. Invest. Prosper.
DISCLOSURE: Sidoxia Capital Management (SCM) and some of its clients hold positions in certain exchange traded funds (ETFs) and FB, but at the time of publishing had no direct position in TWTR or any other security referenced in this article. No information accessed through the Investing Caffeine (IC) website constitutes investment, financial, legal, tax or other advice nor is to be relied on in making an investment or other decision. Please read disclosure language on IC Contact page.


