Archive for December, 2014
Why 0% Rates? Tech, Globalization & EM (Not QE)

Recently I have written about the head-scratching, never-ending, multi-decade decline in long-term interest rates (see chart below). Who should care? Well, just about anybody, if you bear in mind the structure of interests rates impacts the cost of borrowing on mortgages, credit cards, automobiles, corporate bonds, savings accounts, and practically every other financial instrument you can possibly think of. Simplistic conventional thinking explains the race to 0% global interest rates by the loose monetary Quantitative Easing (QE) policies of the Federal Reserve. But validating that line of thinking becomes more challenging once you consider QE ended months ago. What’s more, contrary to common belief, rates declined further rather than climb higher after QE’s completion.
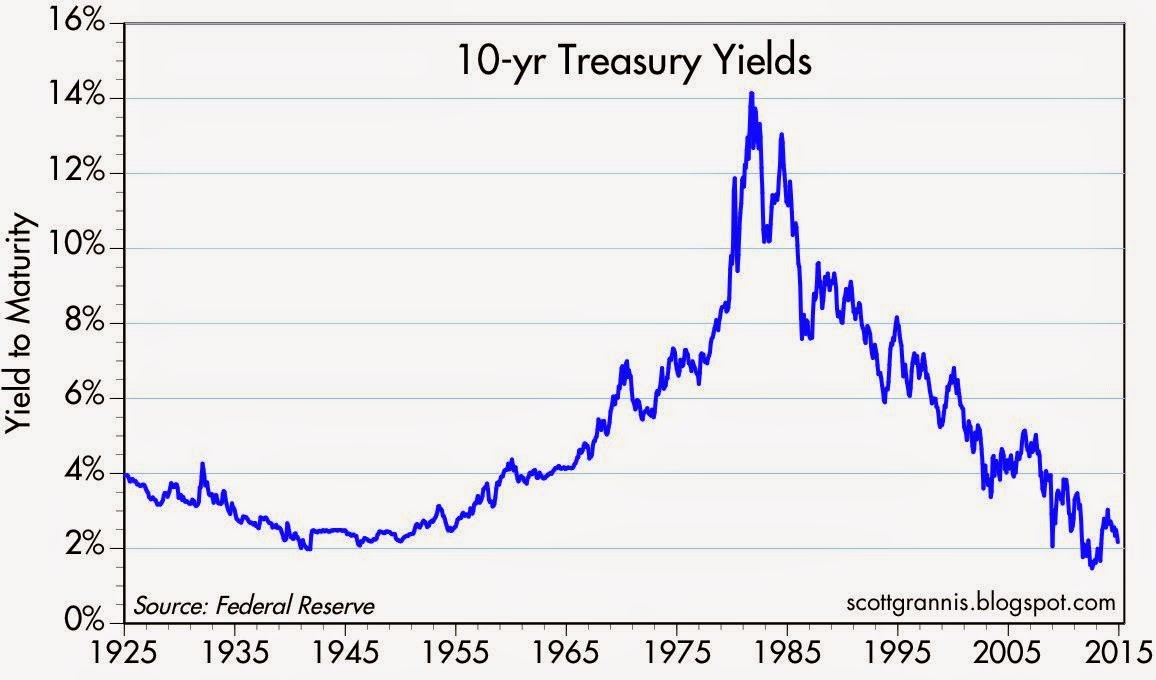
Source: Calafia Beach Pundit
More specifically, if you look at rates during this same time last year, the yield on the 10-Year Treasury Note had more than doubled in the preceding 18 months to a level above 3.0%. The consensus view then was that the eventual wind-down of QE would only add gasoline to the fire, causing bond prices to decline and rates to extend an indefinite upwards march. Outside of bond guru Jeff Gundlach, and a small minority of prognosticators, the herd was largely wrong – as is usually the case. As we sit here today, the 10-Year Note currently yields a paltry 2.26%, which has led to the long-bond iShares 20-Year Treasury ETF (TLT) jumping +22% year-to-date (contrary to most expectations).
The American Ostrich
Like an ostrich sticking its head in the sand, us egocentric Americans tend to ignore details relating to others, especially if the analyzed data is occurring outside the borders of our own soil. Unbeknownst to many, here are some key country interest rates below U.S. yields:
- Switzerland: 0.33%
- Japan: 0.34%
- Germany: 0.60%
- Finland: 0.70%
- Austria: 0.75%
- France: 0.88%
- Denmark: 0.89%
- Sweden: 0.98%
- Ireland: 1.29%
- Spain: 1.69%
- Canada 1.80%
- U.K: 1.85%
- Italy: 1.93%
- U.S.: 2.26% (are our rates really that low?)
Outside of Japan, these listed countries are not implementing QE (i.e., “Quantitative Easing”) as did the United States. Rather than QE being the main driver behind the multi-decade secular decline in interest rates, there are other more important disinflationary forces at work driving interest rates lower.
Technology, Globalization, and Emerging Market Competition (T.G.E.M.)
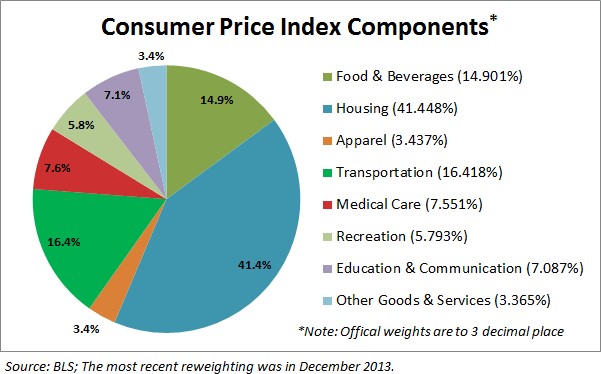
While tracking the endless monthly inflation statistics is a useful exercise to understand the tangible underlying pricing components of various industry segments (e.g., see 20 pages of CPI statistics), the larger and more important factors can be attributed to the somewhat more invisible elements of technology, globalization, and emerging market competition (T.G.E.M).
Starting with technology, to put these dynamics into perspective, consider the number of transistors, or the effective horsepower, on a semiconductor (a.k.a. computer “chip”) today. The overall impact on global standards of living is nothing short of astounding. Take an Intel chip for example – it had approximately 2,000 transistors in 1971. Today, semiconductors can cram over 10,000,000,000 (yes billions – 5 million times more) transistors onto a single semiconductor. Any individual can look no further than their smartphone to understand the profound implications this has not only on pricing in general, but society overall. To illustrate this point, I would direct you to a post highlighted by Professor Mark J. Perry, who observed the cost to duplicate an iPhone during 1991 would have been more than $3,500,000!
There are an infinite number of examples depicting how technology has accelerated the adoption of globalization. More recently, events such as the Arab Spring point out how Twitter (TWTR) displaced costly military engagement alternatives. The latest mega-Chinese IPO of Alibaba (BABA) was also emblematic of the hunger experienced in emerging markets to join the highly effective economic system of global capitalism.
I think New York Times journalist Tom Friedman said it best in his book, The World is Flat, when he made the following observations about the dynamics occurring in emerging markets:
“My mom told me to eat my dinner because there are starving children in China and India – I tell my kids to do their homework because Chinese and Indians are starving for their jobs”.
“France wants a 35 hour work week, India wants a 35 hour work day.”
There may be a widening gap between rich and poor in the United States, but technology and globalization is narrowing the gap across the rest of the world. Consider nearly half of the world’s population (3 billion+ people) live in poverty, earning less than $2.50 a day (see chart below). Technology and globalization is allowing this emerging middle class climb the global economic ladder.
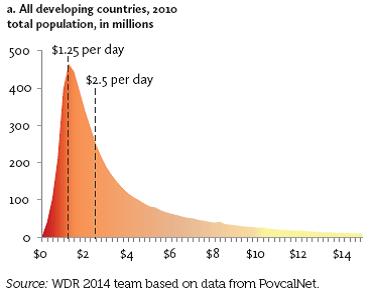
These impoverished individuals may not be imminently stealing our current jobs and driving general prices lower, but their children, and the countless educated millions in other international markets are striving for the same economic security and prosperity we have. The educated individuals in the emerging markets that have tasted capitalism are giving new meaning to the word “urgency”, which is only accelerating competition and global pricing pressures. It comes as no surprise to me that this generational migration from the poor to the middle class is putting a lid on inflation and interest rates around the world.
Declining costs of human labor from emerging markets however is not the only issue putting a ceiling on general prices. Robotics, an area in which Sidoxia holds significant investments, continues to be an area of fascination for me. With human labor accounting for the majority of business costs, it’s no wonder the C-suite is devoting more investment dollars towards automation. Rather than hire and train expensive workers, why not just buy a robot? This is not just happening in the U.S. – in fact the Chinese purchased more robots than Americans last year. And why not? An employer does not have to pay a robot overtime compensation; a robot never shows up late; robots never sue for discrimination or harassment; robots receive no healthcare or retirement benefits; and robots work 24 hours/day, 7 days/week, and 365 days/year.
While newspapers, bloggers, and talking heads like to point to the simplistic explanation of loose, irresponsible monetary policies of global central banks as the reason behind a four decade drop in interest rates that is only a small part of the story. Investors and policy makers alike should be paying closer attention to the factors of technology, globalization, and emerging market competition as the more impactful dynamics systematically driving down long term interest rates and inflation.

Wade W. Slome, CFA, CFP®
Plan. Invest. Prosper.
DISCLOSURE: Sidoxia Capital Management (SCM) and some of its clients own a range of positions, including long positions in certain exchange traded fund positions and INTC (short position in TLT), but at the time of publishing SCM had no direct position in BABA, TWTR or any other security referenced in this article. No information accessed through the Investing Caffeine (IC) website constitutes investment, financial, legal, tax or other advice nor is to be relied on in making an investment or other decision. Please read disclosure language on IC Contact page.
Santa and the Rate-Hike Boogeyman

Boo! … Rates are about to go up. Or are they? We’re in the fourth decade of a declining interest rate environment (see Don’t be a Fool), but every time the Federal Reserve Chairman speaks or monetary policies are discussed, investors nervously look over their shoulder or under their bed for the “Rate Hike Boogeyman.” While this nail-biting mentality has resulted in lost sleep for many, this mindset has also unfortunately led to a horrible forecasting batting average for economists. Santa and many equity investors have ignored the rate noise and have been singing Ho Ho Ho as stock prices hover near record highs.
A recent Deutsche Bank report describes the prognostication challenges here:
i.) For the last 10 years, professional forecasters have consistently been wrong on their predictions of rising interest rates.
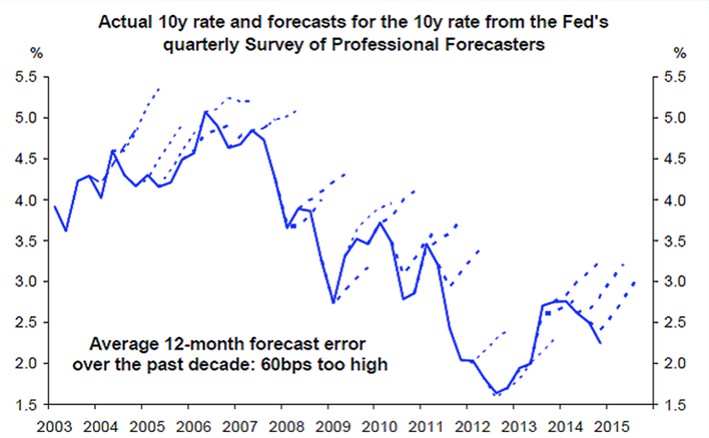
Source: Deutsche Bank via Vox
ii.) For the last five years, investors haven’t fared any better. As you can see, they too have been continually wrong about their expectations for rising interest rates.
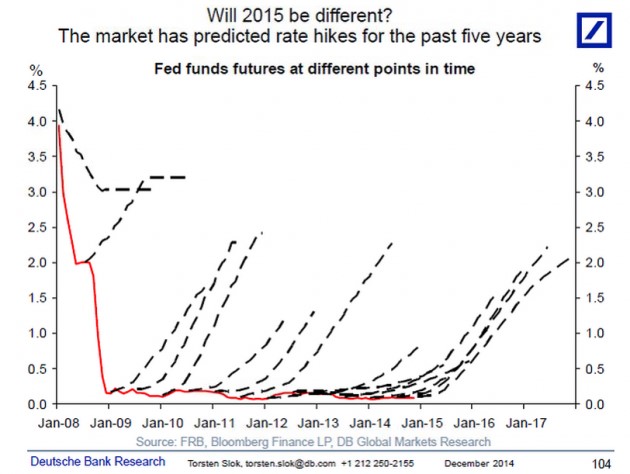
Source: Deutsche Bank via Vox
I’m the first to admit that rates have remained “lower for longer” than I guessed, but unlike many, I do not pretend to predict the exact timing of future rate increases. I strongly believe inevitable interest rate rises are not a matter of “if” but rather “when”. However, trying to forecast the timing of a rate increase can be a fool’s errand. Japan is a great case in point. If you take a look at the country’s interest rates on their long-term 10-year government bonds (see chart below), the yields have also been declining over the last quarter century. While the yield on the 10-Year U.S. Treasury Note is near all-time historic lows at 2.18%, that rate pales in comparison to the current 10-Year Japanese Bond which is yielding a minuscule 0.36%. While here in the states our long-term rates only briefly pierced below the 2% threshold, as you can see, Japanese rates have remained below 2% for a jaw-dropping duration of about 15 years.
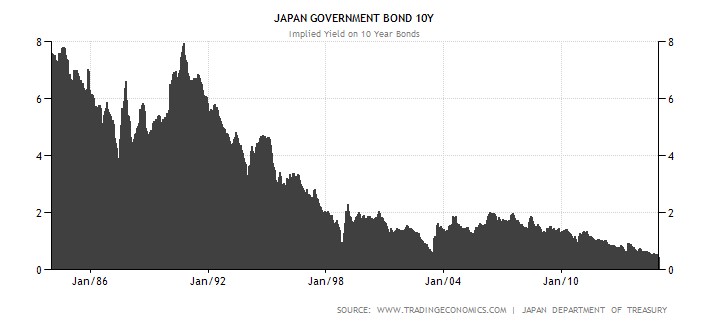
Source: TradingEconomics.com
There are plenty of reasons to explain the differences in the economic situation of the U.S. and Japan (see Japan Lost Decades), but despite the loose monetary policies of global central banks, history has proven that interest rates and inflation can remain stubbornly low for longer than expected.
The current pundit thinking has Federal Reserve Chairwoman Yellen leading the brigade towards a rate hike during mid-calendar 2015. Even if the forecasters finally get the interest rate right for once, the end-outcome is not going to be catastrophic for equity markets. One need look no further than 1994 when Federal Reserve Chairman Greenspan increased the benchmark federal funds rate by a hefty +2.5%. (see 1994 Bond Repeat?). Rather than widespread financial carnage in the equity markets, the S&P 500 finished roughly flat in 1994 and resumed the decade-long bull market run in the following year.
Currently 15 of the 17 Fed policy makers see 2015 median short-term rates settling at 1.125% from the current level of 0-0.25%. This hardly qualifies as interest rate Armageddon. With a highly transparent and dovish Janet Yellen at the helm, I feel perfectly comfortable the markets can digest the inevitable Fed rate hikes. Will (could) there be volatility around changes in Fed monetary policy during 2015? Certainly – no different than we experienced during the “taper tantrum” response to Chairman Ben Bernanke’s rate rise threats in 2013 (see Fed Fatigue).
As 2014 comes to an end, Santa has wrapped investor portfolios with a generous bow of returns in the fifth year of this historic bull market. Not everyone, however, has been on Santa’s “nice” list. Regrettably, many sideliners have received no presents because they incorrectly assessed the elimination impact of Quantitative Easing (QE). If you prefer presents over a lump of coal in your stocking, it will be in your best interest to ignore the Rate Hike Boogeyman and jump on Santa’s sleigh.

Wade W. Slome, CFA, CFP®
Plan. Invest. Prosper.
DISCLOSURE: Sidoxia Capital Management (SCM) and some of its clients own a range of positions, including certain exchange traded fund positions, but at the time of publishing SCM had no direct position in DB or any other security referenced in this article. No information accessed through the Investing Caffeine (IC) website constitutes investment, financial, legal, tax or other advice nor is to be relied on in making an investment or other decision. Please read disclosure language on IC Contact page.
Don’t Be a Fool, Follow the Stool

It’s the holiday season and with another year coming to an end, it’s also time for a wide range of religious celebrations to take place. Investing is a lot like religion too. Just like there are a countless number of religions, there are also a countless number of investing styles, whether you are talking about Value investing, Growth, Quantitative, Technical, Momentum, Merger-Arbitrage, GARP (Growth At a Reasonable Price), or a multitude of other derivative types. But regardless of the style followed, most professional managers believe their style is the sole answer to lead followers to financial nirvana. While I may not share the same view (I believe there are many ways to skin the stock market cat), each investing discipline (or religion) will have its own unique core tenets that drive expectations for future returns (outcomes).
As it relates to my firm, Sidoxia Capital Management, our investment process is premised on four key tenets. Much like the four legs of a stool, the following principles provide the foundation for our beliefs and outlook on the mid-to-long-term direction of the stock market:
- Profits
- Interest Rates
- Sentiment
- Valuations
Why are these the key components that drive stock market returns? Let’s dig a little deeper to clarify the importance of these factors:
Profits: Over the long-run there is a very significant correlation between stock prices and profits (see also It’s the Earnings, Stupid). I’m not the only one preaching this religious belief, investment legends Peter Lynch and William O’Neil think the same. In answer to a question by Dell Computer’s CEO Michael Dell about its stock price, Lynch famously responded , “If your earnings are higher in five years, your stock will be higher.” The same idea works with the overall stock market. As I recently wrote (see Why Buy at Record Highs? Ask the Fat Turkey), with corporate profits at all-time record highs, it should come as no surprise that stock prices are near all-time record highs. Regardless of the absolute level of profits, it’s also very important to have a feel for whether earnings are accelerating or decelerating, because investors will pay a different price based on this dynamic.
Interest Rates: When embarrassingly low CD interest rates of 0.08% are being offered on $10,000 deposits at Bank of America, do you think stocks look more or less attractive? It’s obviously a rhetorical question, because I can earn 20x more just by collecting the dividends from the S&P 500 index. Now in 1980 when the Federal Funds rate was set at 20.0% and investors could earn 16.0% on CDs, guess what? Stocks were logging their lowest valuation levels in decades (approximately 8x P/E ratio vs 17x today). The interest rate chart from Scott Grannis below highlights the near generational low interest rates we are currently experiencing.

Source: Calafia Beach Pundit
Sentiment: As I wrote in my Sentiment Indicators: Reading the Tea Leaves article, there are plenty of sentiment indicators (e.g., AAII Surveys, VIX Fear Gauge, Breadth Indicators, NYSE Bulls %, Put-Call Ratio, Volume), which traditionally are good contrarian indicators for the future direction of stock prices. When sentiment is too bullish (optimistic), it is often a good time to sell or trim, and when sentiment is too bearish (pessimistic), it is often good to buy. With that said, in addition to many of these short-term sentiment indicators, I realize that actions speak louder than words, therefore I like to also see the flows of funds into and out of stocks/bonds to gauge sentiment (see also Market Champagne Sits on Ice).
Valuations: As Fred Hickey, the lead editor of the High Tech Strategist noted, “Valuations do matter in the stock market, just as good pitching matters in baseball.” The most often quoted valuation metric is the Price/Earnings multiple or PE ratio. In other words, this ratio compares the price you would pay for an annual stream of profits. This can be tricky to determine because there are virtually an infinite number of factors that can impact the numerator and denominator. Currently P/E valuations are near historical averages (see below) – not nearly as cheap as 1980 and not nearly as expensive as 2000. If I only had one metric to choose, this would be a good place to start because the previous three legs of the stool feed into valuation calculations. In addition to P/E, at Sidoxia one of our other favorite metrics is Free-Cash-Flow Yield (annual cash generation after all expenses and expenditures divided by a company’s value). Earnings can be manipulated much easier than cold hard cash in our view.
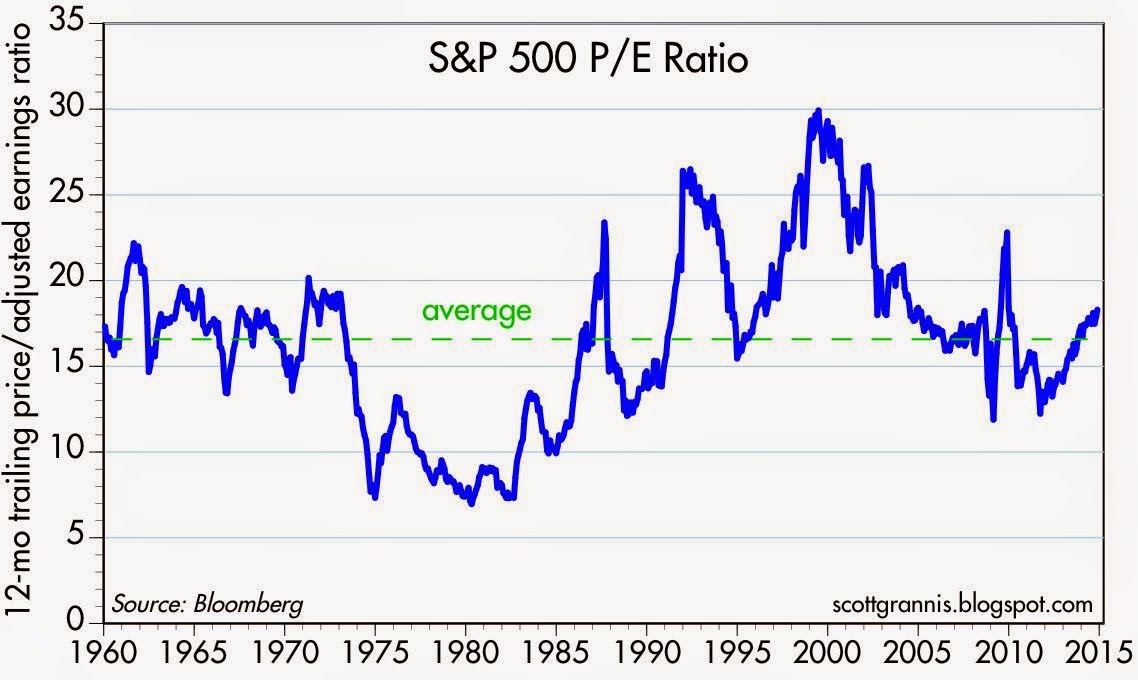
Source: Calafia Beach Pundit
Nobody, myself and Warren Buffett included, can consistently predict what the stock market will do in the short-run. Buffett freely admits it. However, investing is a game of probabilities, and if you use the four tenets of profits, interest rates, sentiment, and valuations to drive your long-term investing decisions, your chances for future financial success will increase dramatically. This framework is just as relevant today as it is when studying the 1929 Crash, the 1989 Japan Bubble, or the 2008-2009 Financial Crisis. If your goal is to not become an investing fool, I highly encourage you to follow the legs of the Sidoxia stool.
Wade W. Slome, CFA, CFP®
Plan. Invest. Prosper.
DISCLOSURE: Sidoxia Capital Management (SCM) and some of its clients own a range of positions, including BAC and certain exchange traded fund positions, but at the time of publishing SCM had no direct position in any other security referenced in this article. No information accessed through the Investing Caffeine (IC) website constitutes investment, financial, legal, tax or other advice nor is to be relied on in making an investment or other decision. Please read disclosure language on IC Contact page.
Where are the Economists’ Yachts?

“Where Are the Customers’ Yachts?” was a book first published about 75 years ago in 1940 by Fred Schwed, Jr. Before he became an author, Schwed was a professional trader who eventually left Wall Street after losing a significant amount of money during the 1929 stock market crash. The title of Schwed’s book refers to a story about a visitor to New York who admired the yachts of the bankers and brokers. Naively, the visitor asked where all the customers’ yachts were? Of course, none of the customers could afford yachts, even though they obediently followed the advice of their bankers and brokers.
The same principle applies to economists. The broad investing public, including many professionals, blindly hang on to every economist’s word. And why not? Often these renowned economists are quite articulate – they use big words, crafty jargon, and wear fancy clothes. Unfortunately in many (most) cases the predictions are way off base. What’s more, if these economists/strategists/analysts/etc. were so clairvoyant, then how come we do not find any of them on the Forbes 400 list or see them captaining massive yachts?
Recently, the Washington Post highlighted the spotty forecasting track record of the Federal Reserve, as it related to past projections of economic growth. As you can see from the chart below, the Board of Governors were consistently too optimistic about future economic growth prospects.
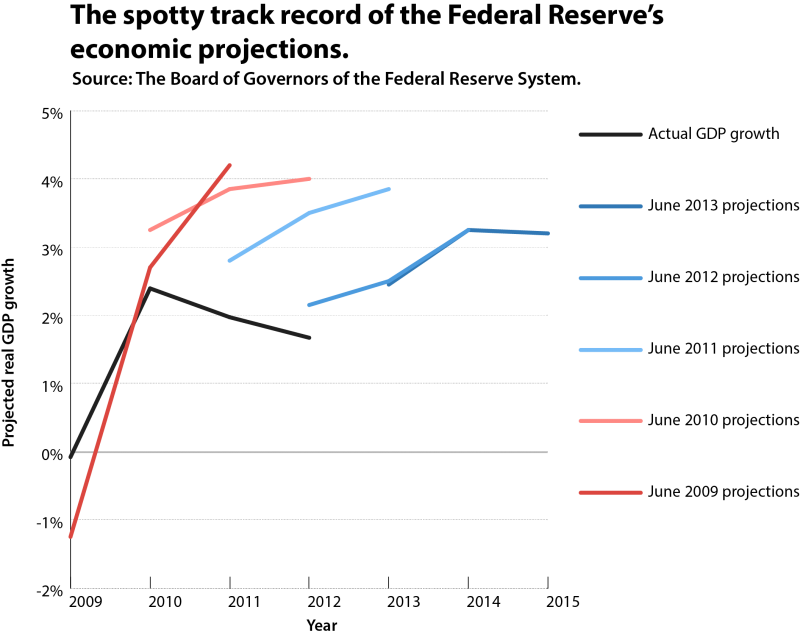
Source: Washington Post
The Federal Reserve has repeatedly proved it is no slouch when it comes to poor forecasting. The example I often point to is the infamous 1996 “irrational exuberance” speech (see also NASDAQ 5,000 Déjà Vu?) given by then Federal Reserve Chairman Alan Greenspan. In the talk, Greenspan warned of escalated asset values and cautioned about a potential decade-long malaise similar to the one experienced by Japan. At the time, the NASDAQ index stood at 1,300, but despite Greenspan screaming about an overvalued market, three years later, the tech-laden index almost quadrupled in value to 5,132.
There are plenty more errant economist forecasts to reference, but despite the economists’ poor batting averages, there is virtually no accountability of the pathetic predictions by the media outlets. Month after month, and year after year, I see the same buffoons on cable TV making the same faulty predictions with zero culpability.
While I have attempted to keep some of the economists/strategists honest (see The Fed Ate My Homework), credit must be given where credit is due. Barry Ritholtz, the lead Editor of The Big Picture, last year wrote a smart piece on the accountability (or lack therof) in the prediction industry.
In the article Ritholtz described some of the shenanigans going on in the loosely regulated prediction industry. Here’s part of what he had to say:
Pundits are highly incentivized to adhere to the following playbook:
- make a brash prediction
- if wrong, don’t worry…. no one will remember
- if right, selectively tout for self-promotion
- repeat cycle
Ritholtz also describes another time-tested strategy I love…The 40% Rule:
“The 40% rule is the perfect way to make a splashy headline and cover your butt at the same time. Forecast that there’s a 40% chance that the Dow Jones Industrial Average clears 12,000 by year end: If it does, you’ll look like a sage, and if it doesn’t, well, you didn’t say it’s the most likely outcome.”
Whatever your views are of predictions made by high profile economists and pundits, the media archives are littered with faulty forecasts. It is difficult to dispute that the projection game is a very tough business, and if you don’t share the same opinion, please explain to me…where are the all the economists’ yachts?
Click Here for Other Bad Predictions
Wade W. Slome, CFA, CFP®
Plan. Invest. Prosper.
DISCLOSURE: Sidoxia Capital Management (SCM) and some of its clients own a range of positions in certain exchange traded fund positions, but at the time of publishing SCM had no direct position in any other security referenced in this article. No information accessed through the Investing Caffeine (IC) website constitutes investment, financial, legal, tax or other advice nor is to be relied on in making an investment or other decision. Please read disclosure language on IC Contact page.
Why Buy at Record Highs? Ask the Fat Turkey

This article is an excerpt from a previously released Sidoxia Capital Management complementary newsletter (December 1, 2014). Subscribe on the right side of the page for the complete text.
I’ve fulfilled my American Thanksgiving duty by gorging myself on multiple helpings of turkey, mash potatoes, and pumpkin pie. Now that I have loosened my belt a few notches, I have had time to reflect on the generous servings of stock returns this year (S&P 500 index up +11.9%), on top of the whopping +104.6% gains from previous 5 years (2009-2013).
Conventional wisdom believes the Federal Reserve has artificially inflated the stock market. Given the perceived sky-high record stock prices, many investors are biting their nails in anticipation of an impending crash. The evidence behind the nagging investor skepticism can be found in the near-record low stock ownership statistics; dismal domestic equity fund purchases; and apathetic investor survey data (see Market Champagne Sits on Ice).
Turkey-lovers are in a great position to understand the predicted stock crash expected by many of the naysayers. As you can see from the chart below, the size of turkeys over the last 50+ years has reached a record weight – and therefore record prices per turkey:
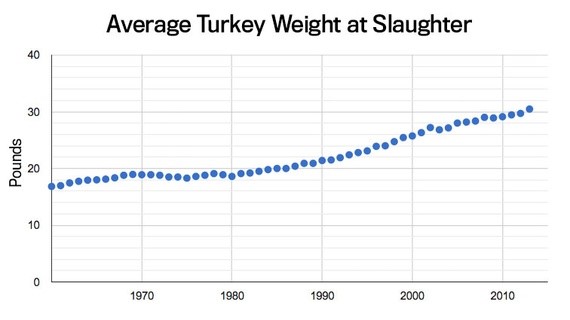
Source: The Atlantic
Does a record size in turkeys mean turkey meat prices are doomed for an imminent price collapse? Absolutely not. A key reason turkey prices have hit record levels is because Thanksgiving stomachs have been buying fatter and fatter turkeys every year. The same phenomenon is happening in the stock market. The reason stock prices have continued to move higher and higher is because profits have grown fatter and fatter every year (see chart below). Profits in corporate America have never been higher. CEOs are sitting on trillions of dollars of cash, and providing stock-investors with growing plump dividends (see also The Gift that Keeps on Giving), $100s of billions in shareholder friendly stock buybacks, while increasingly taking leftover profits to invest in growth initiatives (e.g., technology investments, international expansion, and job hiring).
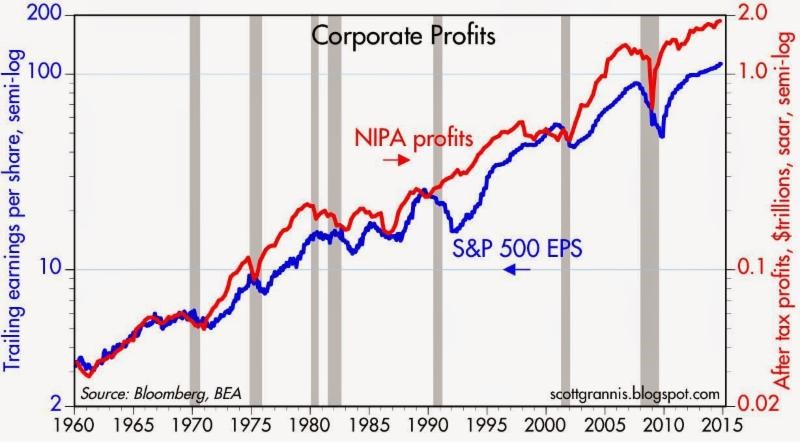
Source: Calafia Beach Pundit
Despite record turkey prices, I will make the bold prediction that hungry Americans will continue to buy turkey. More important than the overall price paid per turkey, the statistic that consumers should be paying more attention to is the turkey price paid per pound. Based on that more relevant metric, the data on turkey prices is less conclusive. In fact, turkey prices are estimated to be -13% cheaper this year on a per pound basis compared to last year ($1.58/lb vs. $1.82/lb).
The equivalent price per pound metric in the stock market is called the Price-Earnings (P/E) ratio, which is the price paid by a stock investor per $1 of profits (or earnings). Today that P/E ratio sits at approximately 17.5x. As you can see from the chart below, the current P/E ratio is reasonably near historical averages experienced over the last 50+ years. While, all else equal, anyone would prefer paying a lower price per pound (or price per $1 in earnings), any objective person looking at the current P/E ratio would have difficulty concluding recent stock prices are in “bubble” territory.
However, investor doubters who have missed the record bull run in stock market prices over the last five years (+210% since early 2009) have clung to a distorted, overpriced measurement called the CAPE or Shiller P/E ratio. Readers of my Investing Caffeine blog or newsletters know why this metric is misleading and inaccurate (see also Shiller CAPE Peaches Smell).
Don’t Be an Ostrich

While prices of stocks arguably remain reasonably priced for many Baby Boomers and retirees, the conclusion should not be to gorge 100% of investment portfolios into stocks. Quite the contrary. Everyone’s situation is unique, and every investor should customize a globally diversified portfolio beyond just stocks, including areas like fixed income, real estate, alternative investments, and commodities. But the exposures don’t stop there, because in order to truly have the diversified shock absorbers in your portfolio necessary for a bumpy long-term ride, investors need exposure to other areas. Such areas should include international and emerging market geographies; a diverse set of styles (e.g., Value, Growth, Blue Chip dividend-payers); and a healthy ownership across small, medium, and large equities. The same principles apply to your bond portfolio. Steps need to be taken to control credit risk and interest rate risk in a globally diversified fashion, while also providing adequate income (yield) in an environment of generationally low interest rates.
While I’ve spent a decent amount of time talking about eating fat turkeys, don’t let your investment portfolio become stuffed. The year-end time period is always a good time, after recovering from a food coma, to proactively review your investments. While most non-vegetarians love eating turkey, don’t be an investment ostrich with your head in the sand – now is the time to take actions into your own hands and make sure your investments are properly allocated.
Wade W. Slome, CFA, CFP®
Plan. Invest. Prosper.
DISCLOSURE: Sidoxia Capital Management (SCM) and some of its clients own a range of positions in certain exchange traded fund positions, but at the time of publishing SCM had no direct position in any other security referenced in this article. No information accessed through the Investing Caffeine (IC) website constitutes investment, financial, legal, tax or other advice nor is to be relied on in making an investment or other decision. Please read disclosure language on IC Contact page.


