Archive for November, 2014
Airbag Protection from Pundit Backseat Drivers

Giving advice to a driver from the backseat of a car is quite easy and enjoyable for some, but whether that individual is actually qualified to give advice is another subject. In the financial blogosphere and media there is an unending mass of backseat drivers recklessly directing investors off cliffs and into walls, but unfortunately there are no consequences for these blabbers. It’s the investors who are driving their personal portfolios that ultimately suffer from crashed financial dreams.
Unlike drivers who mandatorily require a license to drive to the local grocery store, bloggers, journalists, economists, analysts, strategists (aka “pundits”), and any other charismatic or articulate individual can emphatically counsel investors without any credentials, education, or licenses. More importantly than a piece of paper or letters on a business card, many of these self-proclaimed experts have little or no experience of investing real money…the exact topic the pundits are using to direct peoples’ precious and indispensable lifesavings.
It’s easy for bearish pundits like Peter Schiff, Nouriel Roubini, John Mauldin, and David Rosenberg (see also The Fed Ate My Homework) to throw economic hand grenades with their outlandishly gloomy predictions and fear mongering. However, more important than selling valuable advice, the pundit’s #1 priority is selling a convincing story, whether the story is grounded in reality or not. The pundit’s story is usually constructed by looking into the rearview mirror by creatively connecting current event dots in a way that may seem reasonable on the surface.
Crusty investors who have invested through various investment cycles know better than to pay attention to these opinions. As the saying goes, “Opinions are like ***holes. Everybody has one.” Stated differently, the great growth investor William O’Neil said the following:
“I would say 95% of all these people you hear on TV shows are giving you their personal opinion. And personal opinions are almost always worthless … facts and markets are far more reliable.”
Successful long-time investors like Warren Buffett rarely make predictions about the short-term directions of the market. Long-term investors know the only certainty in the market is uncertainty. At the core, investing is a game of probabilities. The objective of the game is to place your bets on those investments that establish the odds in your favor. As in many professions, however, the right process can have a negative outcome in the short-run. Those talented investors who have experience consistently applying a probabilistic approach generally do quite well in the long-run.
There is an endless multitude of investing advice, regardless of whether you choose to consume it over the TV, in newspapers, or through blogs. That’s why it’s so important to be discerning in your financial media consumption by focusing on experience…experience is the key. If you were to undergo a heart surgery, would you want a nurse or experienced doctor who had performed 2,000 successful heart surgeries? When you fly cross-country, do you want a flight attendant to fly the plane or a 20-year veteran pilot? I think you get the point.
The other factor to consider when comparing advice from a media pundit vs. experienced investor is skin in the game. Investment advisers who have their personal dollars at stake typically have spent a significantly larger amount of time formulating an investment thesis or strategy as compared to a loose-cannon TV journalist or inexperienced, maverick blogger.
There is a lot to consider as you maneuver your investment portfolio through volatile markets. With all the dangerous advice out there from backseat drivers, make sure you have experienced investment advice installed as protective airbags because listening to inexperienced air bags (pundits) could crash your portfolio into a wall.
Related Content: Financial Blogging Interview on Charlie Rose w/ Joe Weisenthal, Josh Brown, Felix Salmon, and Megan Murphy

Wade W. Slome, CFA, CFP®
Plan. Invest. Prosper.
DISCLOSURE: Sidoxia Capital Management (SCM) and some of its clients own a range of positions in certain exchange traded fund positions, but at the time of publishing SCM had no direct position in any other security referenced in this article. No information accessed through the Investing Caffeine (IC) website constitutes investment, financial, legal, tax or other advice nor is to be relied on in making an investment or other decision. Please read disclosure language on IC Contact page.
Fiscal Armageddon Greatly Exaggerated

Source: Photobucket
“The reports of my death are greatly exaggerated.”
-Mark Twain (after a relative’s illness was attributed to Twain)
The same can be said for the exaggerated death of the U.S. economy and stock market. Naysayers have been pounding a consistent stream of fatal economic theories for years as a positive set of broader metrics disassembled those arguments. Debt downgrades, debt defaults, and a domino of European country collapses were supposed to set our financial markets spiraling downwards out of control. That didn’t happen.
A large contributing component to our oversized debt burden was the massive federal, state, and local deficits. Consider the federal fiscal deficit that reached -$1.5 trillion during the 2008-09 Financial Crisis.
Many of the doom-and-gloomer pundits expected a deficit in the uber-trillion dollar range to last for as far as the eye could see, but perception didn’t turn out to be reality. Scott Grannis at Calafia Beach Pundit always does a superb job of summarizing this government related data (see chart below):
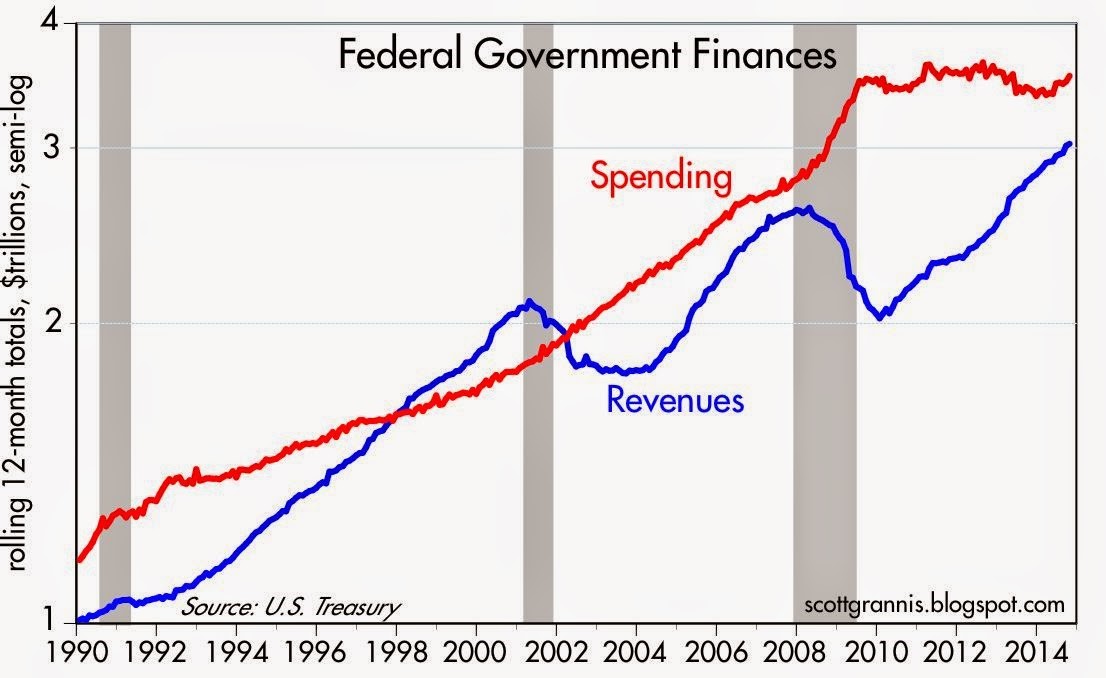
Source: Calafia Beach Pundit
All too often people confuse a secular trend vs. a cyclical move. The collapse in tax revenues during the 2008-2009 timeframe was not the result of some permanent shift in tax policy, but rather a function of a cyclical downturn, much like we have seen in prior recessions.
Extrapolating a short-term trend into a long-term trend is a common investor mistake (see Extrapolation Dangers). While the mean reversion in tax revenues came as a surprise to some, it was no bombshell for me. When the country axes 9 million private jobs and then both companies and consumers rein in spending due to depression fears, a subsequent reduction in tax receipts should not be a shock to market observers. On the flip side, it should then be no revelation that tax revenues will rise when 9 million+ jobs return and confidence rebounds.
We have talked about the shape of tax revenues/receipts, but what about the shape of spending? With all the gridlock occurring in Washington, Americans are fed up with the government’s inability to get anything done, which is evident by the near-record low approval rating of Congress. But as I have written before, not all the effects of gridlock are bad (see Who Said Gridlock is Bad?). What Grannis’s chart above shows is that gridlock has beneficially resulted in about five years of flat spending. Despite the spending stinginess, the slow and steady economic recovery has continued virtually unabated since 2009.
Looked at from a slightly different lens, you can see the deficit reached its worst point in 2009 at about -$1.5 trillion (-10% of GDP) – see chart below. Today, the deficit has almost been cut by 2/3rds to a level of -$0.5 billion (-2.8% of GDP). As you can see, the current deficit/GDP percentage is consistent with the average deficit levels experienced over the last 50 years.
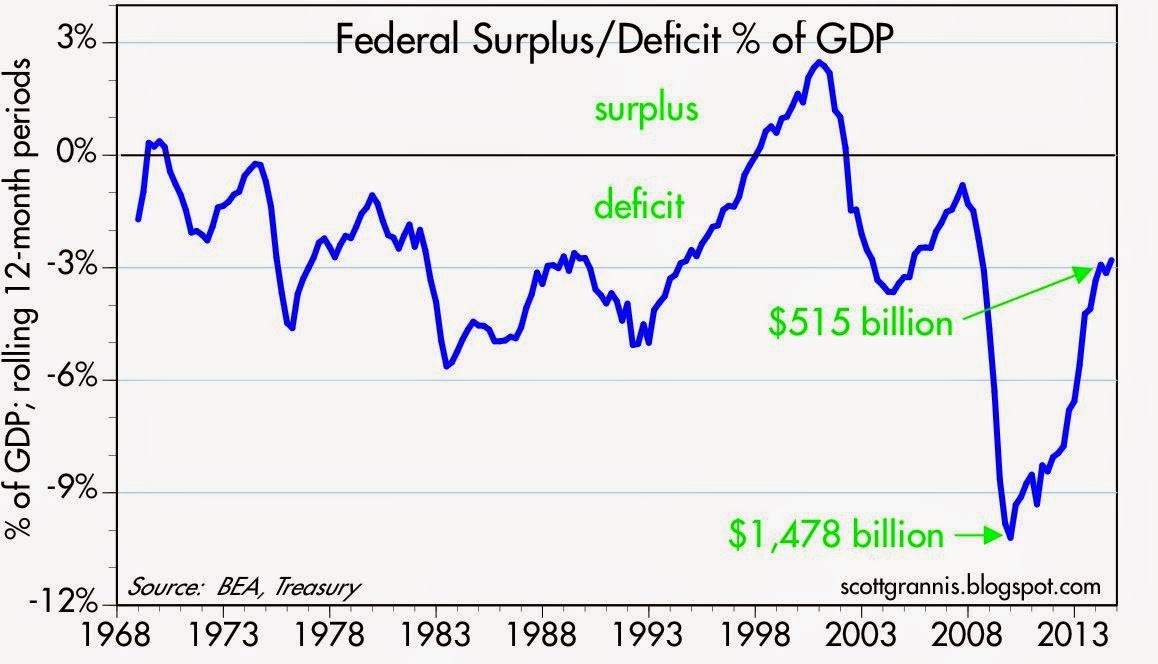
Source: Calafia Beach Pundit
Regardless of your political persuasion, investors are best served by not placing too much focus on what’s going on in Washington D.C. Equal blame and credit can be dispersed across Congress (Democrats & Republicans), the President, and the Federal Reserve. Exaggerating the death of the U.S. economy and stock market may sell more newspapers and advertising, but the resilience of capitalism and innovative spirit of American entrepreneurship has not and will not die.
Wade W. Slome, CFA, CFP®
Plan. Invest. Prosper.
DISCLOSURE: Sidoxia Capital Management (SCM) and some of its clients own a range of positions in certain exchange traded fund positions, but at the time of publishing SCM had no direct position in any other security referenced in this article. No information accessed through the Investing Caffeine (IC) website constitutes investment, financial, legal, tax or other advice nor is to be relied on in making an investment or other decision. Please read disclosure language on IC Contact page.
Sector Weightings: Another Financial Toolbox Gizmo

The ever-elusive $64,000 question of “Where does the stock market go from here?” is as popular a question today as it was a century ago. All you have to do is turn on CNBC to find an endless number of analysts, strategists, journalists, economists, and other talking heads guessing on the direction of stock prices. So many people are looking to make a quick buck or get a hot tip, but unfortunately investing is like dieting…it takes hard work and there are no simple solutions. As much as the pundits would like to make this investment game sound like a scientific certainty, in reality there is a lot of subjective art, experience, and luck that goes into successful investment outcomes. Consistent followers of Investing Caffeine understand there are a number of tools I use to guide me on the direction and level of stock prices, and three of my toolbox gizmos include the following:
- Earnings (Stock prices positively correlated)
- Interest Rates (Stock prices inversely correlated)
- Sentiment (Stock prices inversely correlated)
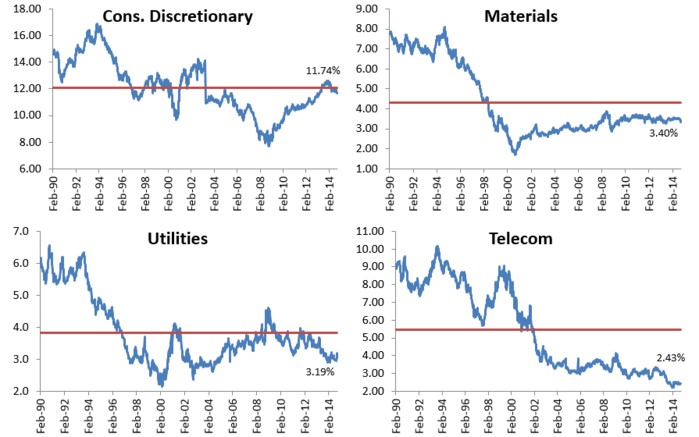
While these and other devices (see SHGR Holy Grail) are great for guesstimating the direction of longer-term stock prices, sector weightings are also great tools for identifying both overheated and unloved segments of the market. Take an extreme example, such as the S&P 500 Technology historical sector weighting in the year 2000. As you can see from the Bespoke Investment charts, the Technology sector went from about a 5% weighting of the overall market in the early 1990s to around 36% at the 2000 peak before dropping back down to 15% after the Tech Bubble burst. If you fast forward to the 2008-2009 Financial Crisis, we saw a similar “bubblicious” phenomenon rupture in the Financial sector. During 1980 the Financial segment accounted for approximately 5% of the total S&P 500 Index market capitalization in 1980 and skyrocketed to a peak of 23% in 2007, thanks in large part to a three decade bull-run in declining interest rates coupled with financial regulators asleep at the oversight switch.
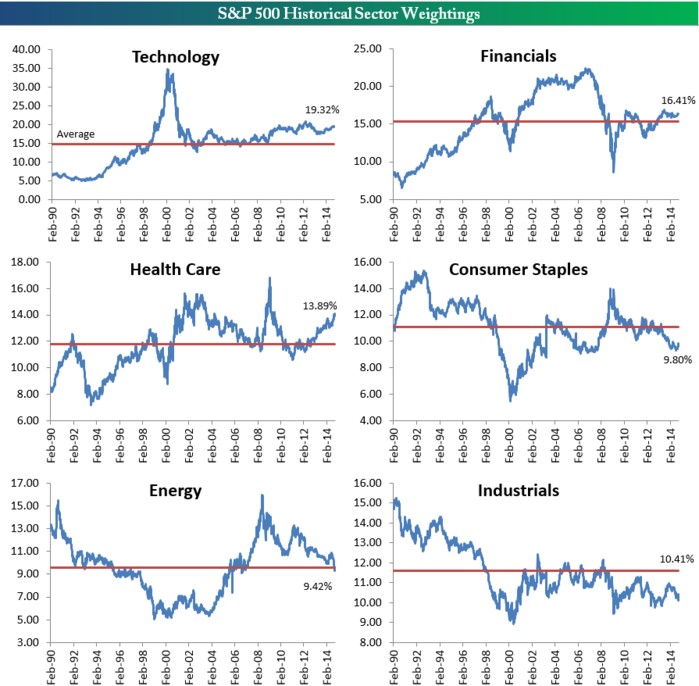
Source: Bespoke Investment
While some segment weightings are currently above and below historical averages, the chart shows there is a tendency for mean reversion to occur over time. As I’ve written in the past, while I believe the broader market can be objectively be interpreted as reasonably priced in light of record earnings, record low interest rates, and a broader skeptical investing public ( see Markets Soar and Investors Snore), I’m still finding expensive, frothy sub-sectors in areas like money losing biotech and social media companies. The reverse can be said if you examined the 2000 period – the overall stock market was overpriced at its 3/24/00 peak (P/E ratio of about ~31x), but within the S&P 500 stocks there were bargains of a lifetime if you looked outside the Tech sector. Consider many of the unloved “Old Economy” stocks that got left behind in the 1990s. Had you invested in these forgotten stocks at the peak of the 2000 market (March 24, 2000), you would have earned an equal-weighted average return of +430% (and significantly higher than that if you included dividends):
Caterpillar Inc (CAT): +416%
Deere & Co (DE): +367%
FedEx Corp (FDX): +341%
Ingersoll-Rand Co (IR): +260%
Lockheed Martin Corp (LMT): +811%
Three M Company (MMM): +254%
Schlumberger Ltd (SLB): +158%
Union Pacific Corp (UNP): +1,114%
Exxon Mobil Corp (XOM): +148%
Average +430%
That +430% compares to a much more modest +36% return for the S&P 500 over the same period. What this data underscores are the perils of pure index investing and highlights the room for active investment managers like Sidoxia Capital Management to generate alpha.
There are many ways of analyzing “Where does the stock market go from here?,” but whatever methods you use, the power of examining sector weightings and mean reversion gizmos should be readily accessible in your investment toolbox.
Wade W. Slome, CFA, CFP®
Plan. Invest. Prosper.
DISCLOSURE: Sidoxia Capital Management (SCM) and some of its clients own FDX; non-discretionary positions in DE, LMT, MMM, SLB, XOM, and a range of positions in certain exchange traded fund positions, but at the time of publishing SCM had no direct position in CAT, IR, UNP, or any other security referenced in this article. No information accessed through the Investing Caffeine (IC) website constitutes investment, financial, legal, tax or other advice nor is to be relied on in making an investment or other decision. Please read disclosure language on IC Contact page.
Ebola Trick Turns into October Treat

This article is an excerpt from a previously released Sidoxia Capital Management complementary newsletter (November 3, 2014). Subscribe on the right side of the page for the complete text.
Boo! The month of October is notorious for creating terrifyingly spooky volatility. Whether you are talking about 1929’s Great Crash, 1987’s Black Monday, or 2008’s Great Financial Crisis, the wickedest damage has occurred during this ghoulish month of the year. The financial market witches and goblins did not disappoint fear-hunting investors in 2014. Sparked by the spread of the deadly, West African Ebola virus and concerns over deteriorating European economic conditions, the Dow Jones Industrial Average stock index “tricked” investors into a -1,200 point (or roughly -8%) loss in the first two weeks of October. What initially felt like an empty Trick-or-Treat bucket turned into a candy-filled +10% advance in the subsequent two weeks of the month, ultimately resulting in an all-time record high reached by the Dow (17,380).
If you had taken a one-month nap, and slept through October, the late-month surge resulted in an impressive, but less thrilling, record monthly advance of +2.3% for the S&P 500 index. The Dow rose +2.0% and the Nasdaq Composite index added +3.1% for the month. For 2014, the S&P, Dow, and Nasdaq have earned sweet and sugary returns of up +9.2%, +4.9%, +10.9%, respectively.
The Ebola statistics are alarming, but the roughly 5,000 deaths in Africa should be put into proper perspective (see chart below). The number of deaths on American soil are even more miniscule, if you consider that there have been fewer Ebola deaths in the United States than Larry King has had wives (Larry has been married eight times to seven different women).
 |
| Source: Vox |
Besides concerns over Ebola, the eurozone boogeyman has spooked investors too. Europe has been in a continual economic funk, while the U.S. has decoupled and adapted to global sluggishness as seen from the industrial production statistics below (via Scott Grannis).
 |
| Source: Calafia Beach Pundit |
Fed Stimulus R.I.P.
A lot has been written and discussed about the Federal Reserve’s controversial QE (Quantitative Easing) bond buying stimulus program, but the fact remains stock prices are at record highs and the U.S. economy has been the best economic house in a bad developed country neighborhood. Contrary to popular opinion, long-term interest rates have not spiked higher with the wind-down of the nearly 6-year QE program. In actuality, interest rates have drifted lower with the 10-Year Treasury Note currently yielding 2.34%.
 |
| Source: Calafia Beach Pundit |
With the QE stimulus training wheels off the economic bicycle, the focus is returning to the real engine driving this 5-1/2 year bull market…corporate profits. Despite all the scary news headlines, S&P 500 corporate earnings continue to chug along as stock prices have tripled since early 2009. More specifically, 78% of companies who have reported their third quarter results thus far have exceeded Wall Street forecasts, which nets out to a respectable +7.3% earnings growth rate. As the 10-year chart below shows, stock prices (green line) generally follow corporate profit growth (blue line) – see also It’s the Earnings, Stupid. Eventually, profit growth flattens out and turns negative during a recession, which will lead to a bear market in stocks.
 |
| Source: FactSet |
Currently there is no evidence of a recessionary slowdown. Recessions usually occur when there is a correction in some area of economic excess (e.g., too much technology or housing investment) – that is not the case currently. In reality, the economy has added more than 10 million private jobs since the nadir of the 2009 recession and consumers are feeling more confident (see chart of 7-year high in Consumer Confidence). What’s more, the U.S. economy just posted a very respectable +3.5% GDP growth rate for the third quarter as an encore to the +4.6% growth achieved last quarter. The roughly -25% reduction in oil prices to $80 per barrel is also providing an effective tax cut for consumers, as money saved at the gas pump leaves more holiday shopping dollars to be poured back into the economy.
 |
| Source: Bespoke Investment |
Monkey See, Monkey Do
Central banks are not sitting on their hands either as they watch lethargic global growth. Other international central banks are enviously looking at the U.S.’s relative strength and beginning to play a game of “QE monkey see, monkey do.” Last Friday, Japan’s central bank (Bank of Japan) announced a plan to ratchet up their annual QE program of bond buying to 80 trillion Yen (~$726 billion), while Japan’s Government Pension Investment Fund (GPIF) simultaneously announced their proposal to double its stock ownership allocation. These decisions, coupled with the European Central Bank’s President Mario Draghi’s initiative to buy covered bonds is more evidence of global central bank coordination designed to kick-start more respectable economic growth. The hope is that circulating more money through the economy through QE will lead to more growth. If and when inflation rears its ugly head will be the time the central bank monkeys will have to reverse QE course.
 |
| Source: Yardeni Research |
While October and 2014 have created sweet tasting returns in the major stock indexes, volatility is certain to eventually come back and spook investors. The midterm elections are just around the corner and there are plenty of other geopolitical uncertainties around the world capable of frightening financial markets. There will continue to be plenty of surprising tricks, even though Halloween has passed, but patient investors with diversified, low-cost, tax-efficient strategies should be rewarded with long-term treats.
Wade W. Slome, CFA, CFP®
Plan. Invest. Prosper.
DISCLOSURE: Sidoxia Capital Management (SCM) and some of its clients hold positions in certain exchange traded funds (ETFs), but at the time of publishing SCM had no direct position in any other security referenced in this article. No information accessed through the Investing Caffeine (IC) website constitutes investment, financial, legal, tax or other advice nor is to be relied on in making an investment or other decision. Please read disclosure language on IC Contact page.


