Archive for June, 2014
Sports & Investing: Why Strong Earnings Can Hurt Stock Prices

With the World Cup in full swing and rabid fans rooting for their home teams, one may notice the many similarities between investing in stocks and handicapping in sports betting. For example, investors (bettors) have opposing views on whether a particular stock (team) will go up or down (win or lose), and determine if the valuation (point spread) is reflective of the proper equilibrium (supply & demand). And just like the stock market, virtually anybody off the street can place a sports bet – assuming one is of legal age and in a legal betting jurisdiction.
Soon investors will be poring over data as part of the critical, quarterly earnings ritual. With some unsteady GDP data as of late, all eyes will be focused on this earnings reporting season to reassure market observers the bull advance can maintain its momentum. However, even positive reports may lead to unexpected investor reactions.
So how and why can market prices go down on good news? There are many reasons that short-term price trends can diverge from short-run fundamentals. One major reason for the price-fundamental gap is this key factor: “expectations”. With such a large run-up in the equity markets (up approx. +195% from March 2009) come loftier expectations for both the economy and individual companies. For instance, just because corporate earnings unveiled from companies like Google (GOOG/GOOGL), J.P. Morgan (JPM), and Intel (INTC) exceed Wall Street analyst forecasts does not mean stock prices automatically go up. In many cases a stock price correction occurs due to a large group of investors who expected even stronger profit results (i.e., “good results, but not good enough”). In sports betting lingo, the sports team may have won the game this week, but they did not win by enough points (“cover the spread”).
Some other reasons stock prices move lower on good news:
- Market Direction: Regardless of the underlying trends, if the market is moving lower, in many instances the market dip can overwhelm any positive, stock- specific factors.
- Profit Taking: Many times investors holding a long position will have price targets or levels, if achieved, that will trigger selling whether positive elements are in place or not.
- Interest Rates: Certain valuation techniques (e.g. Discounted Cash Flow and Dividend Discount Model) integrate interest rates into the value calculation. Therefore, a climb in interest rates has the potential of lowering stock prices – even if the dynamics surrounding a particular security are excellent.
- Quality of Earnings: Sometimes producing winning results is not enough (see also Tricks of the Trade article). On occasion, items such as one-time gains, aggressive revenue recognition, and lower than average tax rates assist a company in getting over a profit hurdle. Investors value quality in addition to quantity.
- Outlook: Even if current period results may be strong, on some occasions a company’s outlook regarding future prospects may be worse than expected. A dark or worsening outlook can pressure security prices.
- Politics & Taxes: These factors may prove especially important to the market this year, since this is a mid-term election year. Political and tax policy changes today may have negative impacts on future profits, thereby impacting stock prices.
- Other Exogenous Items: Natural disasters and security attacks are examples of negative shocks that could damage price values, irrespective of fundamentals.
Certainly these previously mentioned issues do not cover the full gamut of explanations for temporary price-fundamental gaps. Moreover, many of these factors could be used in reverse to explain market price increases in the face of weaker than anticipated results.
If you’re traveling to Las Vegas to place a wager on the World Cup, betting on winning favorites like Germany and Argentina may not be enough. If expectations are not met and the hot team wins by less than the point spread, don’t be surprised to see a decline in the value of your bet.
Wade W. Slome, CFA, CFP®
Plan. Invest. Prosper.
DISCLOSURE: Sidoxia Capital Management (SCM) and some of its clients own certain exchange traded funds, GOOG, and GOOGL, but at the time of publishing had no direct positions in JPM and INTC. No information accessed through the Investing Caffeine (IC) website constitutes investment, financial, legal, tax or other advice nor is to be relied on in making an investment or other decision. Please read disclosure language on IC “Contact” page.
The Only Thing to Fear is the Unknown Itself

Martin Luther King, Jr. famously stated, “The only thing we have to fear is fear itself,” but when it comes to the stock market, the only thing to fear is the “unknown.” As much as people like to say, “I saw that crisis coming,” or “I knew the bubble was going to burst,” the reality is these assertions are often embellished, overstated, and/or misplaced.
How many people saw these events coming?
- 1987 – Black Monday
- Iraqi War
- Thai Baht Currency Crisis
- Long-Term Capital Management Collapse & Bailout
- 9/11 Terrorist Attack
- Lehman Brothers Bankruptcy / Bear Stearns Bailout
- Flash Crash
- U.S. Debt Downgrade
- Arab Spring
- Sequestration Cuts
- Cyprus Financial Crisis
- Federal Reserve (QE1, QE2, QE3, Operation Twist, etc.)
Sure, there will always be a prescient few who may actually get it right and profit from their crystal balls, but to assume you are smart enough to predict these events with any consistent accuracy is likely reckless. Even for the smartest and brightest minds, uncertainty and doubt surrounding such mega-events leads to inaction or paralysis. If profiting in advance of these negative outcomes was so easy, you probably would be basking in the sun on your personal private island…and not reading this article.
Coming to grips with the existence of a never-ending series of future negative financial shocks is the price of doing business in the stock market, if you want to become a successful long-term investor. The fact of the matter is with 7 billion people living on a planet orbiting the sun at 67,000 mph, the law of large numbers tells us there will be many unpredictable events caused either by pure chance or poor human decisions. As the great financial crisis of 2008-2009 proved, there will always be populations of stupid or ignorant people who will purposely or inadvertently cause significant damage to economies around the world.
Fortunately, the power of democracy (see Spreading the Seeds of Democracy) and the benefits of capitalism have dramatically increased the standards of living for hundreds of millions of people. Despite horrific outcomes and unthinkable atrocities perpetrated throughout history, global GDP and living standards continue to positively march forward and upward. For example, consider in my limited lifespan, I have seen the introduction of VCRs, microwave ovens, mobile phones, and the internet, while experiencing amazing milestones like the eradication of smallpox, the sequencing of the human genome, and landing space exploration vehicles on Mars, among many other unimaginable achievements.
Despite amazing advancements, many investors are paralyzed into inaction out of fear of a harmful outcome. If I received a penny for every negative prediction I read or heard about over my 20+ years of investing, I would be happily retired. The stock market is never immune from adverse events, but chances are a geopolitical war in Ukraine/Iraq; accelerated Federal Reserve rate tightening; China real estate bubble; Argentinian debt default; or other current, worrisome headline is unlikely to be the cause of the next -20%+ bear market. History shows us that fear of the unknown is more rational than the fear of the known. If you can’t come to grips with fear itself, I fear your long-term results will lead to a scary retirement.
Wade W. Slome, CFA, CFP®
Plan. Invest. Prosper.
DISCLOSURE: Sidoxia Capital Management (SCM) and some of its clients hold long positions in certain exchange traded funds, but at the time of publishing SCM had no direct position in any other security referenced in this article. No information accessed through the Investing Caffeine (IC) website constitutes investment, financial, legal, tax or other advice nor is to be relied on in making an investment or other decision. Please read disclosure language on IC Contact page.
Shiller CAPE Peaches Smell Like BS

If something sounds like BS, looks like BS, and smells like BS, there’s a good chance you’re probably eyeball-deep in BS. In the investment world, I encounter a lot of very intelligent analysis, but at the same time I also continually step into piles of investment BS. One of those piles of BS I repeatedly step into is the CAPE ratio (Cyclically Adjusted Price-to-Earnings) created by Robert Shiller. For those who are not familiar with Shiller, he is a Nobel Prize winner in economics who won the award in 2013 for his work on the “empirical analysis of asset prices.” Shiller vaulted into fame in large part due to the timing of his book, Irrational Exuberance, which was published during the 2000 technology market peak. He gained additional street-credibility in the mid-2000s when he spoke about the bubble developing in the real estate markets.
What is the CAPE?
Besides being a scapegoat for every bear that has missed the tripling of stock prices in the last five years, the CAPE effectively is a simple 10-year average of the P/E ratio for the S&P 500 index. The logic is simple, like many theories in finance and economics, there often are inherent mean-reverting principles that are accepted as rules-of-thumb. It follows that if the current 10-year CAPE is above the 134-year CAPE average, then stocks are expensive and you should avoid them. On the other hand, if the current CAPE were below the long-term CAPE average, then stocks are cheap and you should buy. Here is a chart of the Shiller CAPE:
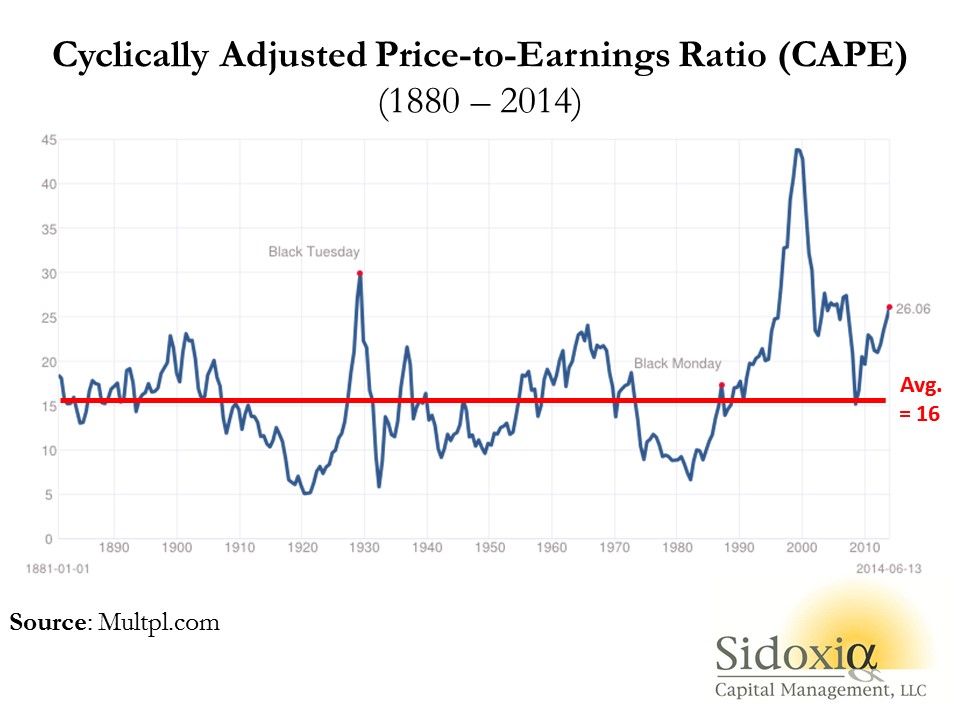
As you can see from the chart above, the current CAPE ratio of 26x is well above the 134-year average of 16x, which according to CAPE disciples makes the stock market very expensive. Or as a recent Business Insider article stated, the Shiller CAPE is “higher than at any point in the 20th century with the exception of the peaks of 1929 and 2000 – you know what happened after those.”
Problems Behind the Broken CAPE Tool
There are many problems with Shiller’s CAPE analysis, but let’s start with the basics by first asking, how useful has this tool actually been over the last, 10, 20, or 30 years? The short answer…not very. For example, if investors followed the implicit recommendation of the CAPE for the periods when Shiller’s model showed stocks as expensive (see above chart 1990 – 2014), they would have missed a more than quintupling (+469% ex-dividends) in the S&P 500 index. Over a shorter timeframe (2009 – 2014) the S&P 500 is up +114% ex-dividends (+190% since March 2009).
Even if you purchased at the worst time at the peak of the stock market in 2000 when the CAPE was 44 (S&P 500 – 1553), an investor would still have earned a total return of about +45% from 2000 – 2014, despite the CAPE still being 63% higher (more expensive) than the 134-year CAPE average of 16.
Peaches for $.25 Post-Bubble?
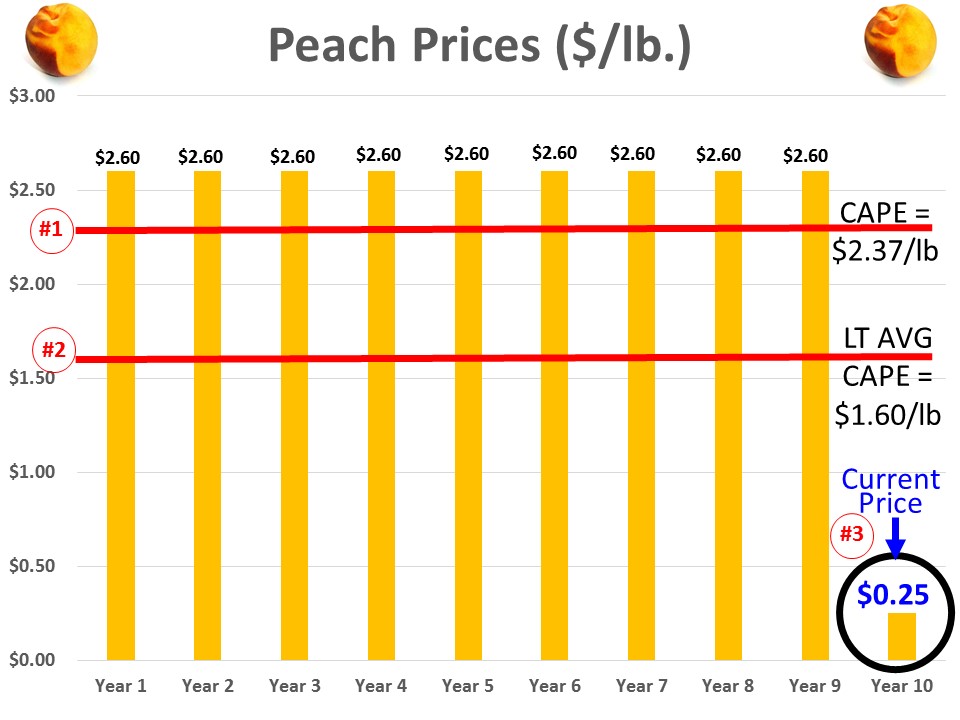
To illustrate a point, let’s assume you are a peach lover and due to a bubble in peach demand, prices spiked to an elevated level of $2.60 per pound for 9 years, but in year 10 the price plummeted to $.25 per pound today (see chart below). Assuming the 134-year average for peach prices was $1.60 per pound, would you still want to purchase your beloved peaches for the fire sale price of $.25 per pound? Common sense tells you $.25/lb. is a bargain, but if you asked the same question to Robert Shiller, he would say absolutely “NO”! The 10-year Peach CAPE ratio would be $2.37 ([9 yrs X $2.60] + [1 yr X $.25]) #1, but since the 10-year CAPE is greater than the LT-Average peach price of $1.60 per pound #2, Shiller would say peaches are too expensive, even though you could go to Kroger (KR) and buy a pound of peaches today for $0.25 #3.
This complete neglect of current market prices in the calculation of CAPE makes absolutely no sense, but this same dynamic of ignoring current pricing reality is happening today in the stock market. Effectively what’s occurring is the higher P/E ratios experienced over the last 10 years are distorting the Shiller CAPE ratio, thereby masking the true current value of stocks. In other words the current CAPE of 26x vastly exaggerates the pricey-ness of the actual S&P 500 P/E ratio of 16x for 2014 and 14x for 2015.
There are plenty of other holes to poke into CAPE, but the last major component of Shiller’s ratio I want to address is interest rates. Even if you disregard my previous negative arguments against Shiller’s CAPE, should anyone be surprised that the ratio troughed in the early 1980s of 7x when long-term interest rates peaked. If I could earn 18% on a CD with little risk in 1981, not many people should be dumbfounded that demand for risky stocks was paltry. Today, the reverse environment is in place – interest rates are near record lows. It should therefore come as no surprise, that all else equal, a higher P/E (and CAPE) is deserved when interest rates are this low. Nevertheless, this discussion of P/E and CAPE rarely integrates the critical factor of interest rates.
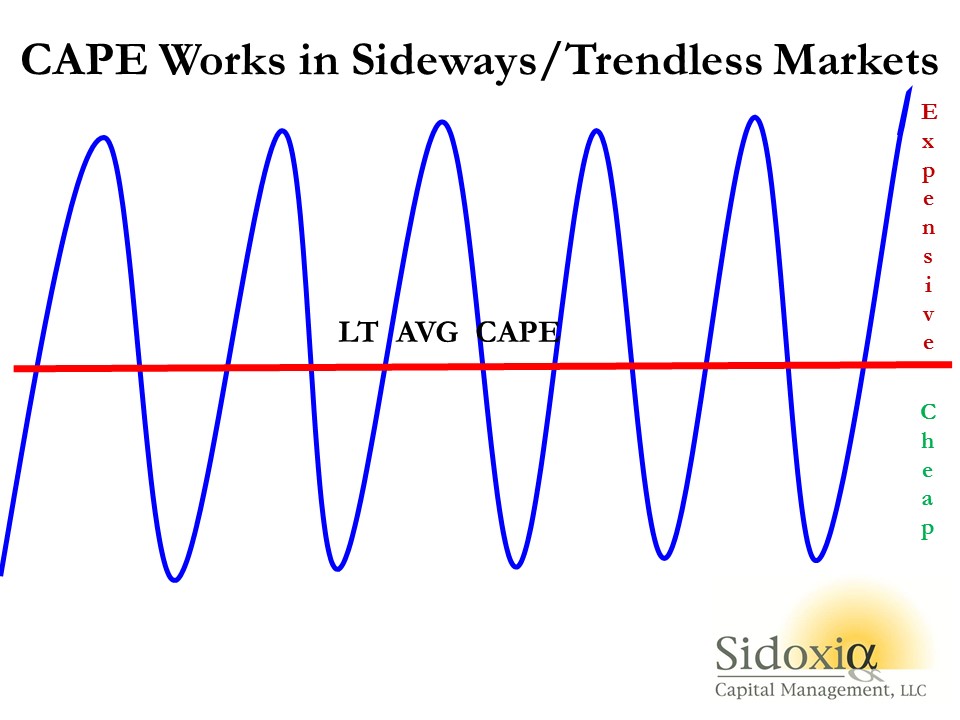
While I have spent a decent amount of time trashing the CAPE-BS ratio, I want to give my pal Bob Shiller a fair shake. I can do this by looking into a mirror and admitting there are periods when the CAPE ratio can actually work. Although the CAPE is effectively useless during long, multi-year upward and downward trending markets (think bubbles & depressions), the CAPE makes perfect sense in sideway, trendless markets (see chart below).
The investing public is always looking for a Holy Grail financial indicator that will magically guide them to riches in both up and down markets. Despite the popularity of Shiller’s CAPE ratio, regrettably no one perfect indicator exists. So before you jump on the bandwagon and chase the hot indicator du jour, make sure to look down and make sure you haven’t stepped in any Shiller CAPE-BS.
Wade W. Slome, CFA, CFP®
Plan. Invest. Prosper.
DISCLOSURE: Sidoxia Capital Management (SCM) and some of its clients hold long positions in certain exchange traded funds, but at the time of publishing SCM had no direct position in KR, or any other security referenced in this article. No information accessed through the Investing Caffeine (IC) website constitutes investment, financial, legal, tax or other advice nor is to be relied on in making an investment or other decision. Please read disclosure language on IC Contact page.
Get Out of Stocks!*

Get out of stocks!* Why the asterisk mark (*)? The short answer is there is a certain population of people who are looking at alluring record equity prices, but are better off not touching stocks – I like to call these individuals the “sideliners”. The sideliners are a group of investors who may have owned stocks during the 2006-2008 timeframe, but due to the subsequent recession, capitulated out of stocks into gold, cash, and/or bonds.
The risk for the sideliners getting back into stocks now is straightforward. Sideliners have a history of being too emotional (see Controlling the Investment Lizard Brain), which leads to disastrous financial decisions. So, even if stocks outperform in the coming months and years, the sideliners will most likely be slow in getting back in, and wrongfully knee-jerk sell at the hint of an accelerated taper, rate-hike, or geopolitical sneeze. Rather than chase a stock market at all-time record highs, the sideliners would be better served by clipping coupons, saving, and/or finish that bunker digging project.
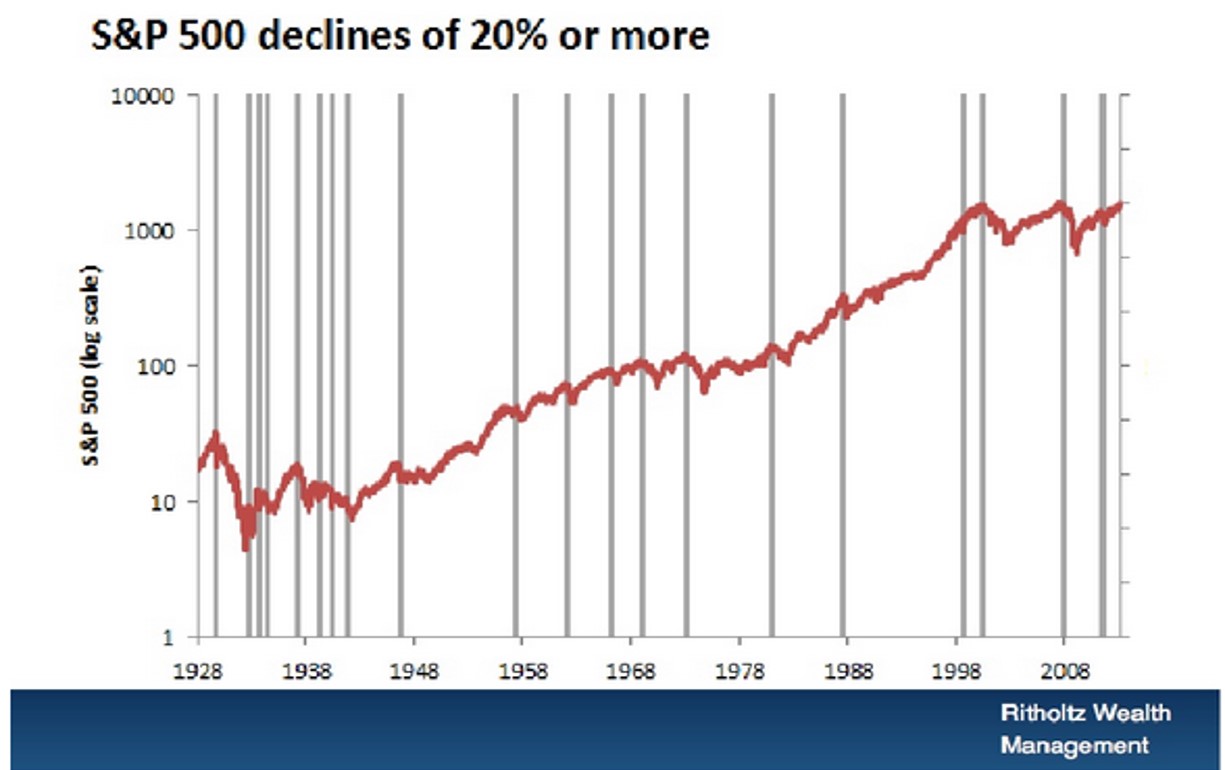
The fact is, if you can’t stomach a -20% decline in the stock market, you shouldn’t be investing in stocks. In a recent presentation, Barry Ritholtz, editor of The Big Picture and CIO of Ritholtz Wealth Management, beautifully displayed the 20 times over the last 85 years that the stocks have declined -20% or more (see chart below). This equates to a large decline every four or so years.
Strategist Dr. Ed Yardeni hammers home a similar point over a shorter duration (2008-2014) by also highlighting the inherent volatility of stocks (see chart below).
Stated differently, if you can’t handle the heat in the stock kitchen, it’s probably best to keep out.
It’s a Balancing Act
For the rest of us, the vast majority of investors, the question should not be whether to get out of stocks, it should revolve around what percentage of your portfolio allocation should remain in stocks. Despite record low yields and record high bond prices (see Bubblicious Bonds and Weak Competition, it is perfectly rational for a Baby-Boomer or retiree to periodically ring their stock-profit cash register, and reallocate more dollars toward bonds. Even if you forget about the 30%+ stock return achieved last year and the ~6% return this year, becoming more conservative in (or near) retirement with a larger bond allocation still makes sense. For some of our clients, buying and holding individual bonds until maturity reduces the risky outcome associated with a potential of interest rates spiking.
With all of that said, our current stance at Sidoxia doesn’t mean stocks don’t offer good value today (see Buy in May). For those readers who have followed Investing Caffeine for a while, they will understand I have been relatively sanguine about the prospects of equities for some time, even through a host of scary periods. Whether it was my attack of bears Peter Schiff, Nouriel Roubini, or John Mauldin in 2009-2010, or optimistic articles written during the summer crash of 2011 when the S&P 500 index declined -22% (see Stocks Get No Respect or Rubber Band Stretching), our positioning did not waver. However, as stock values have virtually tripled in value from the 2009 lows, more recently I have consistently stated the game has gotten a lot tougher with the low-hanging fruit having already been picked (earnings have recovered from the recession and P/E multiples have expanded). In other words, the trajectory of the last five years is unsustainable.
Fortunately for us, at Sidoxia we’re not hostage to the upward or downward direction of a narrow universe of large cap U.S. domestic stock market indices. We can scour the globe across geographies and capital structure. What does that mean? That means we are investing client assets (and my personal assets) into innovative companies covering various growth themes (robotics, alternative energy, mobile devices, nanotechnology, oil sands, electric cars, medical devices, e-commerce, 3-D printing, smart grid, obesity, globalization, and others) along with various other asset classes and capital structures, including real estate, MLPs, municipal bonds, commodities, emerging markets, high-yield, preferred securities, convertible bonds, private equity, floating rate bonds, and TIPs as well. Therefore, if various markets are imploding, we have the nimble ability to mitigate or avoid that volatility by identifying appropriate individual companies and alternative asset classes.
Irrespective of my shaky short-term forecasting abilities, I am confident people will continue to ask me my opinion about the direction of the stock market. My best advice remains to get out of stocks*…for the “sideliners”. However, the asterisk still signifies there are plenty of opportunities for attractive returns to be had for the rest of us investors, as long as you can stomach the inevitable volatility.
Wade W. Slome, CFA, CFP®
Plan. Invest. Prosper.
DISCLOSURE: Sidoxia Capital Management (SCM) and some of its clients hold long positions in certain exchange traded funds, but at the time of publishing SCM had no direct position in any other security referenced in this article. No information accessed through the Investing Caffeine (IC) website constitutes investment, financial, legal, tax or other advice nor is to be relied on in making an investment or other decision. Please read disclosure language on IC Contact page.
Stocks Winning vs. Weak Competitors

This article is an excerpt from a previously released Sidoxia Capital Management complementary newsletter (June 2, 2014). Subscribe on the right side of the page for the complete text.
Winning at any sport is lot easier if you can compete without an opponent. Imagine an NBA basketball MVP LeBron James driving to the basket against no defender, or versus a weakling opponent like a 44-year-old investment manager. Under these circumstances, it would be pretty easy for James and his team, the Miami Heat, to victoriously dominate without even a trace of sweat.
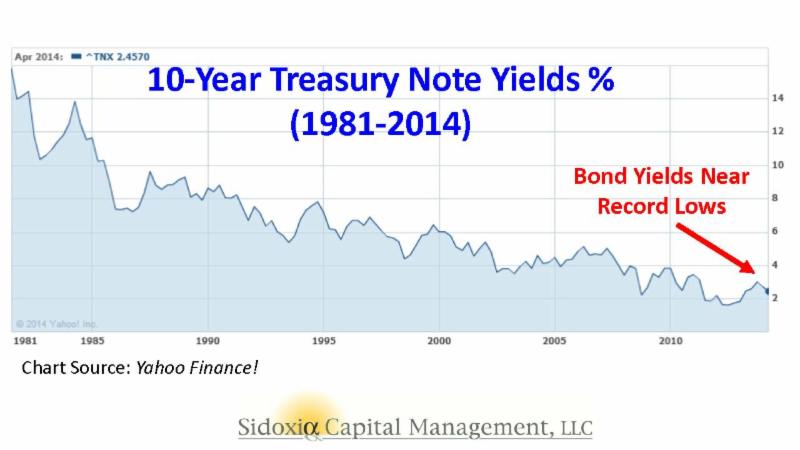
Effectively, stocks have enjoyed similar domination in recent years, while steamrolling over the bond competition. To put the stock market’s winning streak into perspective, the S&P 500 index set a new all-time record high in May, with the S&P 500 advancing +2.1% to 1924 for the month, bringing the 2013-2014 total return to about +38%. Not too shabby results over 17 months, if you consider bank deposits and CDs are paying a paltry 0.0-1.0% annually, and investors are gobbling up bonds yielding a measly 2.5% (see chart below).
The point, once again, is that even if you are a skeptic or bear on the outlook for stocks, the stock market still offers the most attractive opportunities relative to other asset classes and investment options, including bonds. It’s true, the low hanging fruit in stocks has been picked, and portfolios can become too equity-heavy, but even retirees should have some exposure to equities.
As I wrote last month in Buy in May and Dance Away, why would investors voluntarily lock in inadequate yields at generational lows when the earnings yield on stocks are so much more appealing. The approximate P/E (Price-Earnings) ratio for the S&P 500 currently averages approximately +6.2% with a rising dividend yield of about +1.8% – not much lower than many bonds. Over the last five years, those investors willing to part ways with yield-less cash have voted aggressively with their wallets. Those with confidence in the equity markets have benefited massively from the approximate +200% gains garnered from the March 2009 S&P 500 index lows.
For the many who have painfully missed the mother of all stock rallies, the fallback response has been, “Well, sure the market has tripled, but it’s only because of unprecedented printing of money at the QE (Quantitative Easing) printing presses!” This argument has become increasingly difficult to defend ever since the Federal Reserve announced the initiation of the reduction in bond buying (a.k.a., “tapering”) six months ago (December 18th). Over that time period, the Dow Jones Industrial Average has increased over 800 points and the S&P 500 index has risen a healthy 8.0%.
As much as everyone would like to blame (give credit to) the Fed for the bull market, the fact is the Federal Reserve doesn’t control the world’s interest rates. Sure, the Fed has an influence on global interest rates, but countries like Japan may have something to do with their own 0.57% 10-year government bond yield. For example, the economic/political policies and demographics in play might be impacting Japan’s stock market (Nikkei), which has plummeted about -62% over the last 25 years (about 39,000 to 15,000). Almost as shocking as the lowly rates in Japan and the U.S. and Japan, are the astonishingly low interest rates in Europe. As the chart below shows, France and Germany have sub-2% 10-year government bond yields (1.76% and 1.36%, respectively) and even economic basket case countries like Italy and Spain have seen their yields pierce below the 3% level.
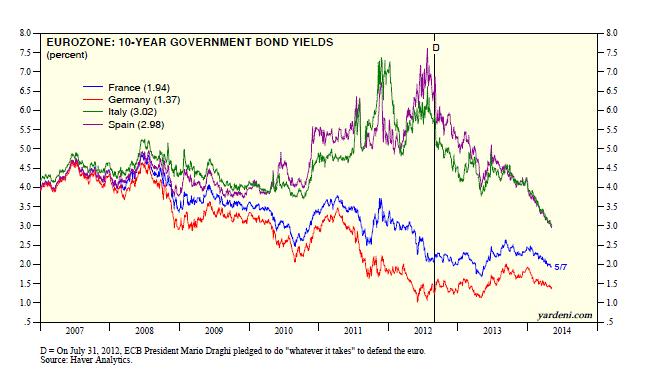 Source: Dr. Ed’s Blog
Suffice it to say, yield is not only difficult to find on our shores, but it is also challenging to find winning bond returns globally.
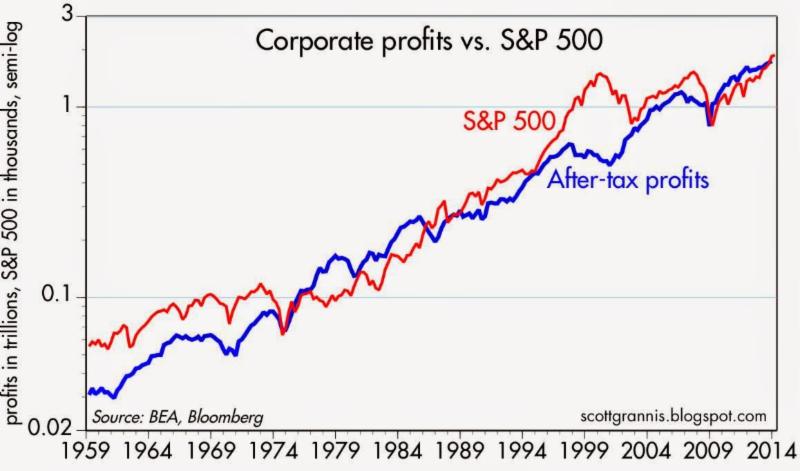
Well if low interest rates and the Federal Reserve aren’t the only reasons for a skyrocketing stock market, then how come this juggernaut performance has such long legs? The largest reason in my mind boils down to two words…record profits. Readers of mine know I follow the basic tenet that stock prices follow earnings over the long-term. Interest rates and Fed Policy will provide headwinds and tailwinds over different timeframes, but ultimately the almighty direction of profits determines long-run stock performance. You don’t have to be a brain surgeon or rocket scientist to appreciate this correlation. Scott Grannis (Calafia Beach Pundit) has beautifully documented this relationship in the chart below.
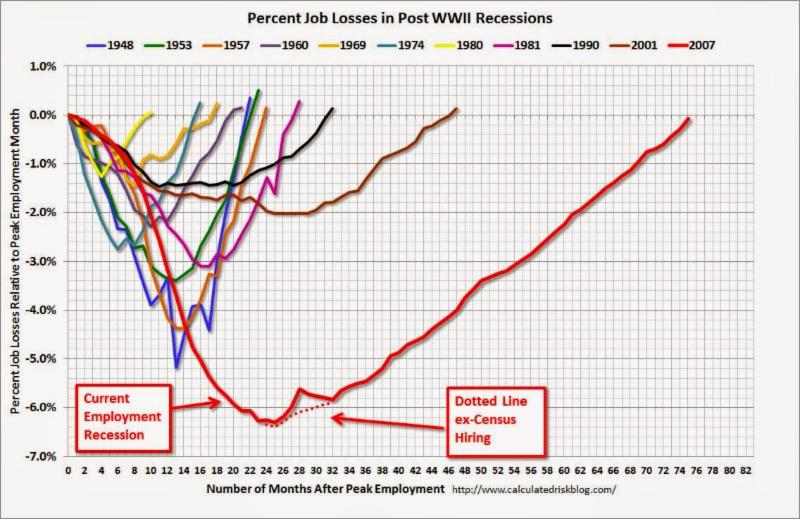
Supporting this concept, profits help support numerous value-enhancing shareholder activities we have seen on the rise over the last five years, which include rising dividends, share buybacks, and M&A (Mergers & Acquisitions) activity. Eventually the business cycle will run its course, and during the next recession, profits and stock prices will be expected to decline. A final contributing factor to the duration of this bull market is the abysmally slow pace of this economic recovery, which if measured in job creation terms has been the slowest since World War II. Said differently, the slower a recovery develops, the longer the recovery will last. Bill McBride at Calculated Risk captured this theme in the following chart:
Despite the massive gains and new records set, skeptics abound as evidenced by the nearly -$10 billion of withdrawn money out of U.S. stock funds over the last month (most recent data).
I’ve been labeled a perma-bull by some, but over my 20+ years of investing experience I understand the importance of defensive positioning along with the benefits of shorting expensive, leveraged stocks during bear markets, like the ones in 2000-2001 and 2008-2009. When will I reverse my views and become bearish (negative) on stocks? Here are a few factors I’m tracking:
- Inverted Yield Curve: This was a good precursor to the 2008-2009 crash, but there are no signs of this occurring yet.
- Overheated Fund Inflows: When everyone piles into stocks, I get nervous. In the last four weeks of domestic ICI fund flow data, we have seen the opposite…about -$9.5 billion outflows from stock funds.
- Peak Employment: When things can’t get much better is the time to become more worried. There is still plenty of room for improvement, especially if you consider the stunningly low employment participation rate.
- Fed Tightening / Rising Bond Yields: The Fed has made it clear, it will be a while before this will occur.
- When Housing Approaches Record Levels: Although Case-Shiller data has shown housing prices bouncing from the bottom, it’s clear that new home sales have stalled and have plenty of head room to go higher.
- Financial Crisis: Chances of experiencing another financial crisis of a generation is slim, but many people have fresh nightmares from the 2008-2009 financial crisis. It’s not every day that a 158 year-old institution (Lehman Brothers) or 85 year-old investment bank (Bear Stearns) disappear, but if the dominoes start falling again, then I guess it’s OK to become anxious again.
- Better Opportunities: The beauty about my practice at Sidoxia is that we can invest anywhere. So if we find more attractive opportunities in emerging market debt, convertible bonds, floating rate notes, private equity, or other asset classes, we have no allegiances and will sell stocks.
Every recession and bear market is different, and although the skies may be blue in the stock market now, clouds and gray skies are never too far away. Even with record prices, many fears remain, including the following:
- Ukraine: There is always geopolitical instability somewhere on the globe. In the past investors were worried about Egypt, Iran, and Syria, but for now, some uncertainty has been created around Ukraine.
- Weak GDP: Gross Domestic Product was revised lower to -1% during the first quarter, in large part due to an abnormally cold winter in many parts of the country. However, many economists are already talking about the possibility of a 3%+ rebound in the second quarter as weather improves.
- Low Volatility: The so-called “Fear Gauge” is near record low levels (VIX index), implying a reckless complacency among investors. While this is a measure I track, it is more confined to speculative traders compared to retail investors. In other words, my grandma isn’t buying put option insurance on the Nasdaq 100 index to protect her portfolio against the ramifications of the Thailand government military coup.
- Inflation/Deflation: Regardless of whether stocks are near a record top or bottom, financial media outlets in need of a topic can always fall back on the fear of inflation or deflation. Currently inflation remains in check. The Fed’s primary measure of inflation, the Core PCE, recently inched up +0.2% month-to-month, in line with forecasts.
- Fed Policy: When are investors not worried about the Federal Reserve’s next step? Like inflation, we’ll be hearing about this concern until we permanently enter our grave.
In the sport of stocks and investing, winning is never easy. However, with the global trend of declining interest rates and the scarcity of yields from bonds and other safe investments (cash/money market/CDs), it should come as no surprise to anyone that the winning streak in stocks is tied to the lack of competing investment alternatives. Based on the current dynamics in the market, if LeBron James is a stock, and I’m forced to guard him as a 10-year Treasury bond, I think I’ll just throw in the towel and go to Wall Street. At least that way my long-term portfolio has a chance of winning by placing a portion of my bets on stocks over bonds.
Wade W. Slome, CFA, CFP®
Plan. Invest. Prosper.
DISCLOSURE: Sidoxia Capital Management (SCM) and some of its clients hold positions in certain exchange traded funds (ETFs), but at the time of publishing SCM had no direct position in any other security referenced in this article. No information accessed through the Investing Caffeine (IC) website constitutes investment, financial, legal, tax or other advice nor is to be relied on in making an investment or other decision. Please read disclosure language on IC Contact page.


