Yield Starving Foreigners Go Muni Hunting

In the current cold, barren, negative interest rate environment, foreign investors are getting hungry and desperate as they hunt for yield. In the hopes of kick-starting economic activity around the globe, central bankers are taking the drastic measure of establishing negative interest rate policies. This unusual endeavor is pressing international investors to chase yield, no matter how small, wherever they can find it.
One of those areas in which foreigners are hunting for yield is the U.S. municipal bond market (see FT article). On the surface, this sounds ludicrous. Why would an outsider living in Germany or Japan invest in a U.S. municipal bond that yields a paltry rate that’s less than 1.7%, especially considering those investors will not benefit from the tax-free income advantages offered to Americans?
As strange as it sounds, Natalie Cohen, Wells Fargo’s head of municipal research correctly pointed out this pursuit for municipal bond yield across continents boils down to simple math. “Even if [foreign investors] are not subject to the US tax code, a plus two is better than a minus one,” Cohen notes.
Although foreign investment in the $3.7 trillion municipal bond market is relatively small, the rapidly rising appetite for munis is clearly evident, as shown in the chart below.
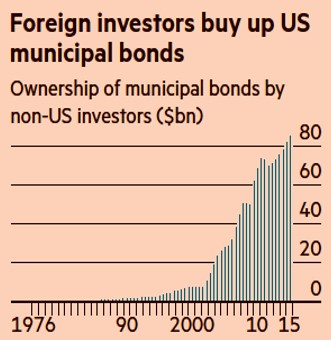
Source: The Financial Times
With our country’s crumbling roads and bridges, these ever-increasing piles of foreign cash pouring into our municipal bonds are helping fund a broad array of U.S. infrastructure projects. Given the election season is upon us, this issue may gain heightened attention. Both likely-presidential candidates are highlighting the need for infrastructure investment as part of their platforms, and the NIRP (negative interest rate policies) agenda of international central banks may make these municipal infrastructure dreams a reality.
We Americans are no stranger to the idea of borrowing money from foreigners. In fact, the Chinese own about $1.3 trillion of our Treasury bonds. This is all fine and dandy as long as the international appetite for lending us money remains healthy. If our city, state, and federal governments become too addicted to the Chinese, Europeans, and Japanese loans, financial risks can/will grow to unmanageable levels. Guess what happens once our borrowings swell to a level that forces foreigners to question our ability of repaying their debt? Interest rates will accelerate upwards, our interest payments will balloon, and our deficits will widen. The consequences of these unfavorable outcomes will be devastating budget cuts and/or tax increases.
For the time being, we will gladly accept the charitable donations of foreign investors to help lower funding costs for our sorely needed infrastructure projects. Fortunately, for now fiscal sanity is prevailing. The post financial crisis political environment has scared municipalities from borrowing too much, as explained here by the FT:
“For local and state politicians grappling with pension reforms, new healthcare programs and — in Alaska, Texas and Oklahoma — a drag on finances from lower energy prices, the looming presidential election is also diminishing the appeal of [municipal debt] issuance.”
In a near-zero/negative rate environment, there certainly will be incentives for irresponsible governments and corporations to extend themselves too far with cheap debt. However, in the short-run, as starving foreigners hunt for yield in the U.S. municipal bond market, Americans have the opportunity of exploiting this foreign generosity for the benefit our country’s long-term infrastructure.

Wade W. Slome, CFA, CFP®
Plan. Invest. Prosper.
DISCLOSURE: Sidoxia Capital Management (SCM) and some of its clients hold positions in certain exchange traded funds (ETFs), but at the time of publishing had no direct position in any other security referenced in this article. No information accessed through the Investing Caffeine (IC) website constitutes investment, financial, legal, tax or other advice nor is to be relied on in making an investment or other decision. Please read disclosure language on IC Contact page.
Flat Pancakes & Dividends

Over the last 18 months, stock prices have been flat as a pancake. Absent a few brief China and recessionary scares, the Dow Jones Industrial Average index has spent most of 2015 and 2016 trading between the relatively tight levels of 17,000 – 18,000. Record corporate profits and faster growth than other developed and developing markets have created a tug-of-war with countervailing factors. A strong dollar, reversal in monetary policy, geopolitical turmoil, and volatile commodity markets have produced a neutralizing struggle among corporate executives with deep financial pockets and short arms. In this environment, share buybacks, stable profit margins, and growing dividends have taken precedence over accelerated capital investments and expensive new-hires.
With flat stock prices and interest rates at unprecedented low levels, it’s during times like these that stock investors really appreciate the appetizing flavor of stable, growing dividends. To this day, I still find it almost impossible to fathom how investors are burning money by irrationally speculating in $7 trillion in negative interest rate bonds (see Retire at Age 90).
Historically there are very few periods in which stock dividend yields have exceeded bond yields (2.1% S&P yield vs. 1.8% 10-Year Treasury yield). As I showed in my Dividend Floodgates article, for roughly 50 years (1960 – 2010), the yield on the 10-Year Treasury Notes have exceeded the dividend yield on stocks (S&P 500) – that longstanding trend does not hold today.
In the face of the competitive stock market, several trends are contributing to the upward trajectory in dividend payments (see chart below).
#1.) Corporate profits (ex-Energy) are growing and at/near record levels. Earnings are critical in providing fertile ground for dividend growth.
#2.) Demographics, plain and simple. As 76 million Baby Boomers transition into retirement, their income needs escalate. These shareholders whine and complain to corporate executives to share the spoils and increase dividends.
#3.) Low interest rates and disinflation are shrinking the available pool of income generating assets. As I pointed out above, when trillions of dollars are getting thrown into negative yielding investments, many investors are flocking to alternative income-generating assets…like dividend paying stocks.
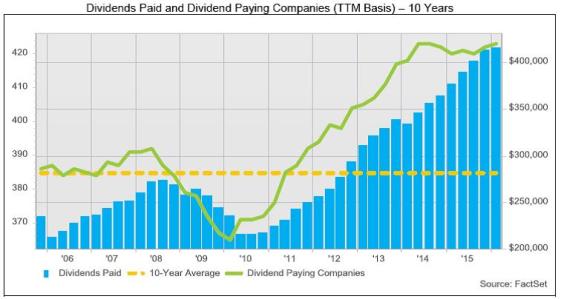
Source: FactSet
The Power of Dividends (Case Studies)
Most people don’t realize it, but over the last 100 years, dividends have accounted for approximately 40% of stocks’ total return as measured by the S&P 500. In other words, using history as a guide, if you initially invested in a stock XYZ at $100 that appreciated in value to $160 (+60%) 10 years later, that stock on average would have supplied an incremental $40 in dividends (40%) over that period, creating a total return of 100%.
Rather than using a hypothetical example, here are a few stock specific illustrations that highlight the amazing power of compounding dividend growth rates. Here are two “Dividend Aristocrats” (stocks that have increased dividends for at least 25 consecutive years):
- PepsiCo Inc (PEP): PepsiCo has increased its dividend for an astonishing 44 consecutive years. Today, the dividend yield is 2.9% based on the current share price. But had you purchased the stock in June 1972 for $1.60 per share (split-adjusted), you would currently be earning a +188% dividend yield ($3.01 dividend / $1.60 purchase price), which doesn’t even account for the +6,460% increase in the share price ($104.96 per share today from $1.60 in 1972). Over that 44 year period, the split-adjusted dividend has increased from about $0.02 per share to an annualized $3.01 dividend per share today, which equates to a mind-blowing +16,153% increase. On top of the $103 price appreciation, assuming a conservative 5% dividend reinvestment rate, my estimates show investors would have received more than $60 in reinvested dividends, making the total return that much more gargantuan.
- Emerson Electric Co (EMR): Emerson Electric too has had an even more incredible streak of dividend increases, which has now extended for 59 consecutive years. Emerson currently yields a respectable 3.6% rate, but if you purchased the stock in June 1972 for $3.73 per share (split-adjusted), you would currently be earning a +51% dividend yield ($1.92 dividend / $3.73 purchase price), which doesn’t even consider the +1,423% increase in the share price ($53.31 per share today from $3.73 in 1972).
There is never a shortage of FUD (Fear, Uncertainty, and Doubt), which has kept stock prices flat as a pancake over the last couple of years, but market leading franchise companies with stable/increasing dividends do not disappear during challenging times. Record profits (ex-energy), demographics, and a scarcity of income-generating investment alternatives are all contributing factors to the increased appetite for dividends. If you want to sweeten those flat pancakes, do yourself a favor and pour some quality dividend syrup over your investment portfolio.
Wade W. Slome, CFA, CFP®
Plan. Invest. Prosper.
DISCLOSURE: Sidoxia Capital Management (SCM) and some of its clients hold positions in certain exchange traded funds (ETFs) and PEP, but at the time of publishing had no direct position in EMR or any other security referenced in this article. No information accessed through the Investing Caffeine (IC) website constitutes investment, financial, legal, tax or other advice nor is to be relied on in making an investment or other decision. Please read disclosure language on IC Contact page.
Energizer Market… Keeps Going and Going

This article is an excerpt from a previously released Sidoxia Capital Management complimentary newsletter (May 2, 2016). Subscribe on the right side of the page for the complete text.
Boom, boom, boom…it keeps going…and going…and going…
You’ve seen the commercials: A device operating on inferior batteries dies just as a drum-beating, battery operated Energizer bunny comes speeding and spiraling across the television screen. Onlookers waiting for the battery operated toy to run out of juice, instead gaze in amazement as they watch the energized bunny keep going and going. The same phenomenon is occurring in the stock market, as many observers eagerly await for stock prices to die. The obituary of the stock market has been written many times over the last eight years (see Series of Unfortunate Events). Mark Twain summed up this sentiment well, when after a premature obituary was written about him, he quipped, “The reports of my death are greatly exaggerated.”
With fears abound, stocks added to their annual gains by finishing their third consecutive positive month with the S&P 500 indexes and Dow Jones Industrial Average advancing +0.5% and +0.3%, respectively. Skeptics and worry-warts have been concerned about stocks plummeting ever since the Financial Crisis of 2008-2009. We experienced a 100 year flood then, and as a consequence, scarred investors now expect the 100 year flood to repeat every 100 days (see also 100 Year Flood). Given the damage created in the wake of the “Great Recession,” many individuals have become afraid of their own shadow. The shadows currently scaring investors include the following:
- Negative Interest Rates: The unknown consequences of negative interest rate policies by central banks (see chart below).
- U.S. Monetary Policy: The potential continuation of the Federal Reserve hiking interest rates.
- Sluggish Economic Growth: With a GDP growth figure up only +0.5% during the first quarter many people are worried about the vulnerability of slipping into recession.
- Brexit Fears: Risk of Britain exiting the European Union (a.k.a. “Brexit”) will blanket the airwaves as the referendum approaches next month
For these reasons, and others, the U.S. central bank is likely to remain accommodative in its stance (i.e., Fed Chairwoman Janet Yellen is expected to be slow in hitting the economic brakes via interest rate hikes).
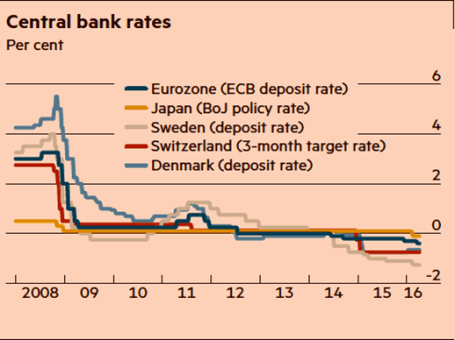
Source: Financial Times. Central banks continue with attempts to stimulate with zero/negative rates.
Climbing the Wall of Worry
Despite all these concerns, stock prices continue climbing the proverbial “wall of worry” while approaching record levels. As famed investor Sir John Templeton stated on multiple occasions, “Bull markets are born on pessimism, and they grow on skepticism, mature on optimism, and die on euphoria.” It’s obvious to me there currently is no euphoria in the overall market, if you consider investors have withdrawn $2 trillion in stock investments since 2007. The phenomenon of stocks moving higher in the face of bad news is nothing new. A recent study conducted by the Financial Times newspaper shows the current buoyant bull market entering the second longest advancing period since World War II (see chart below).
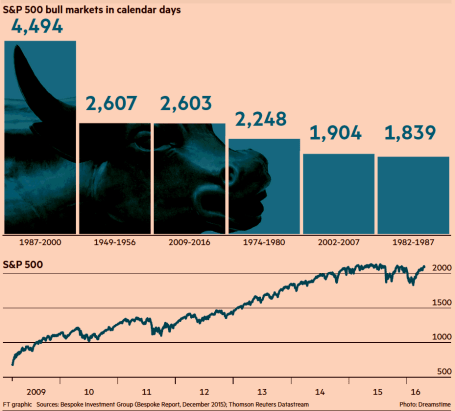
Source: Financial Times
There will never be a shortage of concerns or bad things occurring in a world of 7.4 billion people, but the Energizer bunny U.S. economy has proven resilient. Our economy is entering its seventh consecutive year of expansion, and as I recently pointed out the job market keeps plodding along in the right direction – unemployment claims are at a 43-year low (see Spring Has Sprung). Over the last few years, these job gains have come despite corporate profits being challenged by the headwinds of a stronger U.S. dollar (hurts our country’s exports) and tumbling energy profits. Fortunately, the negative factors of the dollar and oil prices have stabilized lately, and these dynamics are in the process of shifting into tailwinds for company earnings. The -5.7% year-to-date decline in the Dollar Index coupled with the recent rebound in oil prices are proof that the economic laws of supply-demand eventually respond to large currency and commodity swings. With the number of rigs drilling for oil down by approximately -80% over the last two years, it comes as no surprise to me that a drop in oil supply has steadied prices.
The volatility in oil prices has been amazing. Energy companies have been reeling as oil prices dropped -76% from a 2014-high of $108 per barrel to a 2016-low of $26 per barrel. Since then, the picture has improved significantly. Crude oil prices are now hovering around $46 per barrel, up +76%.
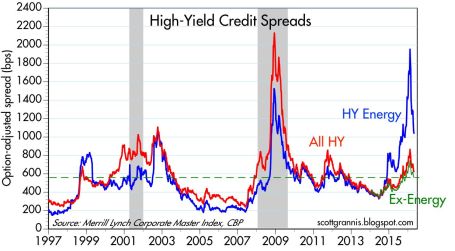
Energy Bankruptcy & Recessionary Fears Abate
If you take a look at the borrowing costs of high-yield companies in the chart below (Calafia Beach Pundit), you can see that prior spikes in the red line (all high-yield borrowing costs) were correlated with recessions – represented by the gray periods occurring in 2001 and 2008-09. During 2016, you can see from the soaring blue line, investors were factoring in a recession for high-yield energy companies (until the oil price recovery), but the non-energy companies (red-green lines) were not anticipating a recession for the other sectors of the economy. Bottom-line, this chart is telling you the knee-jerk panic of recessionary fears during the January-February period of this year has quickly abated, which helps explain the sharp rebound in stock prices.
After a jittery start to 2016 when economic expectations were for a dying halt, investors have watched stocks recharge their batteries in March and April. There are bound to be more fits and starts in the future, as there always are, but for the time being this Energizer bunny stock market and economy keeps going…and going…and going…
Wade W. Slome, CFA, CFP®
Plan. Invest. Prosper.
DISCLOSURE: Sidoxia Capital Management (SCM) and some of its clients hold positions in certain exchange traded funds (ETFs), but at the time of publishing had no direct position in any other security referenced in this article. No information accessed through the Investing Caffeine (IC) website constitutes investment, financial, legal, tax or other advice nor is to be relied on in making an investment or other decision. Please read disclosure language on IC Contact page.
Michael Jordan and Market Statistics

Basketball is in the air as the NBA playoffs are once again upon us. While growing up in high school, Michael Jordan was my basketball idol, and he dominated the sport globally at the highest level. I was a huge fanatic. Besides continually admiring my MJ poster-covered walls, I even customized my own limited edition Air Jordan basketball shoes by applying high school colors to them with model paint – I would not recommend this fashion experiment to others.
Eventually the laws of age, physics, and gravity took over, as Jordan slowly deteriorated physically into retirement. On an infinitesimally smaller level, I also experienced a similar effect during my 30s when playing in an old man’s recreational basketball league. Day-by-day, month-by-month, and year-by-year, I too got older and slower (tough to believe that’s possible) as I watched all the 20-somethings run circles around me – not to mention my playing time was slashed dramatically. Needless to say, I too was forced into retirement like Michael Jordan, but nobody retired my number, and I still have not been inducted into the Hall of Fame.

“Air Wade” Before Retirement: No Photoshop in 1988, just an optical illusion created by an 8-foot rim.
Financial markets are subject to similar laws of science (economics) too. The stock market and the economy get old and tired just like athletes, as evidenced by the cyclical nature of bear markets and recessions. Statistics are a beautiful thing when it comes to sports. Over the long run, numbers don’t lie about the performance of an athlete, just like statistics over the long run don’t lie about the financial markets. When points per game, shooting percentage, rebounds, assists, minutes played, and other measurements are all consistently moving south, then it’s safe to say fundamentals are weakening.
I’ve stated it many times in the past, and I’ll state it again, these are the most important factors to consider when contemplating the level and direction of the stock market (see also Don’t Be a Fool, Follow the Stool).
- Profits
- Interest Rates
- Valuations
- Sentiment
While the absolute levels of these indicators are important, the trend or direction of each factor is also very relevant. Let’s review these factors a little more closely.
- Profits: Profits and cash flows, generally speaking, are the lifeblood behind any investment and currently corporate profits are near record levels. When it comes to the S&P 500, the index is currently expected to generate a 2016 profit of $117.47. Considering a recent price closing of 2,092 on the index, this translates into a price-earnings ratio (P/E) of approximately 17.8x or a 5.6% earnings yield. This earnings yield can be compared to the 1.9% yield earned on the 10-Year Treasury Note, which is even lower than the 2.1% dividend yield on the S&P 500 (a rare historical occurrence). If history repeats itself, the 5.6% earnings yield on stocks should double to more than 10% over the next decade, however the yield on 10-year Treasuries stays flat at 1.9% over the next 10 years. The strong dollar and the implosion of the energy sector has put a lid on corporate profits over the last year, but emerging signs are beginning to show these trends reversing. Stabilizing profits near record levels should be a positive contributor to stocks, all else equal.
- Interest Rates: Pundits have been pointing to central banks as the sole reason for low/negative interest rates globally (see chart below). NEWS FLASH: Central banks have been increasing and decreasing interest rates for decades, but that hasn’t stopped the nearly unabated 36-year decline in interest rates and inflation (see chart below). As I described in previous articles (see Why 0% Rates?), technology, globalization, and the rise of emerging markets is having a much larger impact on interest rates/inflation than monetary policies. If central banks are so powerful, then why after eight years of loose global monetary policies hasn’t inflation accelerated yet? Regardless, all else equal, these historically low interest rates are horrible for savers, but wonderful for equity investors and borrowers.
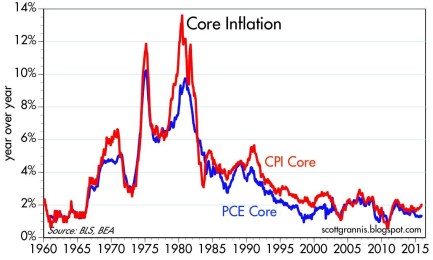
Source: Calafia Beach Pundit
- Valuations: The price you pay for an investment is one of the, if not the, most important factors to consider. I touched upon valuations earlier when discussing profits, and based on history, there is plenty of evidence to support the position that valuations are near historic averages. Shiller CAPE bears have been erroneously screaming bloody murder over the last seven years as prices have tripled (see Shiller CAPE smells like BS). A more balanced consideration of valuation takes into account the record low interest rates/inflation (see The Rule of 20).
- Sentiment: There are an endless number of indicators measuring investor optimism vs. pessimism. Generally, most experienced investors understand these statistics operate as valuable contrarian indicators. In other words, as Warren Buffett says, it is best to “buy fear, and sell greed.” While I like to track anecdotal indicators of sentiment like magazine covers, I am a firm believer that actions speak louder than words. If you consider the post-crisis panic of dollars flowing into low yielding bonds – greater than $1 trillion more than stocks (see Chicken vs. Beef ) you will understand the fear and skepticism remaining in investors minds. The time to flee stocks is when everyone falls in love with them.
Readers of Michael Lewis’s book Moneyball understand the importance statistics can play in winning sports. Michael Jordan may not have been a statistician like Billy Beane, because he spent his professional career setting statistical records, not analyzing them. Unfortunately, my basketball career never led me to the NBA or Hall of Fame, but I still hope to continue winning in the financial markets by objectively following the all-important factors of profits, interest rates, valuations, and sentiment.
Wade W. Slome, CFA, CFP®
Plan. Invest. Prosper.
DISCLOSURE: Sidoxia Capital Management (SCM) and some of its clients hold positions in certain exchange traded funds (ETFs), but at the time of publishing had no direct position in any security referenced in this article. No information accessed through the Investing Caffeine (IC) website constitutes investment, financial, legal, tax or other advice nor is to be relied on in making an investment or other decision. Please read disclosure language on IC Contact page.
Want to Retire at Age 90?

Do you love working 40-50+ hour weeks? Do you want to be a Wal-Mart (WMT) greeter after you get laid off from your longstanding corporate job? Do you love relying on underfunded government entitlements that you hope won’t be insolvent 10, 20, or 30 years from now? Are you banking on winning the lottery to fund your retirement? Do you enjoy eating cat food?
If you answered “Yes” to one or all of these questions, then do I have a sure-fire investment program for you that will make your dreams of retiring at age 90 a reality! Just follow these three simple rules:
- Buy Low Yielding, Long-Term Bonds: There are approximately $7 trillion in negative yielding government bonds outstanding (see chart below), which as you may understand means investors are paying to give someone else money – insanity. Bank of America recently completed a study showing about two-thirds of the $26 trillion government bond market was yielding less than 1%. Not only are investors opening themselves up to interest rate risk and credit risk, if they sell before maturity, but they are also susceptible to the evil forces of inflation, which will destroy the paltry yield. If you don’t like this strategy of investing near 0% securities, getting a match and gasoline to burn your money has about the same effect.
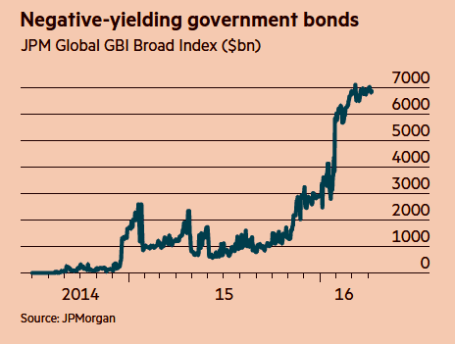
Source: Financial Times
- Speculate on the Timing of Future Fed Rate Hikes/Cuts: When the economy is improving, talking heads and so-called pundits try to guess the precise timing of the next rate hike. When the economy is deteriorating, aimless speculation swirls around the timing of interest rate cuts. Unfortunately, the smartest economists, strategists, and media mavens have no consistent predicting abilities. For example, in 1998 Nobel Prize winning economists Robert Merton and Myron Scholes toppled Long Term Capital Management. Similarly, in 1996 Federal Reserve Chairman Alan Greenspan noted the presence of “irrational exuberance” in the stock market when the NASDAQ was trading at 1,350. The tech bubble eventually burst, but not before the NASDAQ tripled to over 5,000. More recently, during 2005-2007, Fed Chairman Ben Bernanke whiffed on the housing bubble – he repeatedly denied the existence of a housing problem until it was too late. These examples, and many others show that if the smartest financial minds in the room (or planet) miserably fail at predicting the direction of financial markets, then you too should not attempt this speculative feat.
- Trade on Rumors, Headlines & Opinions: Wall Street analysts, proprietary software with squiggly lines, and your hot shot day-trader neighbor (see Thank You Volatility) all promise the Holy Grail of outsized financial returns, but regrettably there is no easy path to consistent, long-term outperformance. The recipe for success requires patience, discipline, and the emotional wherewithal to filter out the endless streams of financial noise. Continually chasing or reacting to opinions, headlines, or guaranteed software trading programs will only earn you taxes, transaction costs, bid-ask spread costs, impact costs, high frequency trading manipulation and underperformance.
Saving for your future is no easy task, but there are plenty of easy ways to destroy your savings. If you want to retire at age 90, just follow my three simple rules.

Wade W. Slome, CFA, CFP®
Plan. Invest. Prosper.
DISCLOSURE: Sidoxia Capital Management (SCM) and some of its clients hold positions in certain exchange traded funds (ETFs), but at the time of publishing had no direct position in WMT or any security referenced in this article. No information accessed through the Investing Caffeine (IC) website constitutes investment, financial, legal, tax or other advice nor is to be relied on in making an investment or other decision. Please read disclosure language on IC Contact page.
Avoiding Cigarette Butts

Too many investors hang their hat on investments that seem “cheap”. Unfortunately, too often something that looks like a bargain turns out to be a cigarette butt from which investors are hoping to take a last puff. As the old adage states, “you get what you pay for,” and that certainly applies to the world of investments. There are endless examples of cheap stocks getting cheaper, or in other words, stocks with low price/earnings ratios going lower. Stocks that appear cheap today, in many cases turn out to be expensive tomorrow because of deteriorating or collapsing profitability.
For instance, take Haliburton Company (HAL), an energy services company. Wall Street analysts are forecasting the Houston, Texas based oil services company to achieve 2016 EPS (earnings per share) of $0.32, down -79%. The share price currently stands at $37, so this translates into an eye-popping valuation of 128x P/E ratio, based on 2016 earnings estimates. What has effectively occurred in the HAL example is earnings have declined faster than the share price, which has caused the P/E to go higher. If you were to look at the energy sector overall, the same phenomenon is occurring with the P/E ratio standing at a whopping 97x (at the end of Q1).
These inflated P/E ratios are obviously not sustainable, so two scenarios are likely to occur:
- The price of the P/E (numerator) will decline faster than earnings (denominator)
- AND/OR
- The earnings of the P/E (denominator) will rise faster than the price (numerator)
Under either scenario, the current nose-bleed P/E ratio should moderate. Energy companies are doing their best to preserve profitability by cutting expenses as fast as possible, but when the product you are selling plummets about -70% in 18 months (from $100 per barrel to $30), producing profits can be challenging.
The Importance of Price (or Lack Thereof)
Similarly to the variables an investor would consider in purchasing an apartment building, “price” is supreme. With that said, “price” is not the only important variable. As famed investor Warren Buffett shrewdly notes, the quality of a company can be even more important than the price paid, especially if you are a long-term investor.
“It’s far better to buy a wonderful company at a fair price than a fair company at a wonderful price.”
The advantage of identifying and owning a “wonderful company” is the long-term stream of growing earnings. The trajectory of future earnings growth, more than current price, is the key driver of long-term stock performance.
Growth investor extraordinaire Peter Lynch summed it up well when he stated,
“People Concentrate too much on the P, but the E really makes the difference.”
Albert Einstein identified the power of “compounding” as the 8th Wonder of the World, which when applied to earnings growth of a stock can create phenomenal outperformance – if held long enough. Warren Buffett emphasized the point here:
“If you aren’t willing to own a stock for ten years, don’t even think about owning it for ten minutes. Put together a portfolio of companies whose aggregate earnings march upward over the years, and so also will the portfolio’s market value.”
Throw Away Cigarette Butts
I have acknowledged the importance of aforementioned price, but your investment portfolio will perform much better, if you throw away the cigarette butts and focus on identifying market leading franchise that can sustain earnings growth. The lower the growth potential, the more important price becomes in the investment question. (see also Magic Quadrant)
Here are the key factors in identifying wining stocks:
- Market Share Leaders: If you pay peanuts, you usually get monkeys. Paying a premium for the #1 or #2 player in an industry is usually the way to go. Certainly, there is plenty of money to be made by smaller innovative companies that disrupt an industry, so for these exceptions, focus should be placed on share gains – not absolute market share numbers.
- Proven Management Team: It’s nice to own a great horse (i.e., company), but you need a good jockey as well. There have been plenty of great companies that have been run into the ground by inept managers. Evaluating management’s financial track record along with a history of their strategic decisions will give you an idea what you’re working with. Performance doesn’t happen in a vacuum, so results should be judged relative to the industry and their competitors. There are plenty of incredible managers in the energy sector, even if the falling tide is sinking all ships.
- Large and/or Growing Markets: Spotting great companies in niche markets may be a fun hobby, but with limited potential for growth, playing in small market sandboxes can be hazardous for your investment health. On the other hand, priority #1, #2, and #3 should be finding market leaders in growth markets or locating disruptive share gainers in large markets. Finding fertile ground on long runways of growth is how investors benefit from the power of compound earnings.
- Capital Allocation Prowess: Learning the capital allocation skillset can be demanding for executives who climb the corporate ladder from areas like marketing, operations, or engineering. Regrettably, these experiences don’t prepare them for the ultimate responsibility of distributing millions/billions of dollars. In the current low/negative interest rate environment, allocating capital to the highest return areas is more imperative than ever. Cash sitting on the balance sheet earning 0% and losing value to inflation is pure financial destruction. Conservatism is prudent, however, excessive piles of cash and overpaying for acquisitions are big red flags. Managers with a track record of organically investing in their businesses by creating moats for long-term competitive advantage are the leaders we invest in.
Many so-called “value” investors solely use price as a crutch. Anyone can print out a list of cheap stocks based on Price-to-Earnings, Enterprise Value/EBITDA, or Price/Cash Flow, but much of the heavy lifting occurs in determining the future trajectory of earnings and cash flows. Taking that last puff from that cheap, value stock cigarette butt may seem temporarily satisfying, but investing into too many value traps may lead you gasping for air and force you to change your stock analysis habits.
Wade W. Slome, CFA, CFP®
Plan. Invest. Prosper.
DISCLOSURE: Sidoxia Capital Management (SCM) and some of its clients hold positions in certain exchange traded funds (ETFs), but at the time of publishing had no direct position in HAL or any security referenced in this article. No information accessed through the Investing Caffeine (IC) website constitutes investment, financial, legal, tax or other advice nor is to be relied on in making an investment or other decision. Please read disclosure language on IC Contact page.
Spring Has Sprung: Market Weather Turning

This article is an excerpt from a previously released Sidoxia Capital Management complimentary newsletter (April 1, 2016). Subscribe on the right side of the page for the complete text.
It was a cold winter for stocks, but as we approached the spring season in March, the flowers have begun to bloom. More specifically, during the month of March, the Dow Jones Industrial index catapulted +7.1% and the S&P 500 index jumped +6.6%. While this roughly +80% annualized rate is unlikely to sustain itself, this flurry of strong performance could be the sign of warmer weather conditions in the economic forecast.
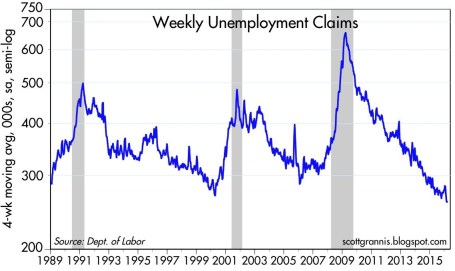
What started out as a cold and blustery January, with stocks posting one of the worst beginning months in history (S&P 500 down -5.1%), quickly thawed out in February and March. Fears over deteriorating economic conditions in the U.S., China along with plummeting oil prices proved fleeting. In fact, as Scott Grannis at Calafia Beach Pundit pointed out, there is no sign of recession in the U.S. as evidenced by a 43-year low in unemployment claims and a 4.9% unemployment rate (see chart below).
As I’ve stated for many years, focusing on the never-ending hurricane of pessimistic headlines is a wasteful use of time and destructive force on performance, if acted upon. Offsetting the downpour of negative news stories are the record low interest rates (now incomprehensibly negative in parts of the globe), which serve as a protective umbrella against the short-term stormy volatility. When investors face the soggy reality of earning a near-0% return on their bank savings and a sub-2% Treasury bond market for 10-year maturities, suddenly a 6-7% earnings yield on stocks certainly looks pretty sunny. There have been very few times in history when dividends earned on stocks have exceeded the payments received on a 10 year Treasury bond, but that is exactly the extreme environment we are living in today. No doubt, if the interest rate climate changes, and rates spike higher, stocks will face a more thunderous environment.
However, fortunately for stock market investors (and unfortunately for savers), this week Federal Reserve Chair Janet Yellen reiterated her forceful view of maintaining interest rates at a low, stimulative level for an extended period of time.
If It Bleeds It Leads – At the Expense of Your Portfolio
Even in the face of European terrorist attacks in Brussels and a turbulent (but entertaining) political presidential election season, the four pillars of earnings, interest rates, valuations, and sentiment are still protecting stock investors from an economic flood (see also Don’t Be a Fool, Follow the Stool). Scary news headlines may sell newspapers and attract advertising dollars, but the real money is made by following the four investing pillars.
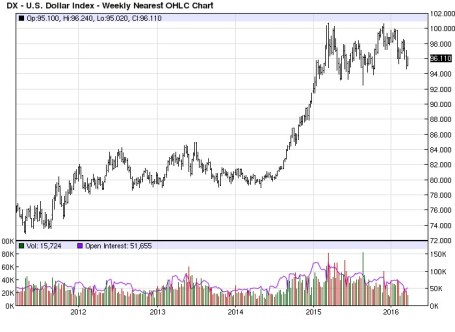
Also contributing to a clearer outlook this spring is the steadying value of the U.S. dollar and stabilizing trend realized in oil prices.
For most of 2015, multinational corporations saw their profits squeezed due to a 20-25% spike in the dollar. For example, an auto manufacturer selling a car for $20,000 in the U.S. could suddenly see the price of the same car changed to $25,000 in Europe. Meanwhile, a different German competitor could price a similar car manufactured in their country at the lower $20,000. This all translates into diminished sales and profits for American companies. Mercifully, we are beginning to see these currency headwinds abate, and even begin to shift into a slight tailwind (see 5-year chart below).
Source: barchart.com
From copper and corn to silver and soy beans, commodity prices have been in a downward death spiral over the last five years. And crude oil hasn’t escaped the commodity collapse either…until recently. The supply glut, created by factors like the U.S. shale revolution and new added Iranian post-sanction reserves, led to price declines from a 2009 high of $147 per barrel to a 2016 low of $26. With China and U.S. dollar fears abating, oil prices have bounced about +45% from the 2016 lows to about $38 per barrel.
While the weather has been improving on our shores, not everyone appreciates the fact the U.S. has been the “best house in a bad global neighborhood.” As the chart below shows (February 2016), international stock markets have gone into a bear market (down > -20%) since the 2011 and 2014 peaks, while the U.S. has performed about 100% better. Even in the U.S. market, small-midcap stocks (small & midsize companies) fell about -22% from their 2015 peak before recouping much of the losses.
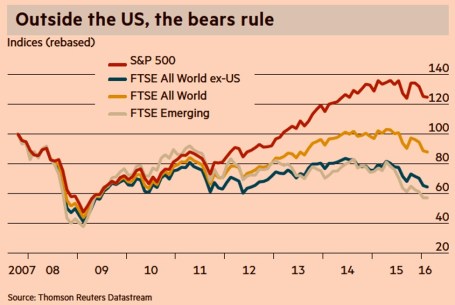
Source: Financial Times
Whether large companies, as measured by the S&P 500 index, which fell about -15% from the peak, suffer a true, technical -20% “bear market” or continue the current seven-year bull market is debatable. Regardless, what we do know is investors survived another cold winter and spring has produced a weather forecast that is currently predicting warmer weather and sunnier economic skies.
Wade W. Slome, CFA, CFP®
Plan. Invest. Prosper.
DISCLOSURE: Sidoxia Capital Management (SCM) and some of its clients hold positions in certain exchange traded funds (ETFs), but at the time of publishing had no direct position in any security referenced in this article. No information accessed through the Investing Caffeine (IC) website constitutes investment, financial, legal, tax or other advice nor is to be relied on in making an investment or other decision. Please read disclosure language on IC Contact page.
Chasing Headlines

It’s been an amazing start to the year. First the market cratered on slowing China economic concerns, domestic recessionary fears, deteriorating oil prices, and negative interest rates abroad. In response to all these worries (and others), stocks dove more than -11% (S&P 500 Index) in January, before settling down. Subsequently, the market has made a screaming recovery, in part due to dovish monetary policy comments (i.e., reduction in forecasted interest rate hikes) and diminished anxiety over a potential global collapse. Month-to-date stocks are up an impressive +5.4%, and year-to-date equities are flattish, or down less than -1%.
With an endless amount of information flowing across our smart phones and computers, it becomes quite easy and tempting to chase news headlines, just like a hyper dog chasing a car. But even once an investor catches up (or reacts) to a headline, there’s confusion around how to profit from the fleeting information. First of all, every plugged-in hedge fund and institutional investor has likely already traded on the stale information you received. Second of all, rarely is the data relevant to the long-term cash generating capabilities of the company or economy. And lastly, the news is more often than not, instantly factored into the stock price. Chasing news headlines only eaves individual investors holding the bag of performance-shattering transactions costs, taxes, and worn-out pricing.
The heightened volatility in late 2015 and early 2016 hasn’t however prevented investors and so-called pundits from attempting to time the market. Any battle-tested investment veteran knows it’s virtually impossible to consistently time the market (see also Market Timing Treadmill), but this fact hasn’t prevented speculators from attempting the feat nonetheless. Famed investment guru, Peter Lynch, who earned an average +29% annual return from 1977-1990, summed it up well when he stated the following:
“Far more money has been lost by investors preparing for corrections, or trying to anticipate corrections, than has been lost in corrections themselves.”
The Important Factors
As I’ve written many times in the past, the keys to long-term stock performance are not knee-jerk reactions to headlines, but rather these following crucial factors (see also Don’t Be a Fool, Follow the Stool):
- Profits
- Interest Rates
- Sentiment
- Valuations
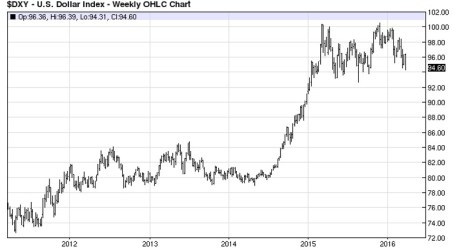
On the profit growth front, corporate income has been pressured by numerous headwinds over the last few years, including an export-shattering increase in the value of the U.S. dollar and a profit-squeezing collapse in energy sector earnings. As you can see from the chart below, the value of the U.S. dollar increased by about 25% from mid-2014 to early-2015, in part because of diverging global central bank policies (more hawkish U.S. Fed vs. more dovish ECB/international central banks). Since that spike, the dollar has settled into a broad range (95 – 100), and the former forceful headwind have now turned into modest tailwinds. This trend is important because an estimated 35-40% of corporate profits are derived from international operations.
Adding insult to injury, the roughly greater than -70% decline in forward energy earnings over the last 18 months has caused a significant hit to overall S&P 500 profits. The tide appears to be finally turning (or at least stabilizing) however, as we’ve seen oil prices rebound by about +30% this year from the lows in January. If these aforementioned trends persist, profit pressures in 2016 are likely to abate significantly, and may actually become additive to growth.
Source: Barchart.com
Profits are important, but so are interest rates. While incessant talk about the path of future Fed policy continues to blanket the airwaves (see also Fed Fatigue), absent a rapid increase in interest rates (say 300-400 basis points), interest rates remain unambiguously positive for equity markets, providing a floor for the oft-repeated volatility in financial markets. As long as stocks are providing higher yields than many bonds, and depositors are earning 0% (or negative rates) on their checking accounts, stocks may remain unloved, but not forgotten.
And speaking of unloved, the sentiment for stocks remains sour. One need look no further than the quarter-billion dollars in hemorrhaging outflows out of U.S. equity funds (see ICI Long-Term Mutual Fund Flows) since 2014. This deep underlying skepticism serves as a positive contrarian indicator for future equity prices. Right now, very few individual investors are swimming in the pool – the time to get out of the stock market pool is when everyone is jumping in.
And lastly, valuations remain very much in line with historical averages (approximatqely 17x 2016 projected earnings), especially considering the generational low in interest rates. Bears continue to point to the elevated CAPE ratio, which has been a disastrous indicator the last seven years (and longer), as a reason to remain cautious. The ironic part is that valuations are virtually guaranteed to improve a few years from now as we roll off the artificially depressed years of 2008-2010.
When you add it all up, zero (or negative) interest rates, combined with the other key factors of profits, sentiment, and valuations, equities remain an important and attractive part of a diversified long-term portfolio. Your objectives, time horizon, and risk tolerance will always drive the proportion of your equity allocation. Nevertheless, some bond exposure is essential to smooth out volatility. Regardless of your investment strategy, chasing headlines, like a dog chasing a car, serves no purpose other than leaving you with a tired, unproductive investment portfolio.
Wade W. Slome, CFA, CFP®
Plan. Invest. Prosper.
DISCLOSURE: Sidoxia Capital Management (SCM) and some of its clients own certain exchange traded funds, but at the time of publishing SCM had no direct position in any other security referenced in this article. No information accessed through the Investing Caffeine (IC) website constitutes investment, financial, legal, tax or other advice nor is to be relied on in making an investment or other decision. Please read disclosure language on IC “Contact” page.
Cutting Losses with Fisher’s 3 Golden Sell Rules

Returning readers to Investing Caffeine understand this is a location to cover a wide assortment of investing topics, ranging from electric cars and professional poker to taxes and globalization. Investing Caffeine is also a location that profiles great investors and their associated investment lessons.
Today we are going to revisit investing giant Phil Fisher, but rather than rehashing his accomplishments and overall philosophy, we will dig deeper into his selling discipline. For most investors, selling securities is much more difficult than buying them. The average investor often lacks emotional self-control and is unable to be honest with himself. Since most investors hate being wrong, their egos prevent taking losses on positions, even if it is the proper, rational decision. Often the end result is an inability to sell deteriorating stocks until capitulating near price bottoms.
Selling may be more difficult for most, but Fisher actually has a simpler and crisper number of sell rules as compared to his buy rules (3 vs. 15). Here are Fisher’s three sell rules:
1) Wrong Facts: There are times after a security is purchased that the investor realizes the facts do not support the supposed rosy reasons of the original purchase. If the purchase thesis was initially built on a shaky foundation, then the shares should be sold.
2) Changing Facts: The facts of the original purchase may have been deemed correct, but facts can change negatively over the passage of time. Management deterioration and/or the exhaustion of growth opportunities are a few reasons why a security should be sold according to Fisher.
3) Scarcity of Cash: If there is a shortage of cash available, and if a unique opportunity presents itself, then Fisher advises the sale of other securities to fund the purchase.
Reasons Not to Sell
Prognostications or gut feelings about a potential market decline are not reasons to sell in Fisher’s eyes. Selling out of fear generally is a poor and costly idea. Fisher explains:
“When a bear market has come, I have not seen one time in ten when the investor actually got back into the same shares before they had gone up above his selling price.”
In Fisher’s mind, another reason not to sell stocks is solely based on valuation. Longer-term earnings power and comparable company ratios should be considered before spontaneous sales. What appears expensive today may look cheap tomorrow.
There are many reasons to buy and sell a stock, but like most good long –term investors, Fisher has managed to explain his three-point sale plan in simplistic terms the masses can understand. If you are committed to cutting investment losses, I advise you to follow investment legend Phil Fisher – cutting losses will actually help prevent your portfolio from splitting apart.
Wade W. Slome, CFA, CFP®
Plan. Invest. Prosper.
DISCLOSURE: Sidoxia Capital Management (SCM) and some of its clients own certain exchange traded funds, but at the time of publishing SCM had no direct position in any other security referenced in this article. No information accessed through the Investing Caffeine (IC) website constitutes investment, financial, legal, tax or other advice nor is to be relied on in making an investment or other decision. Please read disclosure language on IC “Contact” page.
The Traitorous 8 and Birth of Silicon Valley

Over my 25 year investment career, I’ve made quite a few technology investments and visited dozens of Silicon Valley companies. I heard bits and pieces about the story of the Traitorous 8, but I never fully comprehended the technology revolution they started. Out of intellectual curiosity, I decided to delve a little deeper into the topic.
At the heart of this topic is a small device about the size of a fingernail. This object has several different names and can be quite confusing. The official name is an integrated circuit or IC, but usually it’s referred to as a chip, microchip, or semiconductor. These chips have become ubiquitous, scattered invisibly throughout our daily lives in our cars, computers, TVs, cell phones, appliances, and remote controls (an average household is home to about 1,000 of these semiconductors). Despite most people taking the microchip for granted, this diminutive piece of silicon created from our beach’s sand has contributed the largest burst of wealth creation in human history.
Before gaining a true understanding into the birth of Silicon Valley, we have to better understand the historical context in which the global technology capital was created – this takes us back to the early twentieth century when the vacuum tube was invented in 1904. Before Al Gore invented the Internet, we needed computers, and before we had personal computers, we needed integrated circuits, and before we had integrated circuits we had vacuum tubes (see chart below). Vacuum tubes were the electronic circuitry components required to make telephones, radios and televisions work in the early 1900s.
Tech History & the Vacuum Tube

The vacuum tube was invented in 1904 by an English physicist named John Ambrose Fleming. Like semiconductors, the main function of a vacuum tube is to control the flow of electric current. More specifically, a vacuum tube controls the current transferred between cathode and anode to make a circuit. Vacuum tubes were used for amazing applications, but in modern society this technology has been largely replaced by semiconductors, primarily because of cost, scalability and reliability factors.
The first all-electronic digital computer title is usually awarded to the ENIAC computer, which stood for Electronic Numerical Integrator and Calculator. ENIAC was built at the University of Pennsylvania between 1943 and 1945 by two professors, John Mauchly and J. Presper Eckert. World War II, the Soviet Union Cold War, and the space race kicked off by the Sputnik launch all pushed the vacuum tube technology to its limits. To give you an idea of how costly and inefficient vacuum tubes were relative to today’s microchips consider some of the ENIAC statistics. ENIAC filled a 20 x 40 foot room; weighed 30 tons; used more than 18,000 vacuum tubes; and only operated 50% of the time because operators were continuously replacing burned out vacuum tubes. In fact, the ENIAC vacuum tubes generated so much heat, the temperature in the computer room often reached 120 degrees.
Shockley – The Godfather of the Transistor

Something had to change to improve vacuum tube technology, and it did…thanks in large part to a physicist named William Shockley, the so-called “Godfather of the Transistor.” Shockley received his Bachelor of Science degree from Caltech in 1932 and earned his Ph.D. degree from MIT in 1936. After graduation, Shockley left the famous Bell Labs research center, which was a research division of AT&T at the time (now owned by Nokia). As part of Shockley’s work at Bell Labs in the late 1940s, he contributed to the invention of the transistor with experimentalist Walter Brattain and quantum theorist John Bardeen. Fundamentally, the transistor is a switch, which over time has shrunk down to the size of a virus. The transistor is what ultimately replaced the vacuum tubes because it is smaller, more efficient, more reliable, more durable, and cheaper than vacuum tubes. Transistors switch and amplify the flow of electronic signals to create digital ones and zeros that instruct electronic applications. Without the benefits of shrinking transistors, today’s computer servers would be three stories high.
How small have transistors become? Take the iPhone 6 for example – it uses the A8 chip, which is made up of a whopping two billion transistors. To accomplish this feat, engineers are now creating transistors at the atomic level. Large semiconductor manufacturers like Intel Corp (INTC) are now developing transistors at the 10 nanometer level. To put this scale into perspective, consider a sheet of paper is approximately 100,000 nanometers thick. So in order to create a 10 nanometer sheet of paper, one would have to slice a single sheet 10,000 times thinner to reach 10 nanometers…mind-boggling.
Building atomic sized transistor technology is very cool, but also very expensive. Only a handful of semiconductor manufacturers have enough capital to build these new state-of-the art facilities. Case in point is Intel’s D1X fabrication facility in Hillsboro, Oregon, which is estimated to have cost $6 billion. Like seeing the pyramids – it’s difficult to understand the enormity of the structure without visiting it, which I was fortunate to do in 2014. It’s very ironic that in order to build these microscopic transistors and integrated circuits, multi-billion dollar manufacturing facilities the size of 38 football fields (~2.2 million square feet) are required. Another example of a next-generation manufacturing facility is Taiwan Semiconductor’s – Fab 15 (TSM), which was estimated to cost $9.3 billion.
These mega-transistor manufacturing facilities would not have been possible without Shockley’s contributions. Having helped invent the transistor largely replace the dominant computing technology of the last half century (i.e., vacuum tube), Shockley mustered up the courage to leave Bell Labs and start his own company, but he needed some cash to make it happen. He contacted Arnold Beckman, CEO of Beckman Coulter and his old professor at Caltech. Over a boat ride in Newport Beach, California, Shockley asked Beckman for $1 million to start his own lab. Silicon Valley potentially could have started in Southern California, but Shockley explained his aging mother lived in Palo Alto and convinced Beckman to start Shockley Semiconductor Laboratory in Mountain View, California during 1956.
After Shockley Semiconductor began operations, everything appeared to be going according to plan. Shortly after opening shop and recruiting the best and brightest engineers across the country, Shockley and his former Bell Labs colleagues Walter Brattain and John Bardeen were notified they all had won the Nobel Prize in physics (see photo below).

After the Nobel Prize celebrations, everything went downhill quickly. Shockley was known as a brilliant engineer but a horrific manager. He put his employees through a battery of tests including psychological tests, intelligence tests, and even lie detector tests. Shockley also posted employee salaries publicly and recorded phone calls. He was a paranoid individual who believed his workers were stealing trade secrets and sabotaging projects, so therefore he wouldn’t share findings with his research staff. Adding insult to injury, Shockley was a racist, who believed blacks were genetically inferior with subpar IQs, so they shouldn’t have kids.
Here is a video link summarizing William Shockley’s leadership:
The Traitorous 8 Surface
In 1957, the year after Shockley Semiconductor Labs started up, the division reached 30 employees. Eight of the employees, Sheldon Roberts, Eugene Kleiner, Victor Grinich, Jay Last, Julius Blank, Jean Hoerni, Robert Noyce, and Gordon Moore finally said, enough-is-enough and decided mutiny was their best option.

The disgruntled group ended up contacting a 30-year-old, snot-nosed, Harvard MBA graduate named Arthur Rock, the individual who eventually coined the phrase “venture capitalist.” In 1957, Rock was a New York banker working at Hayden Stone & Co. Rock believed the group of eight engineers (six of which had Ph.Ds) deserved attention, given their experience working with a Nobel Prize winner. The Traitorous 8 simply wanted to find an employer that would hire them as a group, but Rock advised them to start their own company – a novel idea during the 1950s.
After making a list and calling about 40 blue chip companies from the Wall Street Journal for funding, Rock almost gave up until they received a lead to contact Sherman Fairchild. Fairchild was a wealthy entrepreneur and playboy who hung out at the El Morocco in New York with Howard Hughes. Rock convinced Fairchild, the CEO of Fairchild Camera & Instrument, to invest $1.5 million into a Traitorous 8 startup.
The rest is history. The Traitorous 8 set up shop as Fairchild Semiconductor (FCS) in Mountain View, about twelve blocks from Shockley’s operations. Over the next 10 years, Fairchild Semiconductor grew from twelve employees to twelve thousand employees, and raked in some $130 million in annual revenues. Of the original Traitorous 8, two have become historical figures – Robert “Bob” Noyce and Gordon Moore. All good things come to an end, and Noyce and Moore increasingly got frustrated with Fairchild’s mismanagement of the semiconductor division.
After Fairchild passed over Noyce for a CEO promotion in 1968, Noyce told Moore, “I’m going to leave, are you interested?” Moore agreed, so he and Noyce contacted Arthur Rock again for his assistance. Rock quickly helped them raise $2.5 million, and Intel Corporation (short for “Integrated Electronics”) was born. Three years later in 1971, Intel launched its IPO at $23.50 per share ($.02 split-adjusted). An investment of $10,000 back then would be worth about $12,000,000 today –about a +120,000% return.
Here’s a video summarizing the creation of Intel:
Thomas Edison of Silicon Valley
Nowadays, Noyce is hailed by many as the “Thomas Edison of Silicon Valley.” Noyce received his Ph.D. from MIT and is most known for his invention of the integrated circuit. During the late 1950s, other engineers also worked on the IC, including Jack Kilby at Texas Instruments, but Noyce received the first patent in 1961. Unlike Kilby, who created his IC from germanium, Noyce created his IC from silicon, the semiconductor of choice still today. After a decade of litigation, Noyce and Kilby settled their differences and decided to cross-license their patents. Unfortunately, the Nobel Foundation doesn’t issue Nobel Prizes posthumously, so when the Nobel Prize was issued for the invention of the integrated circuit in the year 2000 (10 years after Noyce’s death), only Kilby was recognized. To Kilby’s credit, he acknowledged the contributions of Noyce and others in his Nobel speech with a story of a rabbit and beaver looking up at the Hoover Dam, “No, I didn’t build it myself. But it’s based on an idea of mine!”
Moore’s Law Established
Arguably, Moore was just as influential as Noyce, but due to his quiet leadership style, Moore is often overlooked. Moore was a year younger than Noyce and earned his chemistry degree from Berkeley and Ph.D. from Caltech. Unlike Noyce, who grew up in the Midwest (Iowa), Moore was raised near Palo Alto, which made recruiting Moore by William Shockley quite easy. Moore’s largest contribution is considered to “Moore’s Law,” which generally states the number of transistors (i.e., a chip’s computing power) will double every 1-2 years. During the 1980s, Noyce described the implications of Moore’s Law by comparing Moore’s Law to the airline industry. If the airline industry progressed at the trajectory of the semiconductor industry over the last 20 years, then the 767 airplane would cost $500 and travel around the world in 20 minutes on five gallons of gas. Regrettably, not many industries advance at the pace of semiconductors.
Moore came up with “Moore’s Law” when her wrote a seminal article for Electronics magazine in 1965 and in the article he properly predicted that the number of transistors that could be squeezed onto a microchip (around 60 at the time) would increase 1,000-fold to 60,000 transistors by 1975. It would take decades for his projections to come true, but Moore very presciently predicted the explosion of home computers, cell phones (which he called “portable communications equipment”), electronic wrist-watches, digital cars, and a host of other electronic devices and applications. A half century later, Moore’s Law holds true, but the pace of transistor growth admittedly is slowing. The physics behind semiconductor manufacturing is running into serious limitations of quantum mechanics, cost, and heat. Microchips are becoming so dense and fast that the internal components in many cases are melting the chips in research labs.
Here is a video link summarizing Moore’s Law:
While Moore’s Law is approaching diminishing returns, the costs of microchips keep declining, power keeps increasing, and efficiency keeps improving. Despite the slowing in Moore’s Law, as you can see below, the adoption of transistors via microchips is not plateauing. According to Intel, we are now consuming an estimated sextillion transistors!

Source: Intel Corporation
Politics, economics, terrorism, and social issues may dominate the daily headlines, but behind the scenes there are daily miracles occurring due to technology advancements. Driving much of that innovation is the microchip, and without the Traitorous 8, the world would look a lot different and there would be no Silicon Valley as we know it today. Had Robert Noyce and Gordon Moore miserably resigned themselves to remain at Shockley Semiconductor, perhaps mankind would not have achieved the giant strides in global standards of living (see chart below). Thankfully, their contributions live on today and ensure a bright future for our kids, grandchildren, and the world at large.

Source: FRED
Wade W. Slome, CFA, CFP®
Plan. Invest. Prosper.
DISCLOSURE: Sidoxia Capital Management (SCM) and some of its clients hold positions in certain exchange traded funds (ETFs) and in INTC (non-discretionary), TXN (non-discretionary), T (non-discretionary), but at the time of publishing had no direct position in TSM, NOK, FCS, or any other security referenced in this article. No information accessed through the Investing Caffeine (IC) website constitutes investment, financial, legal, tax or other advice nor is to be relied on in making an investment or other decision. Please read disclosure language on IC Contact page.


