Posts tagged ‘Stocks’
Sports & Investing: Why Strong Earnings Can Hurt Stock Prices

With the World Cup in full swing and rabid fans rooting for their home teams, one may notice the many similarities between investing in stocks and handicapping in sports betting. For example, investors (bettors) have opposing views on whether a particular stock (team) will go up or down (win or lose), and determine if the valuation (point spread) is reflective of the proper equilibrium (supply & demand). And just like the stock market, virtually anybody off the street can place a sports bet – assuming one is of legal age and in a legal betting jurisdiction.
Soon investors will be poring over data as part of the critical, quarterly earnings ritual. With some unsteady GDP data as of late, all eyes will be focused on this earnings reporting season to reassure market observers the bull advance can maintain its momentum. However, even positive reports may lead to unexpected investor reactions.
So how and why can market prices go down on good news? There are many reasons that short-term price trends can diverge from short-run fundamentals. One major reason for the price-fundamental gap is this key factor: “expectations”. With such a large run-up in the equity markets (up approx. +195% from March 2009) come loftier expectations for both the economy and individual companies. For instance, just because corporate earnings unveiled from companies like Google (GOOG/GOOGL), J.P. Morgan (JPM), and Intel (INTC) exceed Wall Street analyst forecasts does not mean stock prices automatically go up. In many cases a stock price correction occurs due to a large group of investors who expected even stronger profit results (i.e., “good results, but not good enough”). In sports betting lingo, the sports team may have won the game this week, but they did not win by enough points (“cover the spread”).
Some other reasons stock prices move lower on good news:
- Market Direction: Regardless of the underlying trends, if the market is moving lower, in many instances the market dip can overwhelm any positive, stock- specific factors.
- Profit Taking: Many times investors holding a long position will have price targets or levels, if achieved, that will trigger selling whether positive elements are in place or not.
- Interest Rates: Certain valuation techniques (e.g. Discounted Cash Flow and Dividend Discount Model) integrate interest rates into the value calculation. Therefore, a climb in interest rates has the potential of lowering stock prices – even if the dynamics surrounding a particular security are excellent.
- Quality of Earnings: Sometimes producing winning results is not enough (see also Tricks of the Trade article). On occasion, items such as one-time gains, aggressive revenue recognition, and lower than average tax rates assist a company in getting over a profit hurdle. Investors value quality in addition to quantity.
- Outlook: Even if current period results may be strong, on some occasions a company’s outlook regarding future prospects may be worse than expected. A dark or worsening outlook can pressure security prices.
- Politics & Taxes: These factors may prove especially important to the market this year, since this is a mid-term election year. Political and tax policy changes today may have negative impacts on future profits, thereby impacting stock prices.
- Other Exogenous Items: Natural disasters and security attacks are examples of negative shocks that could damage price values, irrespective of fundamentals.
Certainly these previously mentioned issues do not cover the full gamut of explanations for temporary price-fundamental gaps. Moreover, many of these factors could be used in reverse to explain market price increases in the face of weaker than anticipated results.
If you’re traveling to Las Vegas to place a wager on the World Cup, betting on winning favorites like Germany and Argentina may not be enough. If expectations are not met and the hot team wins by less than the point spread, don’t be surprised to see a decline in the value of your bet.
Wade W. Slome, CFA, CFP®
Plan. Invest. Prosper.
DISCLOSURE: Sidoxia Capital Management (SCM) and some of its clients own certain exchange traded funds, GOOG, and GOOGL, but at the time of publishing had no direct positions in JPM and INTC. No information accessed through the Investing Caffeine (IC) website constitutes investment, financial, legal, tax or other advice nor is to be relied on in making an investment or other decision. Please read disclosure language on IC “Contact” page.
The Only Thing to Fear is the Unknown Itself

Martin Luther King, Jr. famously stated, “The only thing we have to fear is fear itself,” but when it comes to the stock market, the only thing to fear is the “unknown.” As much as people like to say, “I saw that crisis coming,” or “I knew the bubble was going to burst,” the reality is these assertions are often embellished, overstated, and/or misplaced.
How many people saw these events coming?
- 1987 – Black Monday
- Iraqi War
- Thai Baht Currency Crisis
- Long-Term Capital Management Collapse & Bailout
- 9/11 Terrorist Attack
- Lehman Brothers Bankruptcy / Bear Stearns Bailout
- Flash Crash
- U.S. Debt Downgrade
- Arab Spring
- Sequestration Cuts
- Cyprus Financial Crisis
- Federal Reserve (QE1, QE2, QE3, Operation Twist, etc.)
Sure, there will always be a prescient few who may actually get it right and profit from their crystal balls, but to assume you are smart enough to predict these events with any consistent accuracy is likely reckless. Even for the smartest and brightest minds, uncertainty and doubt surrounding such mega-events leads to inaction or paralysis. If profiting in advance of these negative outcomes was so easy, you probably would be basking in the sun on your personal private island…and not reading this article.
Coming to grips with the existence of a never-ending series of future negative financial shocks is the price of doing business in the stock market, if you want to become a successful long-term investor. The fact of the matter is with 7 billion people living on a planet orbiting the sun at 67,000 mph, the law of large numbers tells us there will be many unpredictable events caused either by pure chance or poor human decisions. As the great financial crisis of 2008-2009 proved, there will always be populations of stupid or ignorant people who will purposely or inadvertently cause significant damage to economies around the world.
Fortunately, the power of democracy (see Spreading the Seeds of Democracy) and the benefits of capitalism have dramatically increased the standards of living for hundreds of millions of people. Despite horrific outcomes and unthinkable atrocities perpetrated throughout history, global GDP and living standards continue to positively march forward and upward. For example, consider in my limited lifespan, I have seen the introduction of VCRs, microwave ovens, mobile phones, and the internet, while experiencing amazing milestones like the eradication of smallpox, the sequencing of the human genome, and landing space exploration vehicles on Mars, among many other unimaginable achievements.
Despite amazing advancements, many investors are paralyzed into inaction out of fear of a harmful outcome. If I received a penny for every negative prediction I read or heard about over my 20+ years of investing, I would be happily retired. The stock market is never immune from adverse events, but chances are a geopolitical war in Ukraine/Iraq; accelerated Federal Reserve rate tightening; China real estate bubble; Argentinian debt default; or other current, worrisome headline is unlikely to be the cause of the next -20%+ bear market. History shows us that fear of the unknown is more rational than the fear of the known. If you can’t come to grips with fear itself, I fear your long-term results will lead to a scary retirement.
Wade W. Slome, CFA, CFP®
Plan. Invest. Prosper.
DISCLOSURE: Sidoxia Capital Management (SCM) and some of its clients hold long positions in certain exchange traded funds, but at the time of publishing SCM had no direct position in any other security referenced in this article. No information accessed through the Investing Caffeine (IC) website constitutes investment, financial, legal, tax or other advice nor is to be relied on in making an investment or other decision. Please read disclosure language on IC Contact page.
Stocks Winning vs. Weak Competitors

This article is an excerpt from a previously released Sidoxia Capital Management complementary newsletter (June 2, 2014). Subscribe on the right side of the page for the complete text.
Winning at any sport is lot easier if you can compete without an opponent. Imagine an NBA basketball MVP LeBron James driving to the basket against no defender, or versus a weakling opponent like a 44-year-old investment manager. Under these circumstances, it would be pretty easy for James and his team, the Miami Heat, to victoriously dominate without even a trace of sweat.
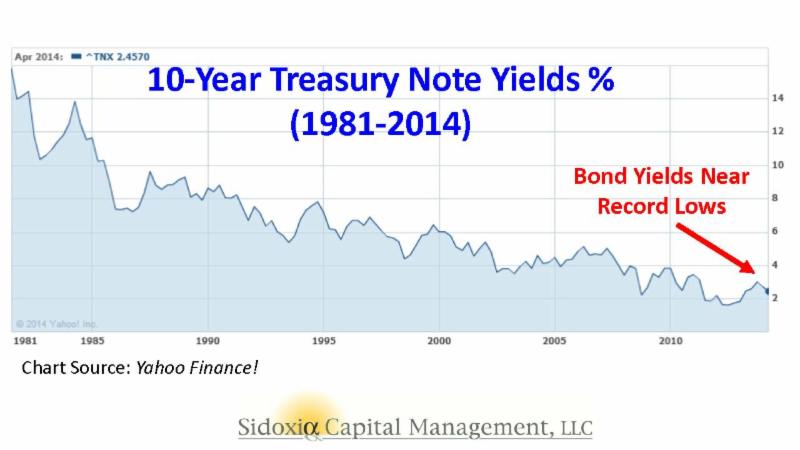
Effectively, stocks have enjoyed similar domination in recent years, while steamrolling over the bond competition. To put the stock market’s winning streak into perspective, the S&P 500 index set a new all-time record high in May, with the S&P 500 advancing +2.1% to 1924 for the month, bringing the 2013-2014 total return to about +38%. Not too shabby results over 17 months, if you consider bank deposits and CDs are paying a paltry 0.0-1.0% annually, and investors are gobbling up bonds yielding a measly 2.5% (see chart below).
The point, once again, is that even if you are a skeptic or bear on the outlook for stocks, the stock market still offers the most attractive opportunities relative to other asset classes and investment options, including bonds. It’s true, the low hanging fruit in stocks has been picked, and portfolios can become too equity-heavy, but even retirees should have some exposure to equities.
As I wrote last month in Buy in May and Dance Away, why would investors voluntarily lock in inadequate yields at generational lows when the earnings yield on stocks are so much more appealing. The approximate P/E (Price-Earnings) ratio for the S&P 500 currently averages approximately +6.2% with a rising dividend yield of about +1.8% – not much lower than many bonds. Over the last five years, those investors willing to part ways with yield-less cash have voted aggressively with their wallets. Those with confidence in the equity markets have benefited massively from the approximate +200% gains garnered from the March 2009 S&P 500 index lows.
For the many who have painfully missed the mother of all stock rallies, the fallback response has been, “Well, sure the market has tripled, but it’s only because of unprecedented printing of money at the QE (Quantitative Easing) printing presses!” This argument has become increasingly difficult to defend ever since the Federal Reserve announced the initiation of the reduction in bond buying (a.k.a., “tapering”) six months ago (December 18th). Over that time period, the Dow Jones Industrial Average has increased over 800 points and the S&P 500 index has risen a healthy 8.0%.
As much as everyone would like to blame (give credit to) the Fed for the bull market, the fact is the Federal Reserve doesn’t control the world’s interest rates. Sure, the Fed has an influence on global interest rates, but countries like Japan may have something to do with their own 0.57% 10-year government bond yield. For example, the economic/political policies and demographics in play might be impacting Japan’s stock market (Nikkei), which has plummeted about -62% over the last 25 years (about 39,000 to 15,000). Almost as shocking as the lowly rates in Japan and the U.S. and Japan, are the astonishingly low interest rates in Europe. As the chart below shows, France and Germany have sub-2% 10-year government bond yields (1.76% and 1.36%, respectively) and even economic basket case countries like Italy and Spain have seen their yields pierce below the 3% level.
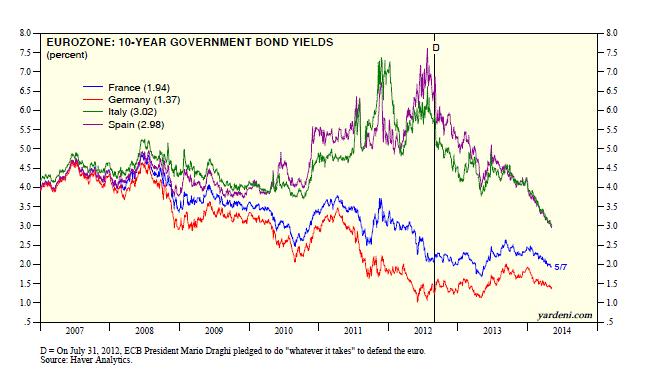 Source: Dr. Ed’s Blog
Suffice it to say, yield is not only difficult to find on our shores, but it is also challenging to find winning bond returns globally.
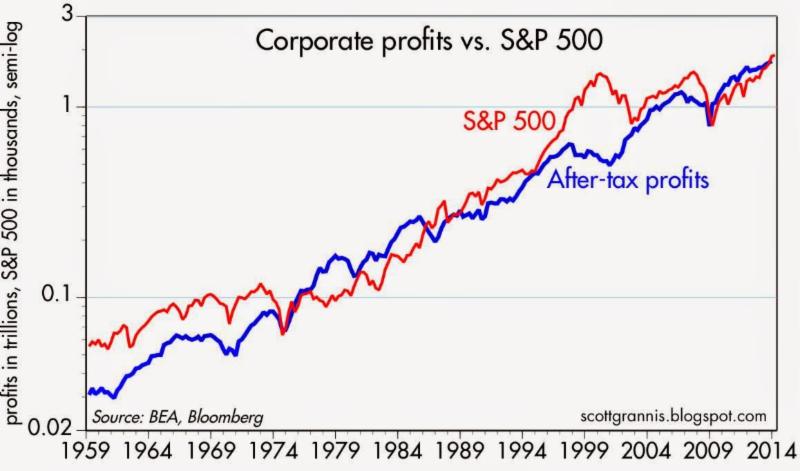
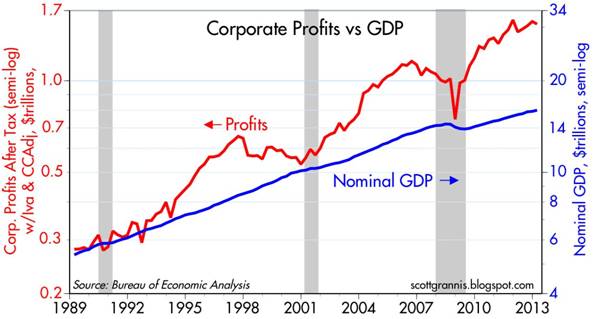
Well if low interest rates and the Federal Reserve aren’t the only reasons for a skyrocketing stock market, then how come this juggernaut performance has such long legs? The largest reason in my mind boils down to two words…record profits. Readers of mine know I follow the basic tenet that stock prices follow earnings over the long-term. Interest rates and Fed Policy will provide headwinds and tailwinds over different timeframes, but ultimately the almighty direction of profits determines long-run stock performance. You don’t have to be a brain surgeon or rocket scientist to appreciate this correlation. Scott Grannis (Calafia Beach Pundit) has beautifully documented this relationship in the chart below.
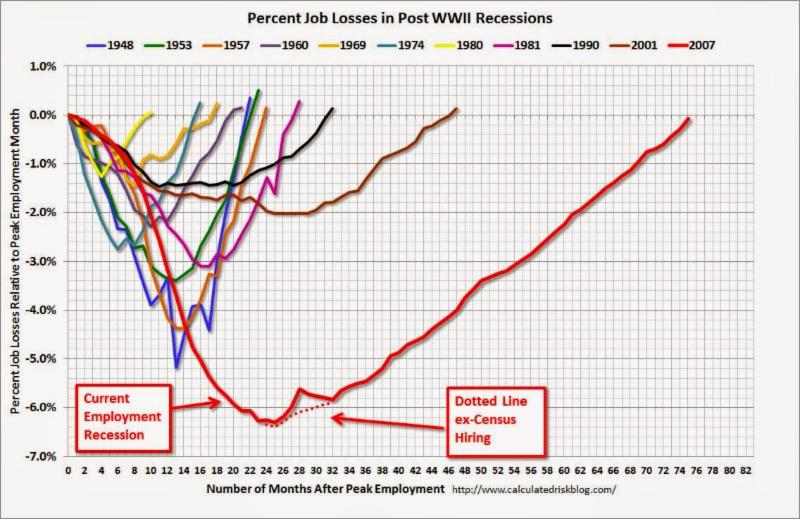
Supporting this concept, profits help support numerous value-enhancing shareholder activities we have seen on the rise over the last five years, which include rising dividends, share buybacks, and M&A (Mergers & Acquisitions) activity. Eventually the business cycle will run its course, and during the next recession, profits and stock prices will be expected to decline. A final contributing factor to the duration of this bull market is the abysmally slow pace of this economic recovery, which if measured in job creation terms has been the slowest since World War II. Said differently, the slower a recovery develops, the longer the recovery will last. Bill McBride at Calculated Risk captured this theme in the following chart:
Despite the massive gains and new records set, skeptics abound as evidenced by the nearly -$10 billion of withdrawn money out of U.S. stock funds over the last month (most recent data).
I’ve been labeled a perma-bull by some, but over my 20+ years of investing experience I understand the importance of defensive positioning along with the benefits of shorting expensive, leveraged stocks during bear markets, like the ones in 2000-2001 and 2008-2009. When will I reverse my views and become bearish (negative) on stocks? Here are a few factors I’m tracking:
- Inverted Yield Curve: This was a good precursor to the 2008-2009 crash, but there are no signs of this occurring yet.
- Overheated Fund Inflows: When everyone piles into stocks, I get nervous. In the last four weeks of domestic ICI fund flow data, we have seen the opposite…about -$9.5 billion outflows from stock funds.
- Peak Employment: When things can’t get much better is the time to become more worried. There is still plenty of room for improvement, especially if you consider the stunningly low employment participation rate.
- Fed Tightening / Rising Bond Yields: The Fed has made it clear, it will be a while before this will occur.
- When Housing Approaches Record Levels: Although Case-Shiller data has shown housing prices bouncing from the bottom, it’s clear that new home sales have stalled and have plenty of head room to go higher.
- Financial Crisis: Chances of experiencing another financial crisis of a generation is slim, but many people have fresh nightmares from the 2008-2009 financial crisis. It’s not every day that a 158 year-old institution (Lehman Brothers) or 85 year-old investment bank (Bear Stearns) disappear, but if the dominoes start falling again, then I guess it’s OK to become anxious again.
- Better Opportunities: The beauty about my practice at Sidoxia is that we can invest anywhere. So if we find more attractive opportunities in emerging market debt, convertible bonds, floating rate notes, private equity, or other asset classes, we have no allegiances and will sell stocks.
Every recession and bear market is different, and although the skies may be blue in the stock market now, clouds and gray skies are never too far away. Even with record prices, many fears remain, including the following:
- Ukraine: There is always geopolitical instability somewhere on the globe. In the past investors were worried about Egypt, Iran, and Syria, but for now, some uncertainty has been created around Ukraine.
- Weak GDP: Gross Domestic Product was revised lower to -1% during the first quarter, in large part due to an abnormally cold winter in many parts of the country. However, many economists are already talking about the possibility of a 3%+ rebound in the second quarter as weather improves.
- Low Volatility: The so-called “Fear Gauge” is near record low levels (VIX index), implying a reckless complacency among investors. While this is a measure I track, it is more confined to speculative traders compared to retail investors. In other words, my grandma isn’t buying put option insurance on the Nasdaq 100 index to protect her portfolio against the ramifications of the Thailand government military coup.
- Inflation/Deflation: Regardless of whether stocks are near a record top or bottom, financial media outlets in need of a topic can always fall back on the fear of inflation or deflation. Currently inflation remains in check. The Fed’s primary measure of inflation, the Core PCE, recently inched up +0.2% month-to-month, in line with forecasts.
- Fed Policy: When are investors not worried about the Federal Reserve’s next step? Like inflation, we’ll be hearing about this concern until we permanently enter our grave.
In the sport of stocks and investing, winning is never easy. However, with the global trend of declining interest rates and the scarcity of yields from bonds and other safe investments (cash/money market/CDs), it should come as no surprise to anyone that the winning streak in stocks is tied to the lack of competing investment alternatives. Based on the current dynamics in the market, if LeBron James is a stock, and I’m forced to guard him as a 10-year Treasury bond, I think I’ll just throw in the towel and go to Wall Street. At least that way my long-term portfolio has a chance of winning by placing a portion of my bets on stocks over bonds.
Wade W. Slome, CFA, CFP®
Plan. Invest. Prosper.
DISCLOSURE: Sidoxia Capital Management (SCM) and some of its clients hold positions in certain exchange traded funds (ETFs), but at the time of publishing SCM had no direct position in any other security referenced in this article. No information accessed through the Investing Caffeine (IC) website constitutes investment, financial, legal, tax or other advice nor is to be relied on in making an investment or other decision. Please read disclosure language on IC Contact page.
Buy in May and Tap Dance Away

This article is an excerpt from a previously released Sidoxia Capital Management complementary newsletter (May 1, 2014). Subscribe on the right side of the page for the complete text.
The proverbial Wall Street adage that urges investors to “Sell in May, and go away” in order to avoid a seasonally volatile period from May to October has driven speculative trading strategies for generations. The basic premise behind the plan revolves around the idea that people have better things to do during the spring and summer months, so they sell stocks. Once the weather cools off, the thought process reverses as investors renew their interest in stocks during November. If investing was as easy as selling stocks on May 1 st and then buying them back on November 1st, then we could all caravan in yachts to our private islands while drinking from umbrella-filled coconut drinks. Regrettably, successful investing is not that simple and following naïve strategies like these generally don’t work over the long-run.
Even if you believe in market timing and seasonal investing (see Getting Off the Market Timing Treadmill ), the prohibitive transaction costs and tax implications often strip away any potential statistical advantage.
Unfortunately for the bears, who often react to this type of voodoo investing, betting against the stock market from May – October during the last two years has been a money-losing strategy. Rather than going away, investors have been better served to “Buy in May, and tap dance away.” More specifically, the S&P 500 index has increased in each of the last two years, including a +10% surge during the May-October period last year.
Nervous? Why Invest Now?
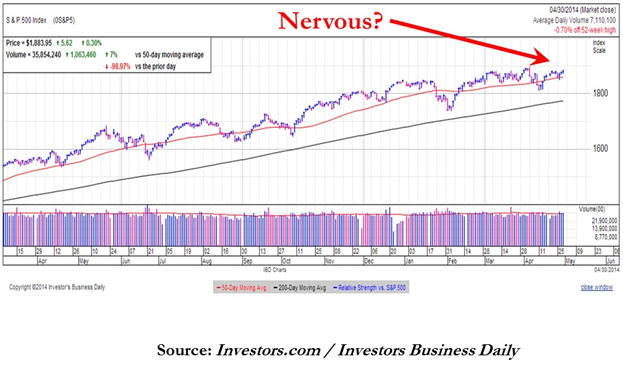
With the weak recent economic GDP figures and stock prices off by less than 1% from their all-time record highs, why in the world would investors consider investing now? Well, for starters, one must ask themselves, “What options do I have for my savings…cash?” Cash has been and will continue to be a poor place to hoard funds, especially when interest rates are near historic lows and inflation is eating away the value of your nest-egg like a hungry sumo wrestler. Anyone who has completed their income taxes last month knows how pathetic bank rates have been, and if you have pumped gas recently, you can appreciate the gnawing impact of escalating gasoline prices.
While there are selective opportunities to garner attractive yields in the bond market, as exploited in Sidoxia Fusion strategies, strategist and economist Dr. Ed Yardeni points out that equities have approximately +50% higher yields than corporate bonds. As you can see from the chart below, stocks (blue line) are yielding profits of about +6.6% vs +4.2% for corporate bonds (red line). In other words, for every $100 invested in stocks, companies are earning $6.60 in profits on average, which are then either paid out to investors as growing dividends and/or reinvested back into their companies for future growth.
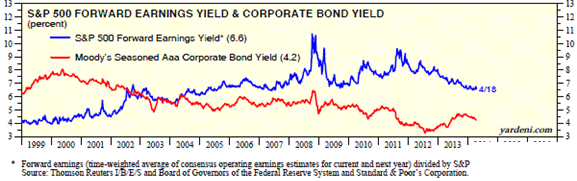
Source: Dr. Ed’s Blog
Hefty profit streams have resulted in healthy corporate balance sheets, which have served as ammunition for the improving jobs picture. At best, the economic recovery has moved from a snail’s pace to a tortoise’s pace, but nevertheless, the unemployment rate has returned to a more respectable 6.7% rate. The mended economy has virtually recovered all of the approximately 9 million private jobs lost during the financial crisis (see chart below) and expectations for Friday’s jobs report is for another +220,000 jobs added during the month of April.
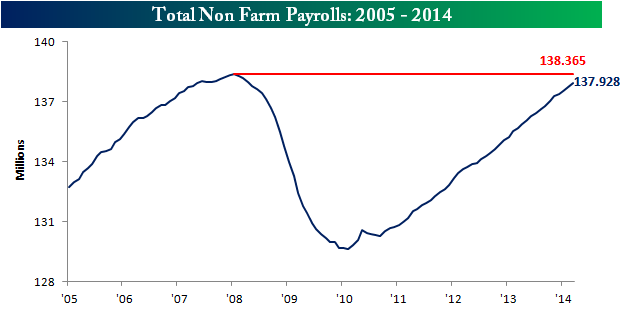
Source: Bespoke
Wondrous Wing Woman
Investing can be scary for some individuals, but having an accommodative Fed Chair like Janet Yellen on your side makes the challenge more manageable. As I’ve pointed out in the past (with the help of Scott Grannis), the Fed’s stimulative ‘Quantitative Easing’ program counter intuitively raised interest rates during its implementation. What’s more, Yellen’s spearheading of the unprecedented $40 billion bond buying reduction program (a.k.a., ‘Taper’) has unexpectedly led to declining interest rates in recent months. If all goes well, Yellen will have completed the $85 billion monthly tapering by the end of this year, assuming the economy continues to expand.
In the meantime, investors and the broader financial markets have begun to digest the unwinding of the largest, most unprecedented monetary intervention in financial history. How can we tell this is the case? CEO confidence has improved to the point that $1 trillion of deals have been announced this year, including offers by Pfizer Inc. – PFE ($100 billion), Facebook Inc. – FB ($19 billion), and Comcast Corp. – CMCSA ($45 billion).

Source: Entrepreneur
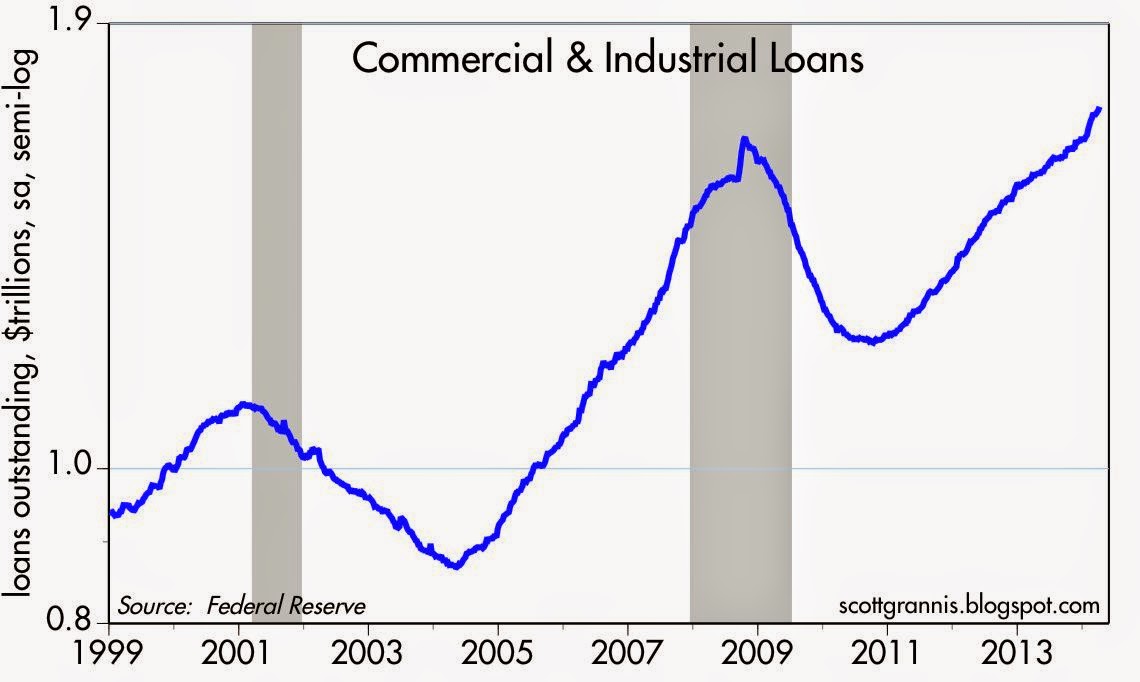
Banks are feeling more confident too, and this is evident by the acceleration seen in bank loans. After the financial crisis, gun-shy bank CEOs fortified their balance sheets, but with five years of economic expansion under their belts, the banks are beginning to loosen their loan purse strings further (see chart below).
The coast is never completely clear. As always, there are plenty of things to worry about. If it’s not Ukraine, it can be slowing growth in China, mid-term elections in the fall, and/or rising tensions in the Middle East. However, for the vast majority of investors, relying on calendar adages (i.e., selling in May) is a complete waste of time. You will be much better off investing in attractively priced, long-term opportunities, and then tap dance your way to financial prosperity.
Wade W. Slome, CFA, CFP®
Plan. Invest. Prosper.
DISCLOSURE: Sidoxia Capital Management (SCM) and some of its clients hold positions in PFE, CMCSA, and certain exchange traded funds (ETFs), but at the time of publishing SCM had no direct position in FB or any other security referenced in this article. No information accessed through the Investing Caffeine (IC) website constitutes investment, financial, legal, tax or other advice nor is to be relied on in making an investment or other decision. Please read disclosure language on IC Contact page.
The EPS House of Cards: Tricks of the Trade

As we enter the quarterly ritual of the tsunami of earnings reports, investors will be combing through the financial reports. Due to the flood of information, and increasingly shorter and shorter investment time horizons, much of investors’ focus will center on a few quarterly report metrics – primarily earnings per share (EPS), revenues, and forecasts/guidance (if provided).
Many lessons have been learned from the financial crisis over the last few years, and one of the major ones is to do your homework thoroughly. Relying on a AAA ratings from Moody’s (MCO) and S&P (when ratings should have been more appropriately graded D or F) or blindly following a “Buy” rating from a conflicted investment banking firm just does not make sense.
FINANCIAL SECTOR COLLAPSE
Given the severity of the losses, investors need to be more demanding and comprehensive in their earnings analysis. In many instances the reported earnings numbers resemble a deceptive house of cards on a weak foundation, merely overlooked by distracted investors. Case in point is the Financial sector, which before the financial collapse saw distorted multi-year growth, propelled by phantom earnings due to artificial asset inflation and excessive leverage. One need look no further than the weighting of Financial stocks, which ballooned from 5% of the total S&P 500 Index market capitalization in 1980 to a peak of 23% in 2007. Once the credit and real estate bubble burst, the sector subsequently imploded to around 9% of the index value around the March 2009 lows. Let’s be honest, and ask ourselves how much faith can we put in the Financial sector earnings figures that moved from +$22.79 in 2007 to a loss of -$21.24 in 2008? Since that time regulation and reform has put the sector on a more solid footing. Luckily, the opacity and black box nature of many of these Financials largely kept me out of the 2009 sector implosion.
WHAT TO WATCH FOR
But the Financial sector is not the only fuzzy areas of accounting manipulation. Thanks to our friends at the FASB (Financial Accounting Standards Board), company management teams have discretion in how they apply different GAAP (Generally Accepted Accounting Principles) rules. Saj Karsan, a contributing writer at Morningstar.com, also writes about the “Fallacy of Earnings Per Share.”
“EPS can fluctuate wildly from year to year. Writedowns, abnormal business conditions, asset sale gains/losses and other unusual factors find their way into EPS quite often. Investors are urged to average EPS over a business cycle, as stressed in Security Analysis Chapter 37, in order to get a true picture of a company’s earnings power.”
These gray areas of interpretation can lead to a range of distorted EPS outcomes. Here are a few ways companies can manipulate their EPS:
Distorted Expenses: If a $10 million manufacturing plant is expected to last 10 years, then the depreciation expense should be $1 million per year. If for some reason the Chief Financial Officer (CFO) suddenly decided the building would last 40 years rather than 10 years, then the expense would only be $250,000 per year. Voila, an instant $750,000 annual gain was created out of thin air due to management’s change in estimates.
Magical Revenues: Some companies have been known to do what’s called “stuffing the channel.” Or in other words, companies sometimes will ship product to a distributor or customer even if there is no immediate demand for that product. This practice can potentially increase the revenue of the reporting company, while providing the customer with more inventory on-hand. The major problem with the strategy is cash collection, which can be pushed way off in the future or become uncollectible.
Accounting Shifts: Under certain circumstances, specific expenses can be converted to an asset on the balance sheet, leading to inflated EPS numbers. A common example of this phenomenon occurs in the software industry, where software engineering expenses on the income statement get converted to capitalized software assets on the balance sheet. Again, like other schemes, this practice delays the negative expense effects on reported earnings.
Artificial Income: Not only did many of the trouble banks make imprudent loans to borrowers that were unlikely to repay, but the loans were made based on assumptions that asset prices would go up indefinitely and credit costs would remain freakishly low. Based on the overly optimistic repayment and loss assumptions, banks recognized massive amounts of gains which propelled even more imprudent loans. Needless to say, investors are now more tightly questioning these assumptions. That said, recent relaxation of mark-to-market accounting makes it even more difficult to estimate the true values of assets on the bank’s balance sheets.
Like dieting, there are no easy solutions. Tearing through the financial statements is tough work and requires a lot of diligence. My process of identifying winning stocks is heavily cash flow based (see my article on cash flow investing) analysis, which although lumpier and more volatile than basic EPS analysis, provides a deeper understanding of a company’s value-creating capabilities and true cash generation powers.
As earnings season kicks into full gear, do yourself a favor and not only take a more critical” eye towards company earnings, but follow the cash to a firmer conviction in your stock picks. Otherwise, those shaky EPS numbers may lead to a tumbling house of cards.
Read Saj Karsan’s Full Article
Wade W. Slome, CFA, CFP®
Plan. Invest. Prosper.
DISCLOSURE: Sidoxia Capital Management has no direct position in MCO or MHP at the time this article was originally posted. No information accessed through the Investing Caffeine (IC) website constitutes investment, financial, legal, tax or other advice nor is to be relied on in making an investment or other decision. Please read disclosure language on IC “Contact” page.
Investing, Housing, and Speculating

We all know there was a lot of speculation going on in the housing market during 2005-2007 as risk-loving adventurists loaded up on NINJA loans (No Income, No Job, and No Assets) and subprime CDS (Credit Default Swap) securities. But there is a different kind of speculation going on now, and it isn’t tied directly to housing. Instead of buying a house with no down payment and a no interest loan, speculators are leaping into other hazardous areas of danger. Like a frog jumping from lily pad to lily pad, speculators are now hopping around onto money-chasing industries, including biotech, social media, Bitcoin, and alternative energy.
As French novelist Jean-Baptise Alphonse Karr noted, “The more things change, the more they stay the same.” Irrespective of the painful consequences of the bubble-bursting aftermaths, human behavior and psychology addictively succumb to the ever-seductive emotion of greed. Over the last 15 years, massive fortunes have been gained and lost while chasing frothy financial dreams in areas like technology, housing, and gold.
Most get-rich-quick dream chasers have no idea of how to invest in or value a stock, but they sure know a good story when they hear one. Chasing top performing stocks is lot like jumping off a bridge – anyone can do it, and it feels exhilarating until you hit the ground. However, there is a better way to create wealth. Despite rampant speculation, most individuals understand the principles behind buying a house, which if applied to stocks, can make you a superior investor, and assist you in avoiding dangerous, speculative investments.
Here are some valuable housing insights to improve your stock buying:
#1.) Price is the Almighty Variable: Successful real estate investors don’t make their fortunes by chasing properties that double or triple in value. Buying a rusty tool shed for $1 million makes about as much sense as Facebook paying $19 billion (1,000 x’s the estimated 2013 annual revenues) for a money-losing company, WhatsApp. Better to buy real estate when there is blood in the street. Like the stock market, housing is cyclical. Many traders believe that price patterns are more important than the actual price. If squiggly, technical price moving averages (see Technical Analysis article) make so much money for stock-renting speculators, then how come day traders haven’t used their same crossing-lines and Point & Figure software in the housing market? Yes, it’s true that the real estate transactions costs and illiquidity can be costly for real estate buyers, but 6% load fees, lockup periods, 20% hedge fund fees, and 9% margin rates haven’t stopped stock speculators either.
#2). Cash is King: It doesn’t take a genius to purchase a rental property – I know because practically half the people I know in Southern California own rental properties. For example, if I buy a rental property for $1 million cash, is it a good purchase? Well, it depends on how much after-tax cash I can collect by renting it out? If I can only net $3,000 per month (3.6% annualized return), and be responsible for replacing roofs, fixing toilets, and evicting tenants, then perhaps I would be better off by collecting 6.5% from a low-cost, tax-efficient exchange traded real estate fund, without having to suffer from all the headaches that physical real estate investing brings. Forecasting future asset price appreciation is tougher, but the point is, understanding the underlying cash flow dynamics of a company is just as important as it is for housing purchases.
#3). Debt/Leverage Cuts in Both Directions: Adding debt (or leverage) to a housing or stock investment can be fantastic if prices go up, and disastrous if prices go down. Putting a 20% down payment on a $1 million house works out wonderfully, if the price of the house increases to $1.2 million. My $200,000 down payment is now worth $400,000, or up +100%. The same math works in reverse. If the price of the home drops to $800,000, then my $200,000 down payment is now worth $0, or down -100% (ouch). Margin debt on an equity brokerage account works in a similar fashion, but usually a 50% down payment is needed (less risky than real estate). That’s why I always chuckle when many real estate investors tell me they steer clear of stocks because they are “too risky”.
#4). Growth Matters: If you buy a home for $1 million, is it likely to be worth more if you add a kitchen, tennis court, swimming pull, third floor, and putting green? In short, the answer is yes. The same principle applies to stocks. All else equal, if a company based in Los Angeles, establishes new offices in New York, London, Beijing, and Rio de Janeiro, and then acquires a profitable competitor at a discounted price, chances are the company will be much more valuable after the additions. The key concept here is that asset values are not static. Asset valuations are impacted in both directions, whether we are talking about positive growth opportunities or negative disruptions.
Overall, speculatively chasing performance is tempting, but if you don’t want your financial foundation to crumble, then build your successful investment future by sticking to the fundamentals and financial basics.
Wade W. Slome, CFA, CFP®
Plan. Invest. Prosper.
DISCLOSURE: Sidoxia Capital Management (SCM) and some of its clients hold long positions in certain exchange traded funds (ETFs), but at the time of publishing SCM had no direct discretionary position in FB, Bitcoin, or any other security referenced in this article. No information accessed through the Investing Caffeine (IC) website constitutes investment, financial, legal, tax or other advice nor is to be relied on in making an investment or other decision. Please read disclosure language on IC Contact page.
2013 Investing Caffeine Greatest Hits

Source: Photobucket
From the Boston bombings and Detroit’s bankruptcy to Pope Francis and Nelson Mandela, there were many attention grabbing headlines in 2013. Investing Caffeine made its own headlines after 4 1/2 years of blogging, including Sidoxia Capital Management’s media expansion (see Twitter & Media pages).
Thank you to all the readers who inspire me to spew out my random but impassioned thoughts on a somewhat regular basis. Investing Caffeine and Sidoxia Capital Management wish you a healthy, happy, and prosperous New Year in 2014!
Here are some of the most popular Investing Caffeine postings over the year:
10) Confessions of a Bond Hater

9) What’s Going On With This Crazy Market?

8) Information Choking Your Money

7) Beware: El-Erian & Gross Selling Buicks…Not Chevys

6) The Central Bank Dog Ate My Homework

5) Confusing Fear Bubbles with Stock Bubbles

4) Vice Tightens for Those Who Missed the Pre-Party

3) Sitting on the Sidelines: Fear & Selective Memory

2) The Most Hated Bull Market Ever

1) 2014: Here Comes the Dumb Money!

Happy New Year’s!
Wade W. Slome, CFA, CFP®
Plan. Invest. Prosper.
DISCLOSURE: Sidoxia Capital Management (SCM) and some of its clients hold positions in certain exchange traded funds (ETFs), but at the time of publishing SCM had no direct position in any other security referenced in this article. No information accessed through the Investing Caffeine (IC) website constitutes investment, financial, legal, tax or other advice nor is to be relied on in making an investment or other decision. Please read disclosure language on IC Contact page. Special editorial thanks to Lt. Andrew A. Pierce for his contributions on this article.
Stocks Take a Breather after Long Sprint

Like a sprinter running a long sprint, the stock market eventually needs to take a breather too, and that’s exactly what investors experienced this week as they witnessed the Dow Jones Industrial Average face its largest drop of 2013 (down -2.2%) – and also the largest weekly slump since 2012. Runners, like financial markets, sooner or later suffer fatigue, and that’s exactly what we’re seeing after a relatively unabated +27% upsurge over the last nine months. Does a -2% hit in one week feel pleasant? Certainly not, but before the next race, the markets need to catch their breath.
By now, investors should not be surprised that pitfalls and injuries are part of the investment racing game – something Olympian Mary Decker Slaney can attest to as a runner (see 1984 Olympic 3000m final against Zola Budd). As I have pointed out in previous articles (Most Hated Bull Market), the almost tripling in stock prices from the 2009 lows has not been a smooth, uninterrupted path-line, but rather investors have endured two corrections averaging -20% and two other drops approximating -10%. Instead of panicking by locking in damaging transaction costs, taxes, and losses, it is better to focus on earnings, cash flows, valuations, and the relative return available in alternative asset classes. With generationally low interest rates occurring over recent periods, the available subset of attractive investment opportunities has narrowed (see Confessions of a Bond Hater), leaving many investing racers to default to stocks.
Recent talk of potential Federal Reserve bond purchase “tapering” has led to a two-year low in bond prices and caused a mini spike in interest rates (10-year Treasury note currently yielding +2.83%). At the margin, this trend makes bonds more attractive (lower prices), but as you can see from the chart below, interest rates are still relatively close to historically low yields. For the time being, this still makes domestic equities an attractive asset class.
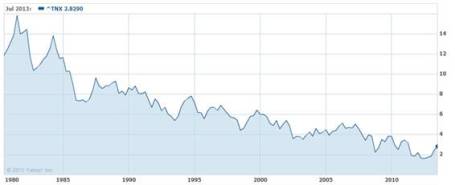
Source: Yahoo! Finance
Price Follows Earnings
The simple but true axiom that stock prices follow earnings over the long-run is just as true today as it was a century ago. Interest rates and price-earnings ratios can also impact stock prices. To illustrate my argument, let’s talk baseball. Wind, rain, and muscle (interest rates, PE ratios, political risk, etc.) are factors impacting the direction of a thrown baseball (stock prices), but gravity is the key factor influencing the ultimate destination of the baseball. Long-term earnings growth is the equivalent factor to gravity when talking about stock prices.
To buttress my point that stock prices following long-term earnings, consider the fact that S&P 500 annualized operating earnings bottomed in 2009 at $39.61. Since that point, annualized earnings through the second quarter of 2013 (~94% of companies reported results) have reached $99.30, up +151%. S&P 500 stock prices bottomed at 666 in 2009, and today the index sits at 1655, +148%. OK, so earnings are up +151% and stock prices are up +148%. Coincidence? Perhaps not.
If we take a closer look at earnings, the deceleration of earnings growth is unmistakable (see Financial Times chart below), yet the S&P 500 index is still up +16% this year, excluding dividends. In reality, predicting multiple expansion or contraction is nearly impossible. For example, earnings in the S&P 500 grew an incredible +15% in 2011, yet stock prices were anemically flat for that year, showing no price appreciation (+0.0%). Since the end of 2011, earnings have risen a meager +3%, however stock prices have catapulted +32%. Is this multiple expansion sustainable? Given stock P/E ratios remain in a reasonable 15-16x range, according to forward and trailing earnings, there is some room for expansion, but the low hanging fruit has been picked and further double-digit price appreciation will require additional earnings growth.
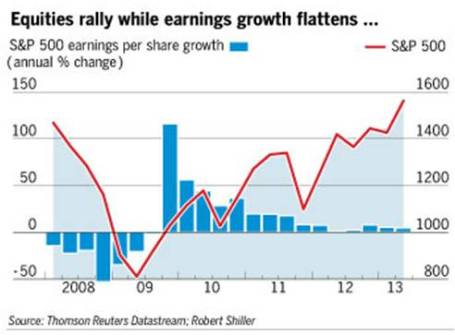
Source: Financial Times
But stocks should not be solely looked through a domestic lens…there is another 95% of the world’s population slowly embracing capitalism and democracy to fuel future dynamic earnings growth. At Sidoxia (www.Sidoxia.com), we are finding plenty of opportunities outside our U.S. borders, including alternative asset classes.
The investment race continues, and taking breathers is part of the competition, especially after long sprints. Rather than panic, enjoy the respite.
Wade W. Slome, CFA, CFP®
Plan. Invest. Prosper.
DISCLOSURE: Sidoxia Capital Management (SCM) and some of its clients hold positions in certain exchange traded funds (ETFs), but at the time of publishing, SCM had no direct position in any other security referenced in this article. No information accessed through the Investing Caffeine (IC) website constitutes investment, financial, legal, tax or other advice nor is to be relied on in making an investment or other decision. Please read disclosure language on IC Contact page.
1994 Bond Repeat or 2013 Stock Defeat?

Interest rates are moving higher, bond prices are collapsing, and fear regarding a stock market plunge is palpable. Sound like a recent news headline or is this a description of a 1994 financial market story? For those with a foggy, double-decade-old memory, here is a summary of the 1994 economic environment:
- The economy registered its 34th month of expansion and the stock market was on a record 40-month advance
- The Federal Reserve embarked on its multi-hike, rate-tightening monetary policy
- The 10-year Treasury note exhibited an almost 2.5% jump in yields
- Inflation was low with a threat of rising inflation lurking in the background
- An upward sloping yield curve encouraged speculative bond carry-trade activity (borrow short, invest long)
- Globalization and technology sped up the pace of price volatility
Many of these listed items resemble factors experienced today, but bond losses in 1994 were much larger than the losses of 2013 – at least so far. At the time, Fortune magazine called the 1994 bond collapse the worst bond market loss in history, with losses estimated at upwards of $1.5 trillion. The rout started with what might have appeared as a harmless 0.25% increase in the Federal Funds rate (the rate that banks lend to each other) from 3% to 3.25% in February 1994. By the time 1994 came to a close, acting Federal Reserve Chairman Alan Greenspan had jacked up this main monetary tool by 2.5%.
Rising rates may have acted as the flame for bond losses, but extensive use of derivatives and leverage acted as the gasoline. For example, over-extended Eurobond positions bought on margin by famed hedge fund manager Michael Steinhardt of Steinhardt Partners lead to losses of about-30% (or approximately $1.5 billion). Renowned partner of Omega Partners, Leon Cooperman, took a similar beating. Cooperman’s $3 billion fund cratered -24% during the first half of 1994. Insurance company bond portfolios were hit hard too, as collective losses for the industry exceeded $20 billion, or more than the claims paid for Hurricane Andrew’s damage. Let’s not forget the largest casualty of this era – the public collapse of Orange County, California. Poor derivatives trades led to $1.7 billion in losses and ultimately forced the county into bankruptcy.
There are plenty of other examples, but suffice it to say, the pain felt by other bond investors was widespread as a massive number of margin calls caused a snowball of bond liquidations. The speed of the decline was intensified as bond holders began selling short and using derivatives to hedge their portfolios, accelerating price declines.
Just as the accommodative interest rate punch bowl was eventually removed by Greenspan, so too is Ben Bernanke (current Fed Chairman) threatening to do today. Even if Bernanke unleashes a cold-turkey tapering of the $85 billion per month in bond-purchases, massive losses in bond values won’t necessarily mean catastrophe for stock values. For evidence, one needs to look no further than this 1994-1995 chart of the stock market:
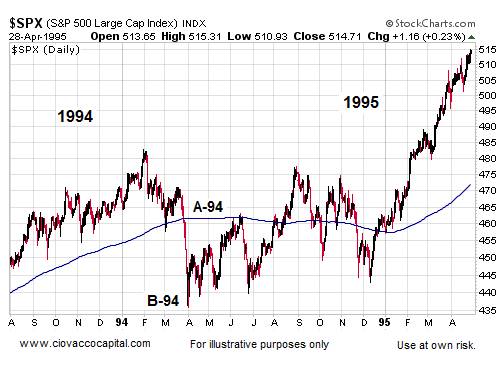
Source: Ciovaccocapital.com
Volatility for stocks definitely increased in 1994 with the S&P 500 index correcting about -10% early in the year. But as you can see, by the end of the year the market was off to the races, tripling in value over the next five years. Volatility has been the norm for the current bull market rally as well. Despite the more than doubling in stock prices since early 2009, we have experienced two -20% corrections and one -10% pullback.
What’s more, the onset of potential tapering is completely consistent with core economic principles. Capitalism is built on free trading markets, not artificial intervention. Extraordinary times required extraordinary measures, but the probabilities of a massive financial Armageddon have been severely diminished. As a result, the unprecedented scale of quantitative easing (QE) will eventually become more harmful than beneficial. The moral of the story is that volatility is always a normal occurrence in the equity markets, therefore any significant stock pullback associated with potential bond tapering (or fed fund rate hikes) shouldn’t be viewed as the end of the world, nor should a temporary weakening in stock prices be viewed as the end to the bull market in stocks.
Why have stocks historically provided higher returns than bonds? The short answer is that stocks are riskier than bonds. The price for these higher long-term returns is volatility, and if investors can’t handle volatility, then they shouldn’t be investing in stocks.
If you are an investor that thinks they can time the market, you wouldn’t be wasting your time reading this article. Rather, you’d be spending time on your personal island while drinking coconut drinks with umbrellas (see Market Timing Treadmill).
Although there are some distinct similarities between the economic backdrop of 1994 and 2013, there are quite a few differences also. For starters, the economy was growing at a much healthier clip then (+4.1% GDP growth), which stoked inflationary fears in the mind of Greenspan. Moreover, unemployment was quite low (5.5% by year-end vs. 7.6% today) and the Fed did not communicate forward looking Fed policy back then.
It’s unclear if the recent 50 basis point ascent in 10-year Treasury rates was just an appetizer for what’s to come, but simple mathematics indicate there is really only one direction left for interest rates to go…higher. If history repeats itself, it will likely be bond investors choking on higher rates (not stock investors). For the sake of optimistic bond speculators, I hope Ben Bernanke knows the Heimlich maneuver. Studying history may help bond bulls avoid indigestion.
Wade W. Slome, CFA, CFP®
Plan. Invest. Prosper.
DISCLOSURE: Sidoxia Capital Management (SCM) and some of its clients hold positions in certain exchange traded funds (ETFs), but at the time of publishing SCM had no direct position in any other security referenced in this article. No information accessed through the Investing Caffeine (IC) website constitutes investment, financial, legal, tax or other advice nor is to be relied on in making an investment or other decision. Please read disclosure language on IC Contact page.
What’s Going on with This Crazy Market?!

The massive rally of the stock market since March 2009 has been perplexing for many, but the state of confusion has reached new heights as the stock market has surged another +2.0% in May, surpassing the Dow 15,000 index milestone and hovering near all-time record highs. Over the last few weeks, the volume of questions and tone of disbelief emanating from my social circles has become deafening. Here are some of the questions and comments I’ve received lately:
“Wade, why in the heck is the market up so much?”; “This market makes absolutely no sense!”; “Why should I buy at the peak when I can buy at the bottom?”; “With all this bad news, when is the stock market going to go down?”; “You must be shorting (betting against) this market, right?”
If all the concerns about the Benghazi tragedy, IRS conservative targeting, and Federal Reserve bond “tapering” are warranted, then it begs the question, “How can the Dow Jones and other indexes be setting new all-time highs?” In short, here are a few reasons:
You hear a lot of noise on TV and read a lot of blathering in newspapers/blogs, but what you don’t hear much about is how corporate profits have about tripled since the year 2000 (see red line in chart above), and how the profit recovery from the recent recession has been the strongest in 55 years (Scott Grannis). The profit collapse during the Great Recession was closely chronicled in nail-biting detail, but a boring profit recovery story sells a lot less media advertising, and therefore gets swept under the rug.
II.) Reasonable Prices (Comparing Apples & Oranges):
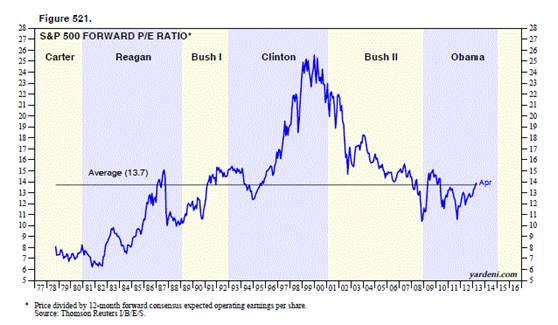
Source: Dr. Ed’s Blog
The Price-Earnings ratio (P/E) is a general barometer of stock price levels, and as you can see from the chart above (Ed Yardeni), current stock price levels are near the historical average of 13.7x – not at frothy levels experienced during the late-1990s and early 2000s.
Comparing Apples & Oranges:

At the most basic level of analysis, investors are like farmers who choose between apples (stocks) and oranges (bonds). On the investment farm, growers are generally going to pick the fruit that generates the largest harvest and provide the best return. Stocks (apples) have historically offered the best prices and yielded the best harvests over longer periods of time, but unfortunately stocks (apples) also have wild swings in annual production compared to the historically steady crop of bonds (oranges). The disastrous apple crop of 2008-2009 led a massive group of farmers to flood into buying a stable supply of oranges (bonds). Unfortunately the price of growing oranges (i.e., buying bonds) has grown to the highest levels in a generation, with crop yields (interest rates) also at a generational low. Even though I strongly believe apples (stocks) currently offer a better long-term profit potential, I continue to remind every farmer (investor) that their own personal situation is unique, and therefore they should not be overly concentrated in either apples (stocks) or oranges (bonds).
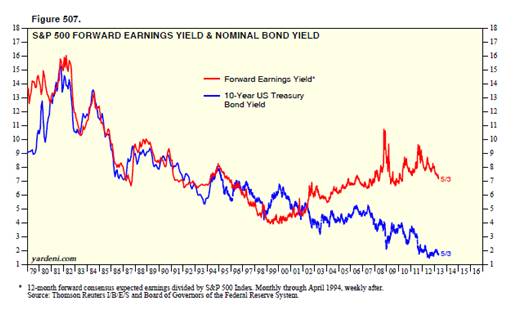
Source: Dr. Ed’s Blog
Regardless, you can see from the chart above (Dr. Ed’s Blog), the red line (stocks) is yielding substantially more than the blue line (bonds) – around 7% vs. 2%. The key for every investor is to discover an optimal balance of apples (stocks) and oranges (bonds) that meets personal objectives and constraints.
III.) Skepticism (Market Climbs a Wall of Worry):

Source: Calafia Beach Pundit
Although corporate profits are strong, and equity prices are reasonably priced, investors have been withdrawing hundreds of billions of dollars from equity funds (negative blue lines in chart above – Calafia Beach Pundit). While the panic of 2008-2009 has been extinguished from average investors’ psyches, the Recession in Europe, slowing growth in China, Washington gridlock, and the fresh memories of the U.S. financial crisis have created a palpable, nervous skepticism. Most recently, investors were bombarded with the mantra of “Selling in May, and Going Away” – so far that advice hasn’t worked so well. To buttress my point about this underlying skepticism, one need not look any further than a recent CNBC segment titled, “The Most Confusing Market Ever” (see video below):
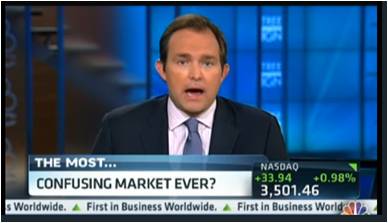
Source: CNBC
It’s clear that investors remain skittish, but as legendary investor Sir John Templeton so aptly stated, “Bull markets are born on pessimism, grow on skepticism, mature on optimism and die on euphoria.” The sentiment pendulum has been swinging in the right direction (see previous Investing Caffeine article), but when money flows sustainably into equities and optimism/euphoria rules the day, then I will become much more fearful.
Being a successful investor or a farmer is a tough job. I’ll stop growing apples when my overly optimistic customers beg for more apples, and yields on oranges also improve. In the meantime, investors need to remember that no matter how confusing the market is, don’t put all your oranges (bonds) or apples (stocks) in one basket (portfolio) because the financial markets do not need to get any crazier than they are already.
Wade W. Slome, CFA, CFP®
Plan. Invest. Prosper.
DISCLOSURE: Sidoxia Capital Management (SCM) and some of its clients hold positions in certain exchange traded funds (ETFs), but at the time of publishing SCM had no direct position in any other security referenced in this article. No information accessed through the Investing Caffeine (IC) website constitutes investment, financial, legal, tax or other advice nor is to be relied on in making an investment or other decision. Please read disclosure language on IC Contact page.


