Posts tagged ‘Stocks’
Investing, Housing, and Speculating

We all know there was a lot of speculation going on in the housing market during 2005-2007 as risk-loving adventurists loaded up on NINJA loans (No Income, No Job, and No Assets) and subprime CDS (Credit Default Swap) securities. But there is a different kind of speculation going on now, and it isn’t tied directly to housing. Instead of buying a house with no down payment and a no interest loan, speculators are leaping into other hazardous areas of danger. Like a frog jumping from lily pad to lily pad, speculators are now hopping around onto money-chasing industries, including biotech, social media, Bitcoin, and alternative energy.
As French novelist Jean-Baptise Alphonse Karr noted, “The more things change, the more they stay the same.” Irrespective of the painful consequences of the bubble-bursting aftermaths, human behavior and psychology addictively succumb to the ever-seductive emotion of greed. Over the last 15 years, massive fortunes have been gained and lost while chasing frothy financial dreams in areas like technology, housing, and gold.
Most get-rich-quick dream chasers have no idea of how to invest in or value a stock, but they sure know a good story when they hear one. Chasing top performing stocks is lot like jumping off a bridge – anyone can do it, and it feels exhilarating until you hit the ground. However, there is a better way to create wealth. Despite rampant speculation, most individuals understand the principles behind buying a house, which if applied to stocks, can make you a superior investor, and assist you in avoiding dangerous, speculative investments.
Here are some valuable housing insights to improve your stock buying:
#1.) Price is the Almighty Variable: Successful real estate investors don’t make their fortunes by chasing properties that double or triple in value. Buying a rusty tool shed for $1 million makes about as much sense as Facebook paying $19 billion (1,000 x’s the estimated 2013 annual revenues) for a money-losing company, WhatsApp. Better to buy real estate when there is blood in the street. Like the stock market, housing is cyclical. Many traders believe that price patterns are more important than the actual price. If squiggly, technical price moving averages (see Technical Analysis article) make so much money for stock-renting speculators, then how come day traders haven’t used their same crossing-lines and Point & Figure software in the housing market? Yes, it’s true that the real estate transactions costs and illiquidity can be costly for real estate buyers, but 6% load fees, lockup periods, 20% hedge fund fees, and 9% margin rates haven’t stopped stock speculators either.
#2). Cash is King: It doesn’t take a genius to purchase a rental property – I know because practically half the people I know in Southern California own rental properties. For example, if I buy a rental property for $1 million cash, is it a good purchase? Well, it depends on how much after-tax cash I can collect by renting it out? If I can only net $3,000 per month (3.6% annualized return), and be responsible for replacing roofs, fixing toilets, and evicting tenants, then perhaps I would be better off by collecting 6.5% from a low-cost, tax-efficient exchange traded real estate fund, without having to suffer from all the headaches that physical real estate investing brings. Forecasting future asset price appreciation is tougher, but the point is, understanding the underlying cash flow dynamics of a company is just as important as it is for housing purchases.
#3). Debt/Leverage Cuts in Both Directions: Adding debt (or leverage) to a housing or stock investment can be fantastic if prices go up, and disastrous if prices go down. Putting a 20% down payment on a $1 million house works out wonderfully, if the price of the house increases to $1.2 million. My $200,000 down payment is now worth $400,000, or up +100%. The same math works in reverse. If the price of the home drops to $800,000, then my $200,000 down payment is now worth $0, or down -100% (ouch). Margin debt on an equity brokerage account works in a similar fashion, but usually a 50% down payment is needed (less risky than real estate). That’s why I always chuckle when many real estate investors tell me they steer clear of stocks because they are “too risky”.
#4). Growth Matters: If you buy a home for $1 million, is it likely to be worth more if you add a kitchen, tennis court, swimming pull, third floor, and putting green? In short, the answer is yes. The same principle applies to stocks. All else equal, if a company based in Los Angeles, establishes new offices in New York, London, Beijing, and Rio de Janeiro, and then acquires a profitable competitor at a discounted price, chances are the company will be much more valuable after the additions. The key concept here is that asset values are not static. Asset valuations are impacted in both directions, whether we are talking about positive growth opportunities or negative disruptions.
Overall, speculatively chasing performance is tempting, but if you don’t want your financial foundation to crumble, then build your successful investment future by sticking to the fundamentals and financial basics.
Wade W. Slome, CFA, CFP®
Plan. Invest. Prosper.
DISCLOSURE: Sidoxia Capital Management (SCM) and some of its clients hold long positions in certain exchange traded funds (ETFs), but at the time of publishing SCM had no direct discretionary position in FB, Bitcoin, or any other security referenced in this article. No information accessed through the Investing Caffeine (IC) website constitutes investment, financial, legal, tax or other advice nor is to be relied on in making an investment or other decision. Please read disclosure language on IC Contact page.
2013 Investing Caffeine Greatest Hits

Source: Photobucket
From the Boston bombings and Detroit’s bankruptcy to Pope Francis and Nelson Mandela, there were many attention grabbing headlines in 2013. Investing Caffeine made its own headlines after 4 1/2 years of blogging, including Sidoxia Capital Management’s media expansion (see Twitter & Media pages).
Thank you to all the readers who inspire me to spew out my random but impassioned thoughts on a somewhat regular basis. Investing Caffeine and Sidoxia Capital Management wish you a healthy, happy, and prosperous New Year in 2014!
Here are some of the most popular Investing Caffeine postings over the year:
10) Confessions of a Bond Hater

9) What’s Going On With This Crazy Market?

8) Information Choking Your Money

7) Beware: El-Erian & Gross Selling Buicks…Not Chevys

6) The Central Bank Dog Ate My Homework

5) Confusing Fear Bubbles with Stock Bubbles

4) Vice Tightens for Those Who Missed the Pre-Party

3) Sitting on the Sidelines: Fear & Selective Memory

2) The Most Hated Bull Market Ever

1) 2014: Here Comes the Dumb Money!

Happy New Year’s!
Wade W. Slome, CFA, CFP®
Plan. Invest. Prosper.
DISCLOSURE: Sidoxia Capital Management (SCM) and some of its clients hold positions in certain exchange traded funds (ETFs), but at the time of publishing SCM had no direct position in any other security referenced in this article. No information accessed through the Investing Caffeine (IC) website constitutes investment, financial, legal, tax or other advice nor is to be relied on in making an investment or other decision. Please read disclosure language on IC Contact page. Special editorial thanks to Lt. Andrew A. Pierce for his contributions on this article.
Stocks Take a Breather after Long Sprint

Like a sprinter running a long sprint, the stock market eventually needs to take a breather too, and that’s exactly what investors experienced this week as they witnessed the Dow Jones Industrial Average face its largest drop of 2013 (down -2.2%) – and also the largest weekly slump since 2012. Runners, like financial markets, sooner or later suffer fatigue, and that’s exactly what we’re seeing after a relatively unabated +27% upsurge over the last nine months. Does a -2% hit in one week feel pleasant? Certainly not, but before the next race, the markets need to catch their breath.
By now, investors should not be surprised that pitfalls and injuries are part of the investment racing game – something Olympian Mary Decker Slaney can attest to as a runner (see 1984 Olympic 3000m final against Zola Budd). As I have pointed out in previous articles (Most Hated Bull Market), the almost tripling in stock prices from the 2009 lows has not been a smooth, uninterrupted path-line, but rather investors have endured two corrections averaging -20% and two other drops approximating -10%. Instead of panicking by locking in damaging transaction costs, taxes, and losses, it is better to focus on earnings, cash flows, valuations, and the relative return available in alternative asset classes. With generationally low interest rates occurring over recent periods, the available subset of attractive investment opportunities has narrowed (see Confessions of a Bond Hater), leaving many investing racers to default to stocks.
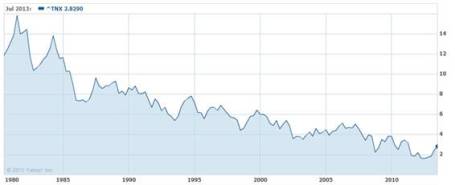
Recent talk of potential Federal Reserve bond purchase “tapering” has led to a two-year low in bond prices and caused a mini spike in interest rates (10-year Treasury note currently yielding +2.83%). At the margin, this trend makes bonds more attractive (lower prices), but as you can see from the chart below, interest rates are still relatively close to historically low yields. For the time being, this still makes domestic equities an attractive asset class.
Source: Yahoo! Finance
Price Follows Earnings
The simple but true axiom that stock prices follow earnings over the long-run is just as true today as it was a century ago. Interest rates and price-earnings ratios can also impact stock prices. To illustrate my argument, let’s talk baseball. Wind, rain, and muscle (interest rates, PE ratios, political risk, etc.) are factors impacting the direction of a thrown baseball (stock prices), but gravity is the key factor influencing the ultimate destination of the baseball. Long-term earnings growth is the equivalent factor to gravity when talking about stock prices.
To buttress my point that stock prices following long-term earnings, consider the fact that S&P 500 annualized operating earnings bottomed in 2009 at $39.61. Since that point, annualized earnings through the second quarter of 2013 (~94% of companies reported results) have reached $99.30, up +151%. S&P 500 stock prices bottomed at 666 in 2009, and today the index sits at 1655, +148%. OK, so earnings are up +151% and stock prices are up +148%. Coincidence? Perhaps not.
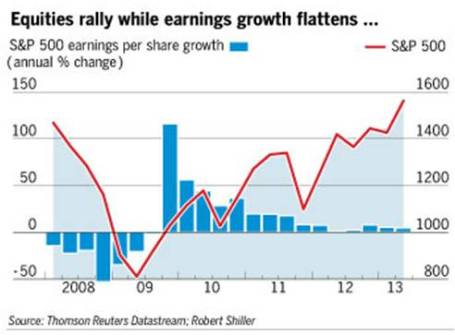
If we take a closer look at earnings, the deceleration of earnings growth is unmistakable (see Financial Times chart below), yet the S&P 500 index is still up +16% this year, excluding dividends. In reality, predicting multiple expansion or contraction is nearly impossible. For example, earnings in the S&P 500 grew an incredible +15% in 2011, yet stock prices were anemically flat for that year, showing no price appreciation (+0.0%). Since the end of 2011, earnings have risen a meager +3%, however stock prices have catapulted +32%. Is this multiple expansion sustainable? Given stock P/E ratios remain in a reasonable 15-16x range, according to forward and trailing earnings, there is some room for expansion, but the low hanging fruit has been picked and further double-digit price appreciation will require additional earnings growth.
Source: Financial Times
But stocks should not be solely looked through a domestic lens…there is another 95% of the world’s population slowly embracing capitalism and democracy to fuel future dynamic earnings growth. At Sidoxia (www.Sidoxia.com), we are finding plenty of opportunities outside our U.S. borders, including alternative asset classes.
The investment race continues, and taking breathers is part of the competition, especially after long sprints. Rather than panic, enjoy the respite.
Wade W. Slome, CFA, CFP®
Plan. Invest. Prosper.
DISCLOSURE: Sidoxia Capital Management (SCM) and some of its clients hold positions in certain exchange traded funds (ETFs), but at the time of publishing, SCM had no direct position in any other security referenced in this article. No information accessed through the Investing Caffeine (IC) website constitutes investment, financial, legal, tax or other advice nor is to be relied on in making an investment or other decision. Please read disclosure language on IC Contact page.
1994 Bond Repeat or 2013 Stock Defeat?

Interest rates are moving higher, bond prices are collapsing, and fear regarding a stock market plunge is palpable. Sound like a recent news headline or is this a description of a 1994 financial market story? For those with a foggy, double-decade-old memory, here is a summary of the 1994 economic environment:
- The economy registered its 34th month of expansion and the stock market was on a record 40-month advance
- The Federal Reserve embarked on its multi-hike, rate-tightening monetary policy
- The 10-year Treasury note exhibited an almost 2.5% jump in yields
- Inflation was low with a threat of rising inflation lurking in the background
- An upward sloping yield curve encouraged speculative bond carry-trade activity (borrow short, invest long)
- Globalization and technology sped up the pace of price volatility
Many of these listed items resemble factors experienced today, but bond losses in 1994 were much larger than the losses of 2013 – at least so far. At the time, Fortune magazine called the 1994 bond collapse the worst bond market loss in history, with losses estimated at upwards of $1.5 trillion. The rout started with what might have appeared as a harmless 0.25% increase in the Federal Funds rate (the rate that banks lend to each other) from 3% to 3.25% in February 1994. By the time 1994 came to a close, acting Federal Reserve Chairman Alan Greenspan had jacked up this main monetary tool by 2.5%.
Rising rates may have acted as the flame for bond losses, but extensive use of derivatives and leverage acted as the gasoline. For example, over-extended Eurobond positions bought on margin by famed hedge fund manager Michael Steinhardt of Steinhardt Partners lead to losses of about-30% (or approximately $1.5 billion). Renowned partner of Omega Partners, Leon Cooperman, took a similar beating. Cooperman’s $3 billion fund cratered -24% during the first half of 1994. Insurance company bond portfolios were hit hard too, as collective losses for the industry exceeded $20 billion, or more than the claims paid for Hurricane Andrew’s damage. Let’s not forget the largest casualty of this era – the public collapse of Orange County, California. Poor derivatives trades led to $1.7 billion in losses and ultimately forced the county into bankruptcy.
There are plenty of other examples, but suffice it to say, the pain felt by other bond investors was widespread as a massive number of margin calls caused a snowball of bond liquidations. The speed of the decline was intensified as bond holders began selling short and using derivatives to hedge their portfolios, accelerating price declines.
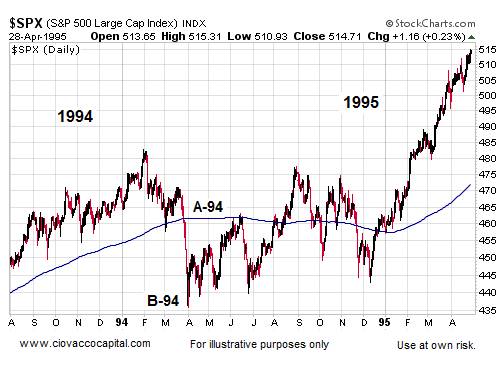
Just as the accommodative interest rate punch bowl was eventually removed by Greenspan, so too is Ben Bernanke (current Fed Chairman) threatening to do today. Even if Bernanke unleashes a cold-turkey tapering of the $85 billion per month in bond-purchases, massive losses in bond values won’t necessarily mean catastrophe for stock values. For evidence, one needs to look no further than this 1994-1995 chart of the stock market:
Source: Ciovaccocapital.com
Volatility for stocks definitely increased in 1994 with the S&P 500 index correcting about -10% early in the year. But as you can see, by the end of the year the market was off to the races, tripling in value over the next five years. Volatility has been the norm for the current bull market rally as well. Despite the more than doubling in stock prices since early 2009, we have experienced two -20% corrections and one -10% pullback.
What’s more, the onset of potential tapering is completely consistent with core economic principles. Capitalism is built on free trading markets, not artificial intervention. Extraordinary times required extraordinary measures, but the probabilities of a massive financial Armageddon have been severely diminished. As a result, the unprecedented scale of quantitative easing (QE) will eventually become more harmful than beneficial. The moral of the story is that volatility is always a normal occurrence in the equity markets, therefore any significant stock pullback associated with potential bond tapering (or fed fund rate hikes) shouldn’t be viewed as the end of the world, nor should a temporary weakening in stock prices be viewed as the end to the bull market in stocks.
Why have stocks historically provided higher returns than bonds? The short answer is that stocks are riskier than bonds. The price for these higher long-term returns is volatility, and if investors can’t handle volatility, then they shouldn’t be investing in stocks.
If you are an investor that thinks they can time the market, you wouldn’t be wasting your time reading this article. Rather, you’d be spending time on your personal island while drinking coconut drinks with umbrellas (see Market Timing Treadmill).
Although there are some distinct similarities between the economic backdrop of 1994 and 2013, there are quite a few differences also. For starters, the economy was growing at a much healthier clip then (+4.1% GDP growth), which stoked inflationary fears in the mind of Greenspan. Moreover, unemployment was quite low (5.5% by year-end vs. 7.6% today) and the Fed did not communicate forward looking Fed policy back then.
It’s unclear if the recent 50 basis point ascent in 10-year Treasury rates was just an appetizer for what’s to come, but simple mathematics indicate there is really only one direction left for interest rates to go…higher. If history repeats itself, it will likely be bond investors choking on higher rates (not stock investors). For the sake of optimistic bond speculators, I hope Ben Bernanke knows the Heimlich maneuver. Studying history may help bond bulls avoid indigestion.
Wade W. Slome, CFA, CFP®
Plan. Invest. Prosper.
DISCLOSURE: Sidoxia Capital Management (SCM) and some of its clients hold positions in certain exchange traded funds (ETFs), but at the time of publishing SCM had no direct position in any other security referenced in this article. No information accessed through the Investing Caffeine (IC) website constitutes investment, financial, legal, tax or other advice nor is to be relied on in making an investment or other decision. Please read disclosure language on IC Contact page.
What’s Going on with This Crazy Market?!

The massive rally of the stock market since March 2009 has been perplexing for many, but the state of confusion has reached new heights as the stock market has surged another +2.0% in May, surpassing the Dow 15,000 index milestone and hovering near all-time record highs. Over the last few weeks, the volume of questions and tone of disbelief emanating from my social circles has become deafening. Here are some of the questions and comments I’ve received lately:
“Wade, why in the heck is the market up so much?”; “This market makes absolutely no sense!”; “Why should I buy at the peak when I can buy at the bottom?”; “With all this bad news, when is the stock market going to go down?”; “You must be shorting (betting against) this market, right?”
If all the concerns about the Benghazi tragedy, IRS conservative targeting, and Federal Reserve bond “tapering” are warranted, then it begs the question, “How can the Dow Jones and other indexes be setting new all-time highs?” In short, here are a few reasons:
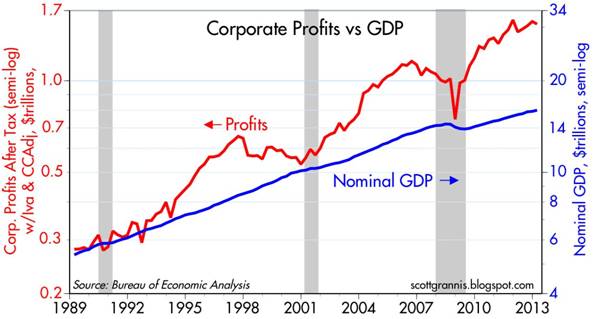
You hear a lot of noise on TV and read a lot of blathering in newspapers/blogs, but what you don’t hear much about is how corporate profits have about tripled since the year 2000 (see red line in chart above), and how the profit recovery from the recent recession has been the strongest in 55 years (Scott Grannis). The profit collapse during the Great Recession was closely chronicled in nail-biting detail, but a boring profit recovery story sells a lot less media advertising, and therefore gets swept under the rug.
II.) Reasonable Prices (Comparing Apples & Oranges):
Source: Dr. Ed’s Blog
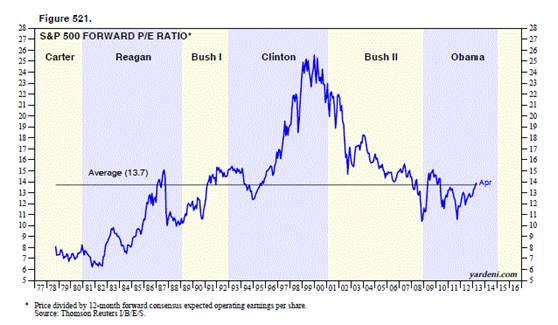
The Price-Earnings ratio (P/E) is a general barometer of stock price levels, and as you can see from the chart above (Ed Yardeni), current stock price levels are near the historical average of 13.7x – not at frothy levels experienced during the late-1990s and early 2000s.
Comparing Apples & Oranges:

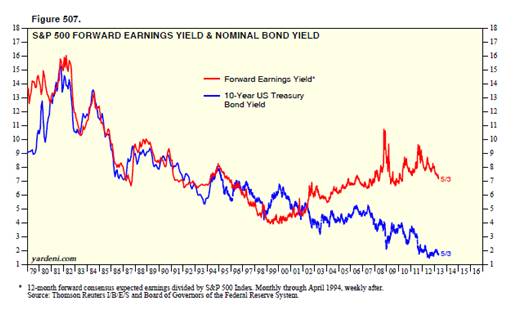
At the most basic level of analysis, investors are like farmers who choose between apples (stocks) and oranges (bonds). On the investment farm, growers are generally going to pick the fruit that generates the largest harvest and provide the best return. Stocks (apples) have historically offered the best prices and yielded the best harvests over longer periods of time, but unfortunately stocks (apples) also have wild swings in annual production compared to the historically steady crop of bonds (oranges). The disastrous apple crop of 2008-2009 led a massive group of farmers to flood into buying a stable supply of oranges (bonds). Unfortunately the price of growing oranges (i.e., buying bonds) has grown to the highest levels in a generation, with crop yields (interest rates) also at a generational low. Even though I strongly believe apples (stocks) currently offer a better long-term profit potential, I continue to remind every farmer (investor) that their own personal situation is unique, and therefore they should not be overly concentrated in either apples (stocks) or oranges (bonds).
Source: Dr. Ed’s Blog
Regardless, you can see from the chart above (Dr. Ed’s Blog), the red line (stocks) is yielding substantially more than the blue line (bonds) – around 7% vs. 2%. The key for every investor is to discover an optimal balance of apples (stocks) and oranges (bonds) that meets personal objectives and constraints.
III.) Skepticism (Market Climbs a Wall of Worry):

Source: Calafia Beach Pundit
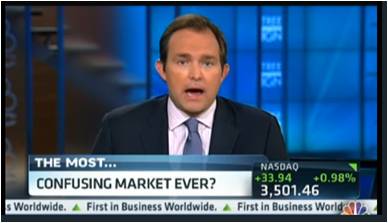
Although corporate profits are strong, and equity prices are reasonably priced, investors have been withdrawing hundreds of billions of dollars from equity funds (negative blue lines in chart above – Calafia Beach Pundit). While the panic of 2008-2009 has been extinguished from average investors’ psyches, the Recession in Europe, slowing growth in China, Washington gridlock, and the fresh memories of the U.S. financial crisis have created a palpable, nervous skepticism. Most recently, investors were bombarded with the mantra of “Selling in May, and Going Away” – so far that advice hasn’t worked so well. To buttress my point about this underlying skepticism, one need not look any further than a recent CNBC segment titled, “The Most Confusing Market Ever” (see video below):
Source: CNBC
It’s clear that investors remain skittish, but as legendary investor Sir John Templeton so aptly stated, “Bull markets are born on pessimism, grow on skepticism, mature on optimism and die on euphoria.” The sentiment pendulum has been swinging in the right direction (see previous Investing Caffeine article), but when money flows sustainably into equities and optimism/euphoria rules the day, then I will become much more fearful.
Being a successful investor or a farmer is a tough job. I’ll stop growing apples when my overly optimistic customers beg for more apples, and yields on oranges also improve. In the meantime, investors need to remember that no matter how confusing the market is, don’t put all your oranges (bonds) or apples (stocks) in one basket (portfolio) because the financial markets do not need to get any crazier than they are already.
Wade W. Slome, CFA, CFP®
Plan. Invest. Prosper.
DISCLOSURE: Sidoxia Capital Management (SCM) and some of its clients hold positions in certain exchange traded funds (ETFs), but at the time of publishing SCM had no direct position in any other security referenced in this article. No information accessed through the Investing Caffeine (IC) website constitutes investment, financial, legal, tax or other advice nor is to be relied on in making an investment or other decision. Please read disclosure language on IC Contact page.
Damned if You Do, and More Damned if You Don’t

Source: Photobucket
In the stock market you are damned if you do, and more damned if you don’t.
There are a million reasons why the market should or can go down, and the press, media, and bears come out with creative explanations every day. The “Flash Crash,” debt ceiling debate, credit downgrades, elections, and fiscal cliff were all credible events supposed to permanently crater the market. Now we have higher taxes (capital gains, income, and payroll), sequester spending cuts, and a nagging recession in Europe. What’s more, the pessimists point to the unsustainable nature of elevated corporate profit margins, and use the ludicrous Robert Shiller 10-year Price-Earnings ratio as evidence of an expensive market (see also Foggy Rearview Mirror). If an apple sold for $10 ten days ago and $0.50 today, would you say, I am not buying an apple today because the 10-day average price is too high? If you followed Robert Shiller’s thinking, this logic would make sense.
Despite the barrage of daily concerns and excuses, the market continues to set new record highs and the S&P 500 is up by more than +130% since the 2009 lows – just a tad higher than the returns earned on cash, gold, and bonds (please note sarcasm). Cash has trickled into equities for the first few months of 2013 after years of outflows, but average investors have only moved from fear to skepticism (see also Investing with the Sentiment Pendulum ). With cash and bonds earning next to nothing; gold underperforming for years; and inflationary pressures eroding long-term purchasing power, the vice is only squeezing tighter on the worrywarts.
Are there legitimate reasons to worry? Certainly, and the opportunities are not what they used to be a few years ago (see also Missing the Pre-Party). Although an endangered species, long-term investors understand backwards looking economic news is useless. Or as Peter Lynch wisely stated, “If you spend 13 minutes a year on economics, you’ve wasted 10 minutes.” The fact remains that the market is up 70% of the time, on an annual basis, and has been a great place to beat inflation over time. It’s a tempting endeavor to avoid the down markets that occur 30% of the time, but those who try to time the market fail miserably over the long-run (see also Market Timing Treadmill).
Equity investors would be better served by looking at their investment portfolios like real estate. Homeowners implicitly know the value of their home changes on a daily basis, but there are no accurate, real-time quotes to reference your home value on a minute by minute basis, as you can with stocks. Most property owners know that real estate is a cyclical asset class that is not impacted by daily headlines, and if purchased at a reasonable price, will generally go up in value over many years. Unfortunately, for many average investors, equity portfolios are treated more like gambling bets in Vegas, and get continually traded based on gut instincts.
Volatility is at six-year lows, and investors are getting less uncomfortable with owning stocks. Although everybody and their mother has been waiting for a pullback (myself included), don’t get too myopically focused. For the vast majority of investors, who should have more than a ten year time horizon, you should understand that volatility is normal and recessions will cause stocks to gown significantly, twice every ten years on average. If you are a long-term investor, like you should be, and you understand these dynamics, then you will also understand that you will be more damned if you don’t invest in equities as part of a diversified portfolio.
Wade W. Slome, CFA, CFP®
Plan. Invest. Prosper.
DISCLOSURE: Sidoxia Capital Management (SCM) and some of its clients hold positions in certain exchange traded funds (ETFs), but at the time of publishing SCM had no direct position in any other security referenced in this article. No information accessed through the Investing Caffeine (IC) website constitutes investment, financial, legal, tax or other advice nor is to be relied on in making an investment or other decision. Please read disclosure language on IC Contact page.
Fence-Sitting: The Elusive Art of More Data and Pullbacks

The world of financial markets is full of fence-sitters, especially in the professional realm. Why? Well, for starters, fence-sitting provides the luxury of never being wrong. If fence-squatting observers do nothing and provide no opinions, then they cannot by definition be wrong or mistaken. Why should a professional put their neck out for an economic, sector, or investment specific forecast, if there is a potential of looking stupid or losing a job?
For many, the consequences of possibly being wrong feel so horrendous that participants choose instead to sit on the non-committal fence. In most cases, the fence posts on any financial issue or investment align along the comfort of consensus thinking. Unfortunately, consensus thinking has a limited shelf life, because the views held by the majority are constantly changing. Repeatedly modifying personal opinions to match consensus views may prevent the bruising of egos, however, this naïve strategy can be destructive to long-term returns. Here are a few examples:
2000
Consensus View: New Normal tech stocks will continue explosive growth; Consensus Outcome: Wrong; Investor Net Result: Losses and/or Lost Profits.
2006
Consensus View: Home prices will rise forever and leverage is beautiful; Consensus Outcome: Wrong; Investor Net Result: Losses and/or Lost Profits.
2010
Consensus View: Greece and European collapse to cause a double-dip global recession; Consensus Outcome: Wrong; Investor Net Result: Losses and/or Lost Profits.
2011
Consensus View: U.S. credit downgrade will be bad for Treasuries and rates; Consensus Outcome: Wrong; Investor Net Result: Losses and/or Lost Profits.
2012
Consensus View: Uncertainty surrounding election bad for equities; Consensus Outcome: Wrong; Investor Net Result: Losses and/or Lost Profits.
2012
Consensus View: China’s slowing growth and real estate bubble expected to cause a global double-dip recession; Consensus Outcome: Wrong; Investor Net Result: Losses and/or Lost Profits.
2012
Consensus View: Impending fiscal cliff bad for equities; Consensus Outcome: Wrong; Investor Net Result: Losses and/or Lost Profits.
2013
Consensus View: Debt ceiling debate bad for equities; Consensus Outcome: ???; Investor Net Result: ???.
2013
Consensus View: Looming sequestration bad for equities; Consensus Outcome: ???; Investor Net Result: ???.
In recent years the market has continued to climb a wall of worry, but will this year be different? We shall soon see.
Placing the concern du jour aside, if consensus fears coalesce around a specific upcoming event, chances are that particular issue is already factored into existing expectations and price structures. Therefore, rather than wasting personal “worry” bandwidth on those fears, investor anxiety should be dedicated to less prevalent but potentially more impactful unknown concerns. Or if you need clarification about the unknowns to worry about, perhaps Donald Rumsfeld can clarify the situation by highlighting the risk of “unknown unknowns”:
I Love Data and Pullbacks!
When faced with apprehension or uncertainty, many fence-sitting investors revert to wanting more data or waiting for a better price. For example, I often hear, “I love stock XYZ, but I want to wait for the earnings to come out,” or analyst day, or share buyback announcement, or merger closing, or restructuring, etc., etc., etc. For strategists and economists, they are famished for the next critically irrelevant weekly jobless claims number, Federal Reserve policy minutes, ISM monthly manufacturing data, or latest consumer confidence figure.
More data for fence sitters is not sufficient. I often listen to stock-pickers say, “I love XYZ stock, but not at the current $52.50 price, but I’ll back up the truck at $51.50!” Okay, so you’re telling me that you think the stock is worth +40% more, but you want to litigate the purchase price over $1?!
Sadly, there is a cost for all this fence-sitting: a) if good news comes out, investment prices catapult higher and the investor is stuck with a pricier investment; b) if bad news comes out, that long-awaited price pullback is usually not acted upon because fundamentals have now deteriorated; or c) in many cases the price grinds higher before the long-awaited jewel of information is disseminated. The net result is further fence-sitting paralysis, which paradoxically is not helped by more information or a price pullback.
The other reason fence-sitters say or do nothing is because articulating a gloomy thesis simply sounds smarter. For instance, saying “The reason I’m on the sidelines is because we are in a secular bear market due to the debasement of our currency as a result of inflationary Fed monetary policies,” sounds smarter and more compelling than “Stocks are cheap and are already factoring in a lot of negativity.”
Investing is an unbelievably challenging endeavor, but for those fence-sitters with an insatiable appetite for more data and elusive pullbacks, I humbly point out, there is an infinite amount of information that regenerates itself daily. In addition, there is nothing wrong with having a disciplined valuation process in place, but if your best investment ideas are predicated on a minor pullback, then enjoy watching your returns wither away…as you sit on your cozy fence.
Wade W. Slome, CFA, CFP®
Plan. Invest. Prosper.
DISCLOSURE: Sidoxia Capital Management (SCM) and some of its clients hold positions in certain exchange traded funds (ETFs), but at the time of publishing SCM had no direct position in any security referenced in this article. No information accessed through the Investing Caffeine (IC) website constitutes investment, financial, legal, tax or other advice nor is to be relied on in making an investment or other decision. Please read disclosure language on IC Contact page.
Equity Quicksand or Bond Cliff?

The markets are rigged, the Knight Capital Group (KCG) robots are going wild, and the cheating bankers are manipulating Libor. I guess you might as well pack it in…right? Well, maybe not. While mayhem continues, equity markets stubbornly grind higher. As we stand here today, the S&P 500 is up approximately +12% in 2012 and the NASDAQ market index has gained about +16%? Not bad when you consider 15 countries are offering negative yields on their bonds…that’s right, investors are paying to lose money by holding pieces of paper until maturity. As crazy as buying technology companies in the late 1990s for 100x’s or 200x’s earnings sounds today, just think how absurd negative yields will sound a decade from now? For heaven’s sake, buying a gun and stuffing money under the mattress is a cheaper savings proposition.
Priced In, Or Not Priced In, That is the Question?
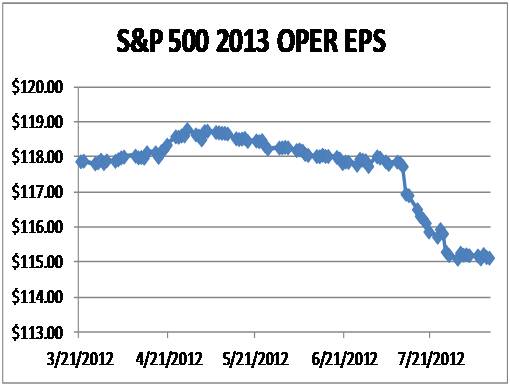
So how can stocks be up in double digit percentage terms when we face an uncertain U.S. presidential election, a fiscal cliff, unsustainable borrowing costs in Spain, and S&P 500 earnings forecasts that are sinking like a buried hiker in quicksand (see chart below)?
I guess the answer to this question really depends on whether you believe all the negative news announced thus far is already priced into the stock market’s below average price-earnings (P/E) ratio of about 12x’s 2013 earnings. Or as investor Bill Miller so aptly puts it, “The question is not whether there are problems. There are always problems. The question is whether those problems are already fully discounted or not.”
Source: Crossing Wall Street
While investors skeptically debate how much bad news is already priced into stock prices, as evidenced by Bill Gross’s provocative “The Cult of Equity is Dying” article, you hear a lot less about the nosebleed prices of bonds. It’s fairly evident, at least to me, that we are quickly approaching the bond cliff. Is it possible that we can be entering a multi-decade, near-zero, Japan-like scenario? Sure, it’s possible, and I can’t refute the possibility of this extreme bear argument. However with global printing presses and monetary stimulus programs moving full steam ahead, I find it hard to believe that inflation will not eventually rear its ugly head.
Again, if playing the odds is the name of the game, then I think equities will be a better inflation hedge than most bonds. Certainly, not all retirees and 1%-ers should go hog-wild on equities, but the bond binging over the last four years has been incredible (see bond fund flows).
While we may sink a little lower into the equity quicksand while the European financial saga continues, and trader sentiment gains complacency (Volatility Index around 15), I’ll choose this fate over the inevitable bond cliff.
Wade W. Slome, CFA, CFP®
Plan. Invest. Prosper.
DISCLOSURE: Sidoxia Capital Management (SCM) and some of its clients own certain exchange traded funds, but at the time of publishing SCM had no direct position in KCG or any other security referenced in this article. No information accessed through the Investing Caffeine (IC) website constitutes investment, financial, legal, tax or other advice nor is to be relied on in making an investment or other decision. Please read disclosure language on IC “Contact” page.
Digesting the Anchovy Pizza Market

Source: Photobucket
Article is an excerpt from previously released Sidoxia Capital Management’s complementary July 2012 newsletter. Subscribe on right side of page.
I love pizza, and most fellow connoisseurs have difficulty refusing a hot, fresh slice of heaven too. Pizza is so universally appreciated that people consider pizza like ice cream – it’s good even when it’s bad (I agree). However, even the biggest, diehard pizza-lover will sheepishly admit their fondness for the flat and circular cheesy delight changes when you integrate anchovies into the mix. Not many people enjoy salty, slimy, marine creatures layered onto their doughy mozzarella and marinara pizza paradise.
With all the turmoil and uncertainty going on in the global financial markets, prudently investing in a widely diversified portfolio, including a broad range of equity securities, is viewed as palatable as participating in an all-you-can-eat anchovy pizza contest. Why are investors’ appetites so salty now? Hmmm, let me think. Oh yes, here are a few things that come to mind:
- Presidential Election Uncertainty
- European Financial Crisis
- Impending Fiscal Cliff (tax cut expirations, automatic spending cuts, termination of stimulus, etc.)
- Unsustainable Fiscal Debt & Deficits
- Slowing Subpar Domestic Economic Growth
- Partisan Politics and Gridlock in Washington
- High Unemployment
- Fears of a Hard Economic Landing in China
Doesn’t sound too appealing, does it? So, what are most investors doing in this unclear market? Rather than feasting on a pungent pie of anchovies, investors are flocking to the perceived safety of low yielding asset classes, no matter the price. In other words, the short-term warmth and comfort of CDs, money market, checking, and fixed income assets are being gobbled up like nicotine-laced pepperoni pizzas selling for $29.95/each + tax. The anchovy alternative, like stocks, is much more attractively priced now. After accounting for dividends, earnings, and cash flows, the anchovy/stock option is currently offering a 2-for-1 special with breadsticks and a salad…quite the bargain!
Nonetheless, the plain and expensive pepperoni/bond option remains the choice du jour and there are no immediate signs of a pepperoni hangover just quite yet. However, this risk aversion addiction cannot last forever. The bond gorging buffet has gone on relatively unabated for the last three decades, as you can see from the chart below. In spite of this, the bond binging game is quickly approaching a mathematical terminal end-game, as interest rates cannot logically go below zero.
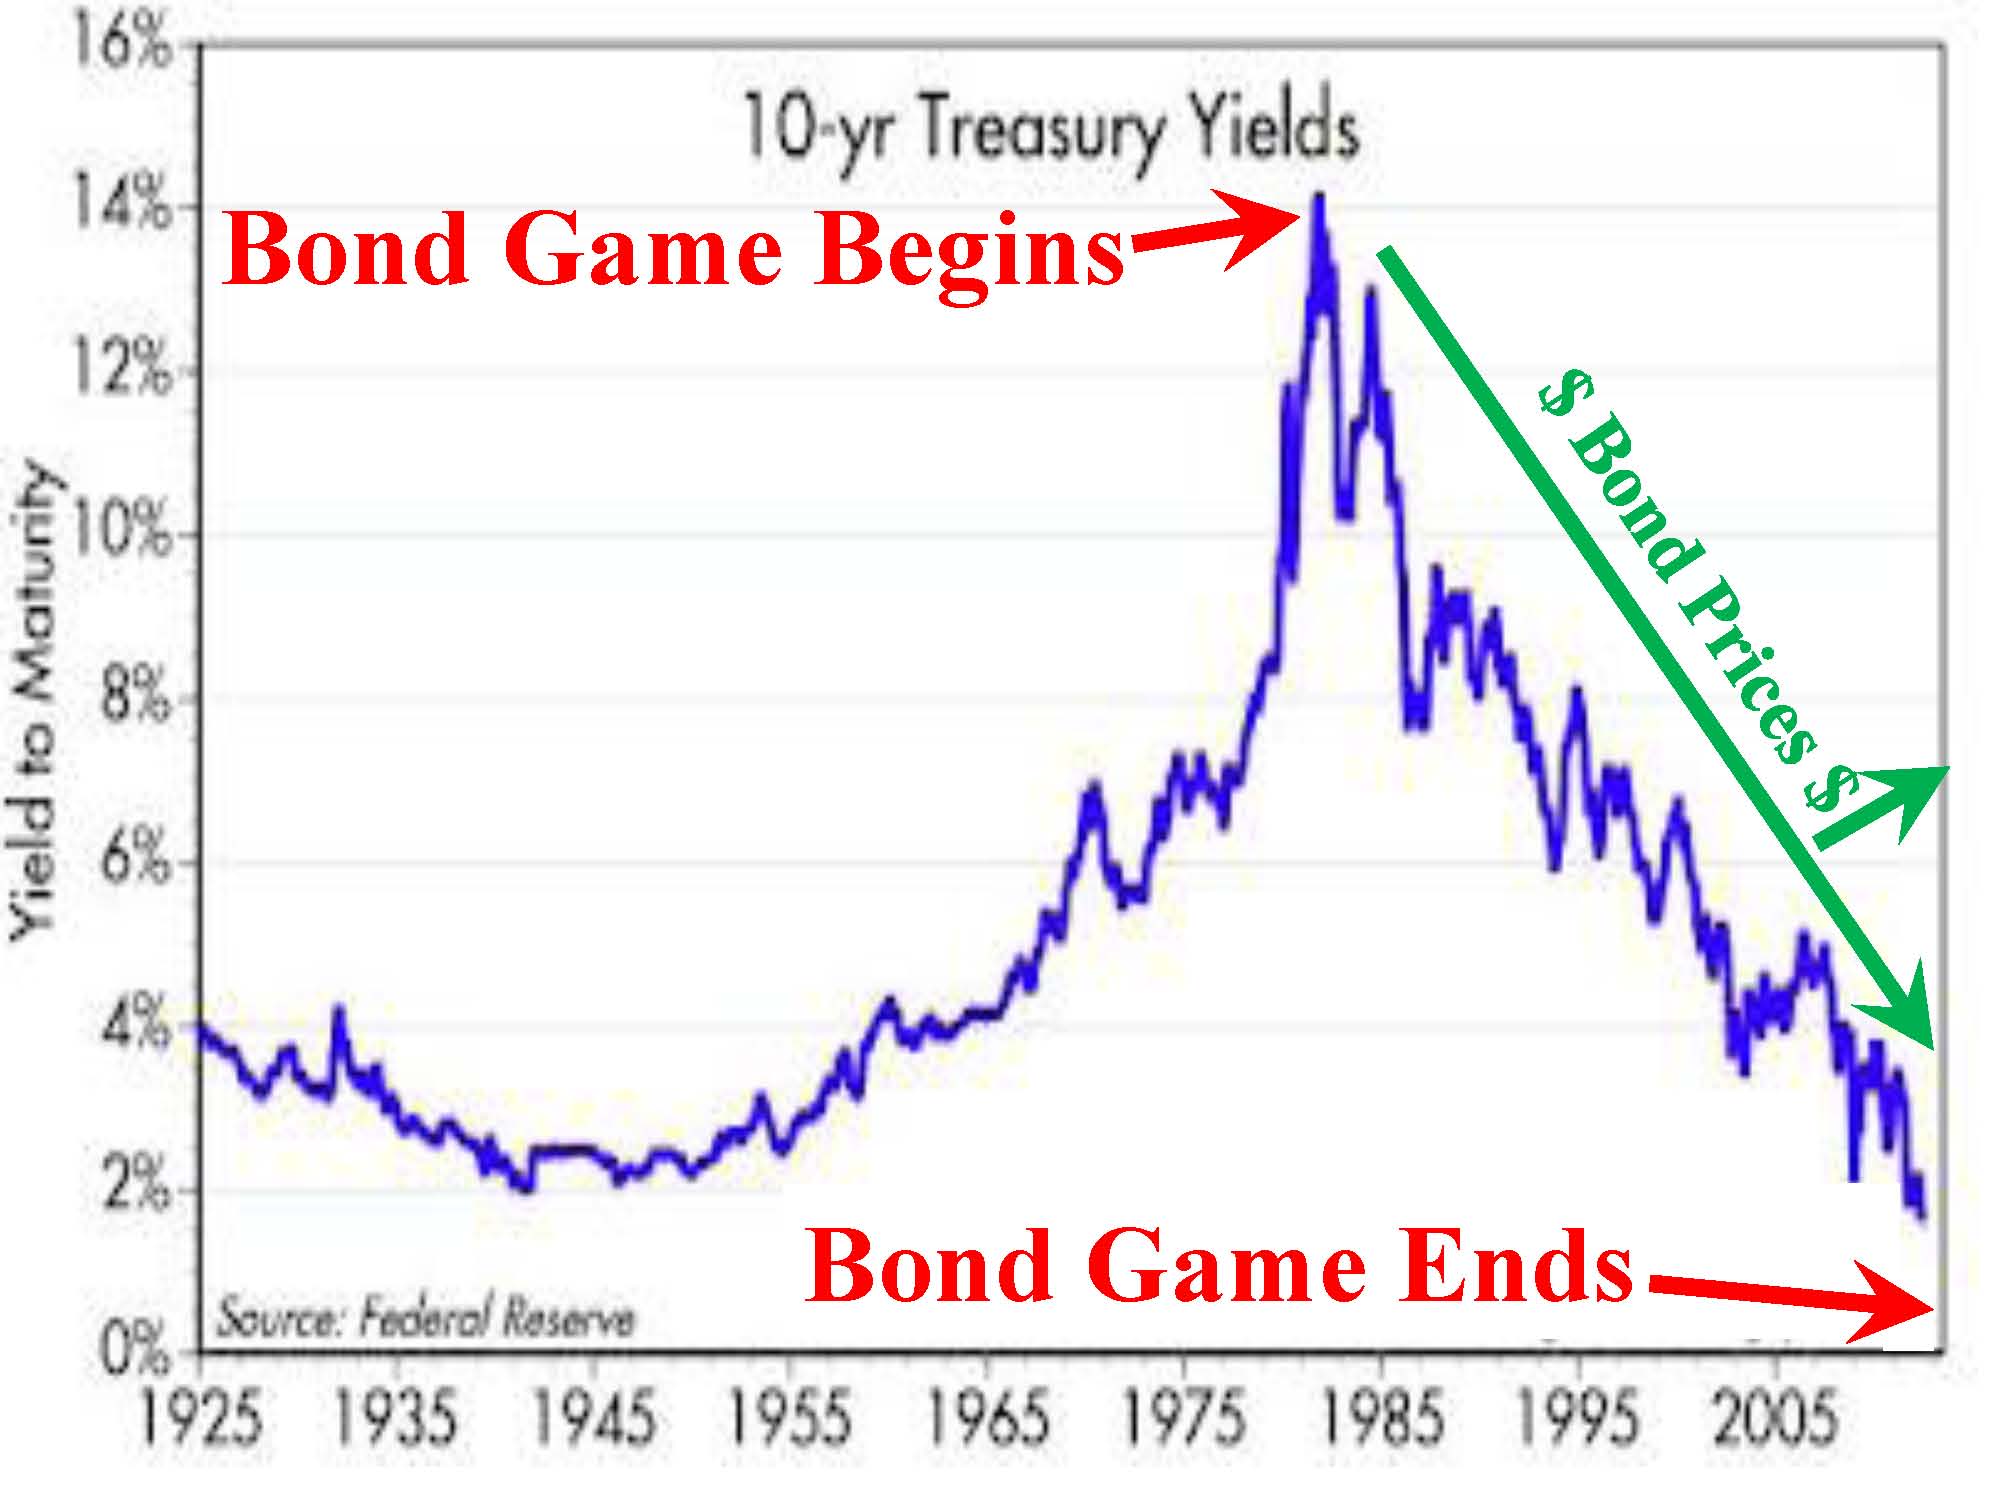
Source: Calafia Beach Pundit with Sidoxia comments
Since my firm (Sidoxia Capital Management) is based in Newport Beach, next to PIMCO’s global headquarters, we get to follow the progression of the bond binging game firsthand. I’ve personally learned that if I manage close to $2 trillion in assets under management, I too can construct a 23-story Taj Mahal-esque headquarters that overlooks the Pacific Ocean from a stones-throw away.
Beyond glorified headquarters, there is evidence of other low-risk appetite examples. Here are some reinforcing pictures:
The Bond Binge

Source (The Financial Times): Bond purchases have exploded in the last three years.
Cash Hoarding
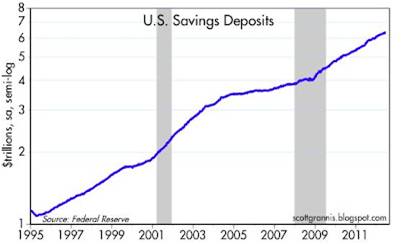
Source (Calafia Beach Pundit): Stuffing money under the mattress has accelerated in recent years as fear, uncertainty, and doubt have reigned supreme.
The Anchovy Special
Even though anchovy pizza, or a broadly diversified portfolio across asset class, size, geography, and style may not sound appealing, there are plenty of reasons to fight the urges of caving to fear and skepticism. Here are a few:
1) Growth Rolls On: Despite the aforementioned challenges occurring domestically and abroad, growth has continued unabated for 11 consecutive quarters, albeit at a rate less than desired. We are not immune to global recessionary forces, but regardless of European forces, the U.S. has been resilient in its expansion.

Source: Calafia Beach Pundit
2) Jobs and Housing on the Upswing: Unemployment remains high, but our country has experienced 27 consecutive months of private creation, leading to more than 4 million new jobs being added to our workforce. As you can see from the clear longer-term downward trend in unemployment claims, we are moving in the right direction.
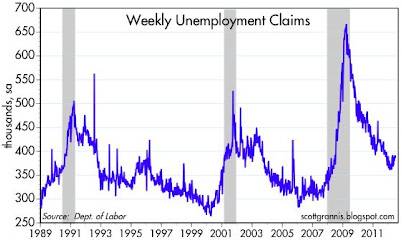
Source: Calafia Beach Pundit
3) Eurozone Slowly Healing its Wounds: The Greek political and fiscal soap opera is grabbing all the headlines, but quietly in the background there are signs that the eurozone is slowly healing the wounds of the financial crisis. If you look at the 2-year borrowing costs of Europe’s troubled countries (ex-Greece), there is an unambiguous and beneficial decline. There is no doubt that Spain and Italy play a larger role than Portugal and Ireland, but at least some seeds of change have been planted for optimism.

Source: Calafia Beach Pundit
4) Record Corporate Profits: Investors are not the only people reading uncertain newspaper headlines and watching CNBC business television. CEOs are reading the same gloomy sensationalistic stories, and as a result, corporations have been cautious about dipping their short arms into their deep pockets. Significant expense reductions and a reluctance to hire have led to record profits and cash hoards. As evidenced by the chart below, profits continue to rise, and these earnings are being applied to shareholder friendly uses like dividends, share buybacks, and accretive acquisitions.

Source: Yardeni.com
5) Attractive Valuations (Pricing): We have already explored the lofty prices surrounding bonds and $30 pepperoni pizzas, but counter-intuitively, stock prices are trading at a discount to historical norms, despite record low interest rates. All else equal, an investor should pay higher prices for stocks when interest rates are at a record low (and vice versa), but currently we are seeing the opposite dynamic occur.

Source: Calafia Beach Pundit
Even though the financial markets may look, smell, and taste like an anchovy pizza, the price, value, and return benefits may outweigh the fishy odor. And guess what…anchovies are versatile. If you don’t like them on your pizza, you can always take them off and put them on your Caesar salad or use them for bait the next time you go fishing. The gloom-filled headlines haven’t been spectacular, but if they were, the return opportunities would be drastically reduced. Therefore you are much better off by following investor legend Warren Buffett’s advice, which is to “buy fear and sell greed.”
Investing has never been more difficult with record low interest rates, and it has also never been more important. Excluding a small minority of late retirees and wealthy individuals, efficiently investing your retirement dollars has become even more critical. The safety nets of Social Security and Medicare are likely to be crippled, which will require better and more prudent investing by individuals. Inflation relating to food, energy, healthcare, gasoline, and entertainment is dramatically eroding peoples’ nest eggs.
Digesting a pepperoni pizza may sound like the most popular and best option given the gloomy headlines and uncertain outlook, but if you do not want financial heartburn you may consider alternative choices. Like the healthier and less loved anchovy pizza, a more attractively valued strategy based on a broadly diversified portfolio across asset class, size, geography, and style may be the best financial choice to satiate your long-term financial goals.
Wade W. Slome, CFA, CFP®
Plan. Invest. Prosper.
DISCLOSURE: Sidoxia Capital Management (SCM) and some of its clients own certain exchange traded funds, but at the time of publishing SCM had no direct position in any other security referenced in this article. No information accessed through the Investing Caffeine (IC) website constitutes investment, financial, legal, tax or other advice nor is to be relied on in making an investment or other decision. Please read disclosure language on IC “Contact” page.
Cash Security Blanket Turns Into Tourniquet

Article is an excerpt from Sidoxia Capital Management’s April 2012 newsletter. Subscribe on right side of page.
That warm safety blanket of cash that millions of Americans have clutched on to during the 2008-09 financial crisis; the 2010 “Flash Crash”; and the 2011 U.S. credit downgrade felt cozy during the bumpy ride we experienced over the last three years. Now with domestic stocks (S&P 500) up +12% in the first quarter of 2012, that same comfy blanket of CDs, money market, and checking accounts is switching into a painful tourniquet, cutting off the lucrative blood and oxygen supply to millions of Americans’ future retirement plans.
Earning next to nothing by stuffing your money under the mattress (0.7% average CD rate – Bankrate.com) isn’t going to make many financial dreams a reality. The truth of the matter is that due to inflation (running +2% to +3% per year), blanket holders are losing about -2% per year in the true value of their savings.
Your Choice: 3 Years or 107 years?
If you like to accumulate money, would you prefer doubling your money in 3 years or 107 years? Although the S&P 500 has more than doubled over the last three years, based on fund flows data and cash balances at the banks, apparently more individuals prefer waiting until the year 2119 (107 years from now) for their money to double – SEE CHART BELOW.
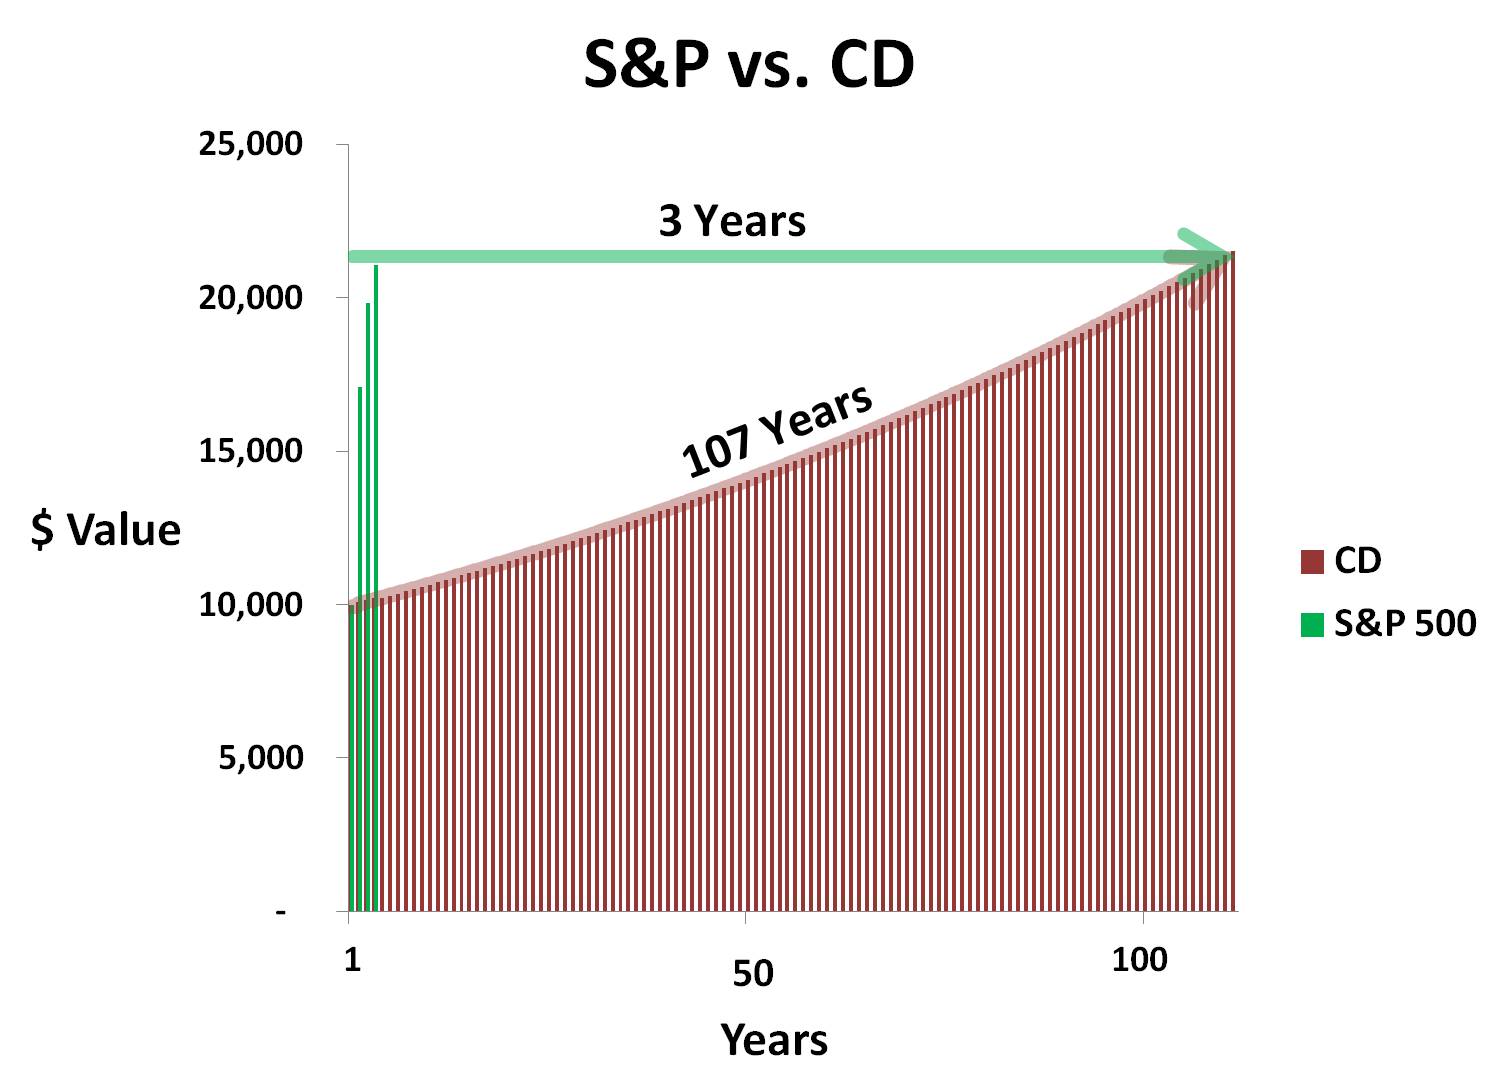
Obviously the massive underperformance of CDs cherry picks the time-period a bit, given the superb performance of stocks from 2009 – 2012 year-to-date. Over 1999-2012 stock performance hasn’t been as spectacular, but what we do know is that despite the lackluster performance of stocks over the last 12 years, corporate profits have about doubled in a similar timeframe, making equity prices that much more attractive relative to 1999.
With the economy and employment picture improving, some doomsday scenarios have temporarily been put on the backburner. As the recovery has gained some steam, many people are opening their bank statements with the painful realization, “I just made $31.49 on my checking maximizer account last year! Wow, how incredible…I can now go out and buy a half-tank of gas.” Never mind that healthcare premiums are exploding, food costs are skyrocketing, and that vacation you were planning is now out of reach. If you’re a mega-millionaire, perhaps you can make these stingy rates work for you, but for most of the other people, successful retirements will require more efficient use of their investment dollars. Or of course you can always work at Wal-Mart (WMT) as a greeter in your 80s.
Rationalizing with a Teen
Some people get it and some don’t. Trying to time the market, by getting in and out at the right times is a losing battle (see Getting Off the Market Timing Treadmill). Even the smartest professionals in the industry have little accuracy and cannot consistently predict the direction of the markets. Rationalizing the ups and downs of the financial markets is equivalent to rationalizing the actions of a teenager. Sometimes the outcomes are explainable, but most of the times they are not.
What an astute investor does know is that higher long-term returns come with higher volatility. So while the last four years have been a bumpy ride for investors, this is nothing new for an experienced investor who has studied the history of financial markets. There have been a dozen or so recessions since World War II, and we’ll have a dozen or so more over the next 50-60 years. Wars, banking crises, currency crises, and political turmoil have been a constant over history. Despite all these setbacks, the equity markets have climbed over +1,300% over the last 30 years or so. The smartest financial minds on the planet (e.g., the Ben Bernankes and Alan Greenspans of the world) haven’t been able to figure it out, so if they couldn’t do it, how is an average Joe supposed to be able to time the market? The answer is nobody can predict the direction of the market reliably.
As my clients and Investing Caffeine followers know, for those individuals with adequate savings and shorter time horizons, much of this conversation is irrelevant. However, based on our country’s low savings rate and the demographics of longer Baby Boomer life expectancies, most individuals can’t afford to stuff all their money under the mattress. As famous investor Sir John Templeton stated, “The only way to avoid mistakes is not to invest – which is the biggest mistake of all.” Earning 0.7% on your nest egg is difficult to call investing.
Ignoring the Experts
Why is the investing game so difficult? For starters, individuals are constantly bombarded by so-called experts through television, radio, and newspapers. Not only did Federal Reserve Chairmen Alan Greenspan and Ben Bernanke get the economy, financial markets, and housing markets wrong, the most powerful and smart financial institution CEOs were dead wrong as well. Look no further than Lehman Brothers (Dick Fuld), Citigroup Inc. (Chuck Prince), and American International Group (Martin Sullivan), which were believed to house some of the shrewdest executives – they too completely missed the financial crisis.
Rather than listening to shoddy predictions from pundits who have little to no investing experience, it makes more sense to listen to successful long-term investors who have survived multiple investment cycles and lived to tell the tale. Those people include the great fund manager Peter Lynch who said it is better to “assume the market is going nowhere and invest accordingly,” rather than try to time the market.
What You Hear
As the market has more than doubled over the last 37 months, here are some clouds of pessimism that these same shoddy economists, strategists, and analysts have described for investors:
* Europe and Greece’s impending fiscal domino collapse
* Excessive money printing at the Federal Reserve through quantitative easing and other programs
* Imminent government disintegration due to unresolved structural debts and deficits
* Elevated unemployment rates and pathetic job creation statistics
* Rigged high frequency trading and “Flash Crash”
* Credit downgrade and political turmoil in Washington
* Looming Chinese real estate bubble and subsequent hard economic landing
Unfortunately, many investors got sucked up in these ominous warnings and missed most, if not all, of the recent doubling in equity markets.
What You Don’t Hear
What you haven’t heard from the popular press are the following headlines:
* 10 consecutive quarters of GDP growth
* Record corporate profits and profit margins
* Equity valuations attractively priced below 50-year average (14.4 < 16.6 via Calafia Beach Pundit)
* Rising dividends with yields approaching 3%, if you consider recent bank announcements
* Record low interest rates and moderate inflation make earnings streams and dividends that much more valuable
* Four million new jobs created over the last three years
* S&P Smallcap near all-time highs (21 years); S&P Midcap index near all-time highs (20 years); NASDAQ is at 11-year highs; Dow Jones Industrials and S&P 500 near 4-year-highs.
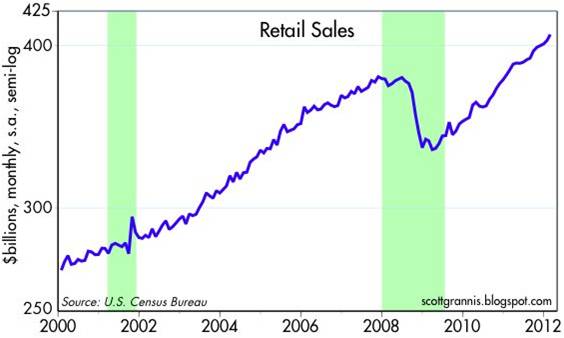
* Record retail sales with a consumer that has reduced household debt
Source: Calafia Beach Pundit
Given the massive upward run in the stock market over the last few years (and a complacent short-term VIX reading of 15), stocks are ripe for a breather. With that said, I would advise any blanket holders to not get too comfy with that money decaying away in a CD, money market, or savings account. Waiting too long may turn that security blanket into a tourniquet – forcing investors to amputate a portion of their future retirement savings.
Wade W. Slome, CFA, CFP®
Plan. Invest. Prosper.
DISCLOSURE: Sidoxia Capital Management (SCM) and some of its clients own certain exchange traded funds and WMT, but at the time of publishing SCM had no direct position in C, AIG, RATE, Lehman Brothers, or any other security referenced in this article. No information accessed through the Investing Caffeine (IC) website constitutes investment, financial, legal, tax or other advice nor is to be relied on in making an investment or other decision. Please read disclosure language on IC “Contact” page.