Posts tagged ‘Stocks’
Supply & Demand: The Key to Oil, Stocks, and Pork Bellies

Commodity prices, including oil, are “crashing” according to the pundits and fears are building that this is a precursor to another stock market collapse. Are we on an irreversible path of repeating the bloodbath carnage of the 2008-2009 Great Recession?
Fortunately for investors, markets move in cycles and the fundamental laws of supply and demand hold true in both bull and bear markets, across all financial markets. Whether we are talking about stocks, bonds, copper, gold, currencies, or pork bellies, markets persistently move like a pendulum through periods of excess supply and demand. In other words, weakness in prices create stronger demand and less supply, whereas strength in prices creates weakening demand and more supply.
Since energy makes the world go round and the vast majority of drivers are accustomed to filling up their gas tanks, the average consumer is familiar with recent negative price developments in the crude oil markets. Eighteenth-century economist Adam Smith would be proud that the laws of supply and demand have help up just as well today as they did when he wrote Wealth of Nations in 1776.
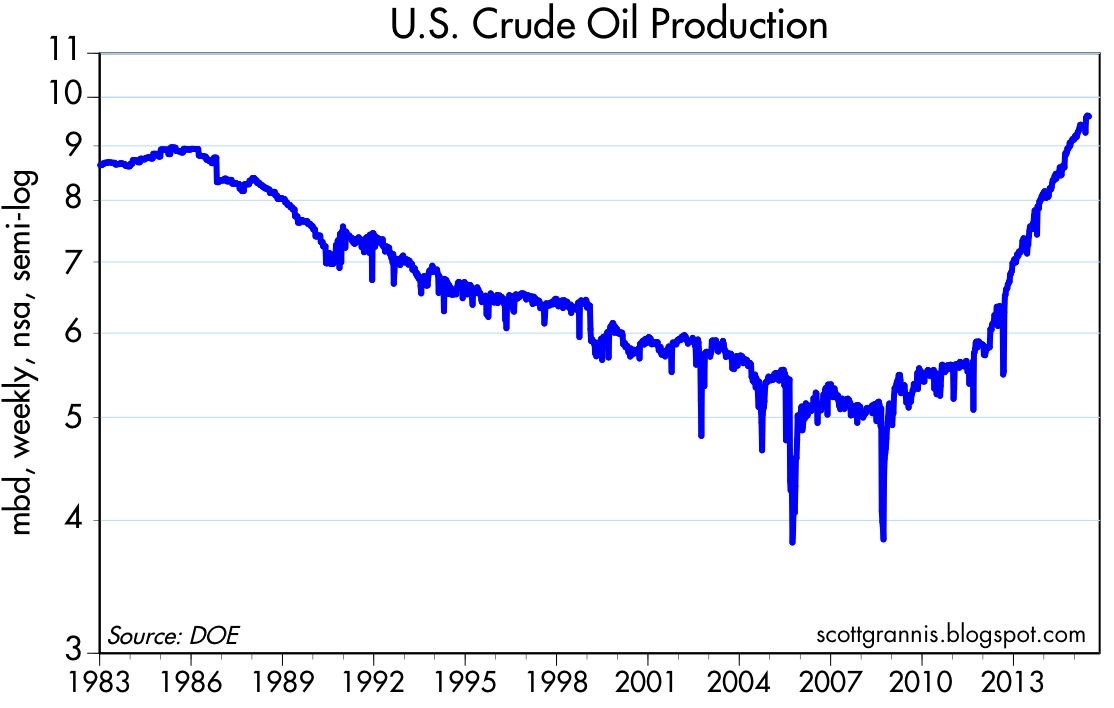
It is true that overall stagnation in global economic demand in recent years, along with the strengthening of the U.S. dollar (because of better relative growth), has contributed to downward trending oil prices. It is also true that supply factors, such as Saudi Arabia’s insistence to maintain production and the boom in U.S. oil production due to new fracking technologies (see chart below), have arguably had a larger negative impact on the more than -50% deterioration in oil prices. Fears of additional Iranian oil supply hitting the global oil markets as a result of the Iranian nuclear deal have also added to the downward pressure on prices.
Source: Scott Grannis
What is bad for oil prices and the oil producers is good news for the rest of the economy. Transportation is the lubricant of the global economy, and therefore lower oil prices will act as a stimulant for large swaths of the global marketplace. Here in the U.S., consumer savings from lower energy prices have largely been used to pay down debt (deleverage), but eventually, the longer oil prices remain depressed, incremental savings should filter into our economy through increased consumer spending.
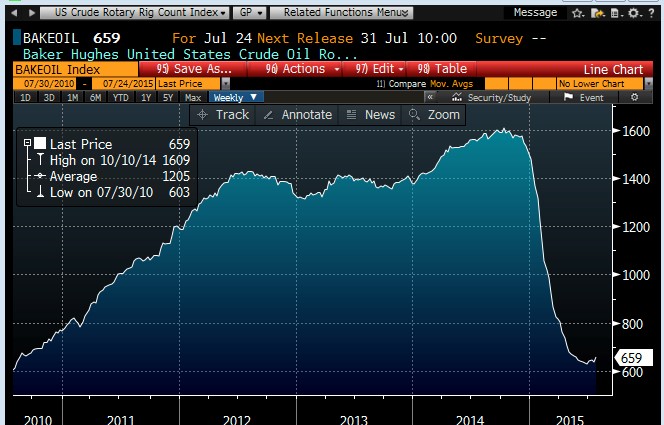
But prices are likely not going to stay low forever because producers are responding drastically to the price declines. All one needs to do is look at the radical falloff in the oil producer rig count (see chart below). As you can see, the rig count has fallen by more than -50% within a six month period, meaning at some point, the decline in global production will eventually provide a floor to prices and ultimately provide a tailwind.
Source: Scott Grannis
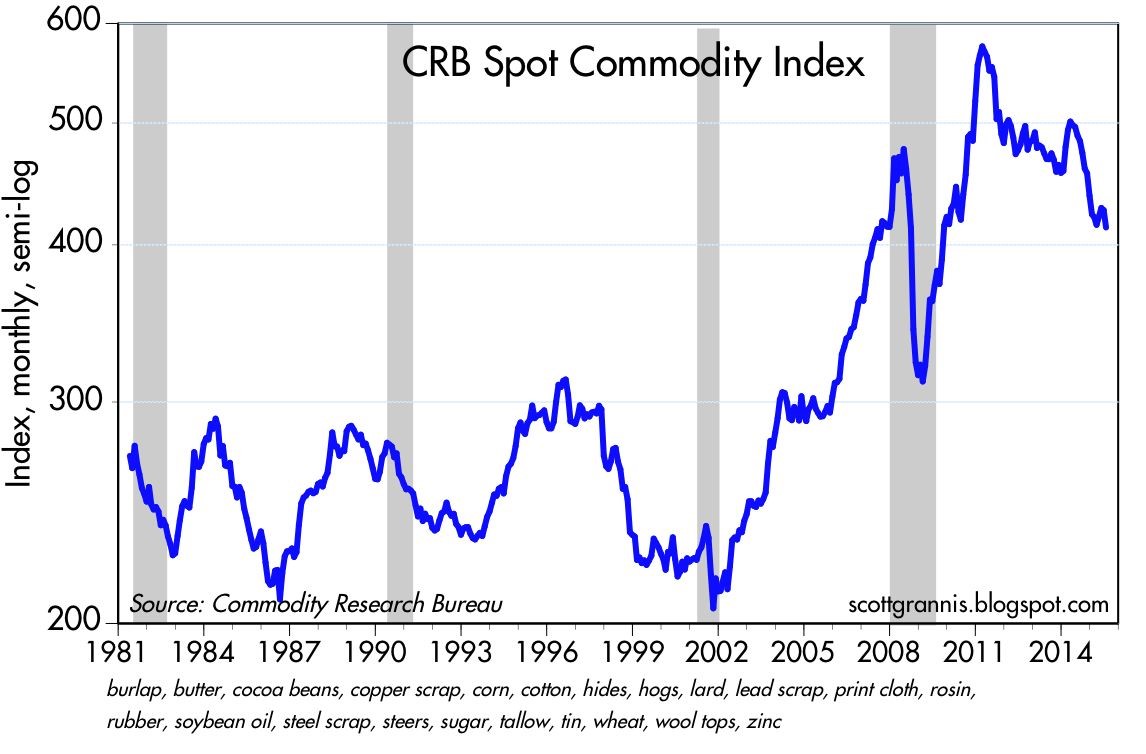
If we broaden our perspective beyond just oil, and look at the broader commodity complex, we can see that the recent decline in commodity prices has been painful, but nowhere near the Armageddon scenario experienced during 2008-2009 (see chart below – gray areas = recessions).
Source: Scott Grannis
Although this conversation has focused on commodities, the same supply-demand principles apply to the stock market as well. Stock market prices as measured by the S&P 500 index have remained near record levels, but as I have written in the past, the records cannot be attributed to the lackluster demand from retail investors (see ICI fund flow data).
Although U.S. stock fundamentals remain relatively strong (e.g., earnings, interest rates, valuations, psychology), much of the strength can be explained by the constrained supply of stocks. How has stock supply been constrained? Some key factors include the trillions in dollars of supply soaked up by record M&A activity (mergers and acquisition) and share buybacks.
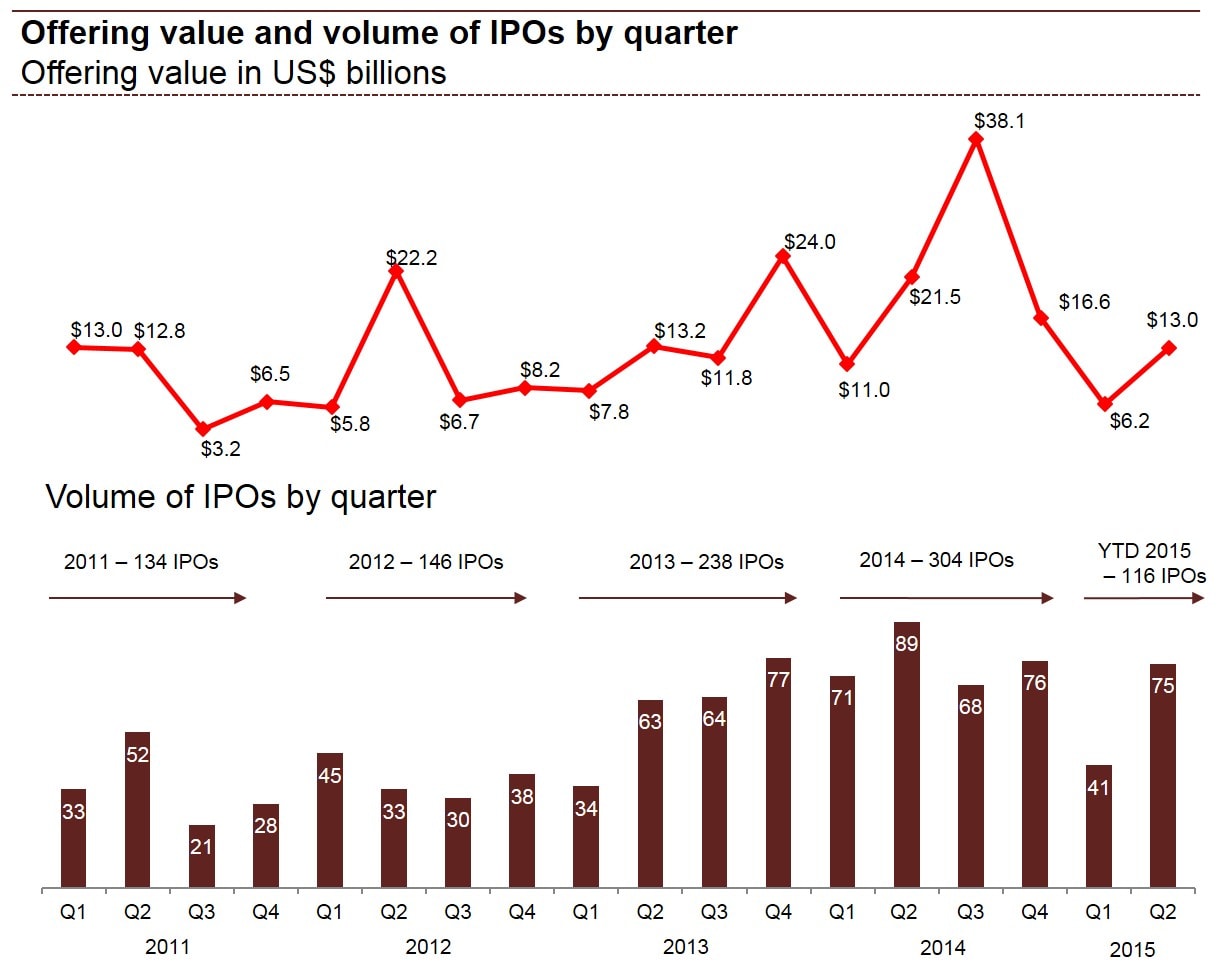
In addition to the declining stock supply from M&A and share buybacks, there has been limited supply of new IPO issues (initial public offerings) coming to market, as evidenced by the declines in IPO dollar and unit volumes in the first half of 2015, as compared to last year. More specifically, first half IPO dollar volmes were down -41% to $19.2 billion and the number of 2015 IPOs has declined -27% to 116 from 160 for the same time period.
Price cycles vary dramatically in price and duration across all financial markets, including stocks, bonds, oil, interest rates, currencies, gold, and pork bellies, among others. Not even the smartest individual or most powerful computer on the planet can consistently time the short-term shifts in financial markets, but using the powerful economic laws of supply and demand can help you profitably make adjustments to your investment portfolio(s).

See Also – The Lesson of a Lifetime (Investing Caffeine)
Wade W. Slome, CFA, CFP®
Plan. Invest. Prosper.
DISCLOSURE: Sidoxia Capital Management (SCM) and some of its clients hold positions in certain exchange traded funds (ETFs), but at the time of publishing, SCM had no direct position in any other security referenced in this article. No information accessed through the Investing Caffeine (IC) website constitutes investment, financial, legal, tax or other advice nor is to be relied on in making an investment or other decision. Please read disclosure language on IC Contact page.
Digesting Stock Gains

This article is an excerpt from a previously released Sidoxia Capital Management complementary newsletter (June 1, 2015). Subscribe on the right side of the page for the complete text.
Despite calls for “Sell in May, and go away,” the stock market as measured by both the Dow Jones Industrial and S&P 500 indexes grinded out a +1% gain during the month of May. For the year, the picture looks much the same…the Dow is up around +1% and the S&P 500 +2%. After gorging on gains of +30% in 2013 and +11% in 2014, it comes as no surprise to me that the S&P 500 is taking time to digest the gains. After eating any large pleasurable meal, there’s always a chance for some indigestion – just like last month. More specifically, the month of May ended as it did the previous six months…with a loss on the last trading day (-115 points). Providing some extra heartburn over the last 30 days were four separate 100+ point decline days. Realized fears of a Greek exit from the eurozone would no doubt have short-term traders reaching for some Tums antacid. Nevertheless, veteran investors understand this is par for the course, especially considering the outsized profits devoured in recent years.
The profits have been sweet, but not everyone has been at the table gobbling up the gains. And with success, always comes the skeptics, many of whom have been calling for a decline for years. This begs the question, “Are we in a stock bubble?” I think not.
Bubble Bites
Most asset bubbles are characterized by extreme investor/speculator euphoria. There are certainly small pockets of excitement percolating up in the stock market, but nothing like we experienced in the most recent burstings of the 2000 technology and 2006-07 housing bubbles. Yes, housing has steadily improved post the housing crash, but does this look like a housing bubble? (see New Home Sales chart)

Source: Dr. Ed’s Blog
Another characteristic of a typical asset bubble is rabid buying. However, when it comes to the investor fund flows into the U.S. stock market, we are seeing the exact opposite…money is getting sucked out of stocks like a Hoover vacuum cleaner. Over the last eight or so years, there has been almost -$700 billion that has hemorrhaged out of domestic equity funds – actions tend to speak louder than words (see chart below):
 Source: Investment Company Institute (ICI)
The shift to Exchange Traded Funds (ETFs) offered by the likes of iShares and Vanguard doesn’t explain the exodus of cash because ETFs such as S&P 500 SPDR ETF (SPY) are suffering dramatically too. SPY has drained about -$17 billion alone over the last year and a half.
With money flooding out of these stock funds, how can stock prices move higher? Well, one short answer is that hundreds of billions of dollars in share buybacks and trillions in mergers and acquisitions activity (M&A) is contributing to the tide lifting all stock boats. Low interest rates and stimulative monetary policies by central banks around the globe are no doubt contributing to this positive trend. While the U.S. Federal Reserve has already begun reversing its loose monetary policies and has threatened to increase short-term interest rates, by any objective standard, interest rates should remain at very supportive levels relative to historical benchmarks.
Besides housing and fund flows data, there are other unbiased sentiment indicators that indicate investors have not become universally Pollyannaish. Take for example the weekly AAII Sentiment Survey, which shows 73% of investors are currently Bearish and/or Neutral – significantly higher than historical averages.
The Consumer Confidence dataset also shows that not everyone is wearing rose-colored glasses. Looking back over the last five decades, you can see the current readings are hovering around the historical averages – nowhere near the bubblicious 2000 peak (~50% below).

Source: Bespoke
Recession Reservations
Even if you’re convinced there is no imminent stock market bubble bursting, many of the same skeptics (and others) feel we’re on the verge of a recession – I’ve been writing about many of them since 2009. You could choke on an endless number of economic indicators, but on the common sense side of the economic equation, typically rising unemployment is a good barometer for any potentially looming recession. Here’s the unemployment rate we’re looking at now (with shaded periods indicating prior recessions):

As you can see, the recent 5.4% unemployment rate is still moving on a downward, positive trajectory. By most peoples’ estimation, because this has been the slowest recovery since World War II, there is still plenty of labor slack in the market to keep hiring going.
An even better leading indicator for future recessions has been the slope of the yield curve. A yield curve plots interest rate yields of similar bonds across a range of periods (e.g., three-month bill, six-month bill, one-year bill, two-year note, five-year note, 10-year note and 30-year bond). Traditionally, as short-term interest rates move higher, this phenomenon tends to flatten the yield curve, and eventually inverts the yield curve (i.e., short-term interest rates are higher than long-term interest rates). Over the last few decades, when the yield curve became inverted, it was an excellent leading indicator of a pending recession (click here and select “Animate” to see amazing interactive yield curve graph). Fortunately for the bulls, there is no sign of an inverted yield curve – 30-year rates remain significantly higher than short-term rates (see chart below).

Stock market skeptics continue to rationalize the record high stock prices by pointing to the artificially induced Federal Reserve money printing buying binge. It is true that the buffet of gains is not sustainable at the same pace as has been experienced over the last six years. As we continue to move closer to full employment in this economic cycle, the rapid accumulated wealth will need to be digested at a more responsible rate. An unexpected Greek exit from the EU or spike in interest rates could cause a short-term stomach ache, but until many of the previously mentioned indicators reach dangerous levels, please pass the gravy.
Wade W. Slome, CFA, CFP®
Plan. Invest. Prosper.
DISCLOSURE: Sidoxia Capital Management (SCM) and some of its clients hold positions in SPY and other certain exchange traded funds (ETFs), but at the time of publishing, SCM had no direct position in any other security referenced in this article. No information accessed through the Investing Caffeine (IC) website constitutes investment, financial, legal, tax or other advice nor is to be relied on in making an investment or other decision. Please read disclosure language on IC Contact page.
The Bunny Rabbit Market

This article is an excerpt from a previously released Sidoxia Capital Management complementary newsletter (April 1, 2015). Subscribe on the right side of the page for the complete text.
With spring now upon us, we can see the impact the Easter Bunny has had on financial markets…a lot of bouncing around. More specifically, stocks spent about 50% of the first quarter in negative territory, and 50% in positive territory. With interest rates gyrating around the 2% level for the benchmark 10-Year Treasury Note for most of 2015, the picture looked much the same. When all was said and done, after the first three months of the year, stocks as measured by the S&P 500 finished +0.4% and bonds closed up a similarly modest amount of +1.2%, as measured by the Total Bond Market ETF (BND).
Why all the volatility? The reasons are numerous, but guesswork of when the Federal Reserve will reverse course on its monetary policy and begin raising interest rates has been (and remains) a dark cloud over investment strategies for many short-term traders and speculators. In order to provide some historical perspective, the last time the Federal Reserve increased interest rates (Federal Funds rate) was almost nine years ago in June 2006. It’s important to remember, as this bull market enters its 7th consecutive year of its advance, there has been no shortage of useless, negative news headlines to keep investors guessing (see also a Series of Unfortunate Events). Over this period, ranging concerns have covered everything from “Flash Crashes” to “Arab Springs,” and “Ukraine” to “Ebola”.
Last month, the headline pessimism persisted. In the Middle East we witnessed a contentious re-election of Israeli Prime Minister Benjamin Netanyahu; Saudi Arabia led airstrikes against Iranian-backed, Shi’ite Muslim rebels (Houthis) in Yemen; controversial Iranian nuclear deal talks; and President Barack Obama directed airstrikes against ISIS fighters in the Iraqi city of Tikrit, while he simultaneously announced the slowing pace of troop withdrawals from Afghanistan.
Meanwhile in the global financial markets, investors and corporations continue to assess capital allocation decisions in light of generationally low interest rates, and a U.S. dollar that has appreciated in value by approximately +25% over the last year. In this low global growth and ultra-low interest rate environment (-0.12% on long-term Swiss bonds and 1.93% for U.S. bonds), what are corporations choosing to do with their trillions of dollars in cash? A picture is worth a thousand words, and in the case of companies in the S&P 500 club, share buybacks and dividends have been worth more than $900,000,000,000.00 over the last 12 months (see chart below).

Source: Financial Times
Case in point, Apple Inc (AAPL) has been the poster child for how companies are opportunistically boosting stock prices and profitability metrics (EPS – Earnings Per Share) by borrowing cheaply and returning cash to shareholders via stock buybacks and dividend payments. More specifically, even though Apple has been flooded with cash (about $178 billion currently in the bank), Apple decided to accept $1.35 billion in additional money from bond investors by issuing bonds in Switzerland. The cost to Apple was almost free – the majority of the money will be paid back at a mere rate of 0.28% until November 2024. What is Apple doing with all this extra cash? You guessed it…buying back $45 billion in stock and paying $11 billion in dividends, annually. No wonder the stock has sprung +62% over the last year. Apple may be a unique company, but corporate America is following their shareholder friendly buyback/dividend practices as evidenced by the chart below. By the way, don’t be surprised to hear about an increased dividend and share buyback plan from Apple this month.

Source: Investors Business Daily
Despite all the turmoil and negative headlines last month, the technology-heavy NASDAQ Composite index managed to temporarily cross the psychologically, all-important 5,000 threshold for the first time since the infamous tech-bubble burst in the year 2000, more than 15 years ago. The Dow Jones Industrial also cracked a numerically round threshold (18,000) last month, before settling down at 17,779 at month’s end.
While the S&P 500 and NASDAQ indexes have posted their impressive 9th consecutive quarter of gains, I don’t place a lot of faith in dubious, calendar-driven historical trends. With that said, as I eat jelly beans and hunt for Easter eggs this weekend, I will take some solace in knowing April has historically been the most positive month of the year as it relates to direction of stock prices (see chart below). Over the last 20 years, stocks have almost averaged a gain of +3% over this 30-day period. Perhaps investors are just in a better mood after paying their taxes?
Source: Bespoke
Even though April has historically been an outperforming month, banker and economist Robert Rubin stated it best, “Nothing is certain – except uncertainty.” We’ve had a bouncing “Bunny Market” so far in 2015, and chances are this pattern will persist. Rather than fret whether the Fed will raise interest rates 0.25% or agonize over a potential Greek exit (“Grexit”) from the EU, you would be better served by constructing an investment and savings plan to meet your long-term financial goals. That’s an eggstra-special idea that even the Easter Bunny would want to place in the basket.
Wade W. Slome, CFA, CFP®
Plan. Invest. Prosper.
DISCLOSURE: Sidoxia Capital Management (SCM) and some of its clients hold positions in certain exchange traded funds (ETFs) including BND and AAPL (stock), but at the time of publishing, SCM had no direct position in any other security referenced in this article. No information accessed through the Investing Caffeine (IC) website constitutes investment, financial, legal, tax or other advice nor is to be relied on in making an investment or other decision. Please read disclosure language on IC Contact page.
March Madness – Dividend Grandness & Volatility Blandness

March Madness has arrived once again. This NCAA basketball event, which has been around since 1939, begins with a selection committee choosing the top 68 teams in the country. These teams are matched up against each other through a single-elimination tournament until a national champion is throned. The stock market does not have a selection committee that picks teams from conferences like the SEC, Big East, Pac-12, and ACC, but rather millions of investors select the best investments from asset classes like stocks, bonds, real estate, commodities, venture capital, and private equity.
In the investment world, there are no win-loss records, but rather there are risk-return profiles. Investors generally migrate towards the asset classes where they find the optimal trade-off between risk and return. Speculators, day-traders, and momentum traders may define risk differently, but regardless, over the long-run, capital goes where it is treated best. And over the last six years, the U.S. stock market hasn’t been a bad place to be (the S&P 500 has about tripled).
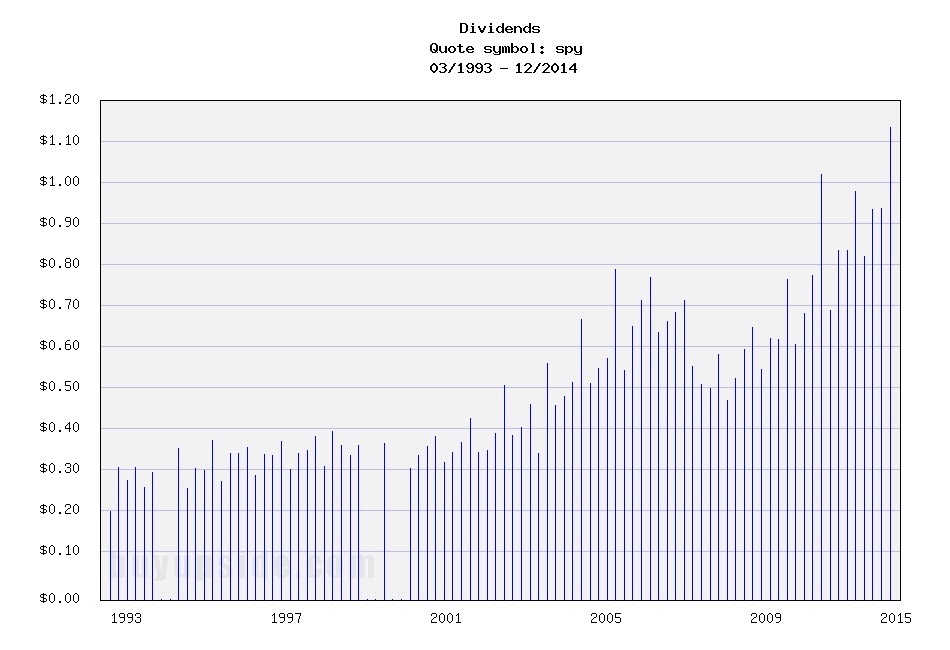
Why such outperformance in stocks? Besides a dynamic earnings recovery from the 2008-2009 financial crisis, another major factor has been the near-0% interest rate environment. When investors are earning near nothing in their bank and savings accounts, it is perfectly rational for savers to look for riskier options, if they are compensated for that risk. In addition to loose central bank and quantitative easing policies fueling demand for stocks, rising dividends have increased the attractiveness of the stock market. In fact, as you can see from the chart below, dividends have about doubled from 2008-2009 and about tripled from the year 2000.
Source: Buy Upside
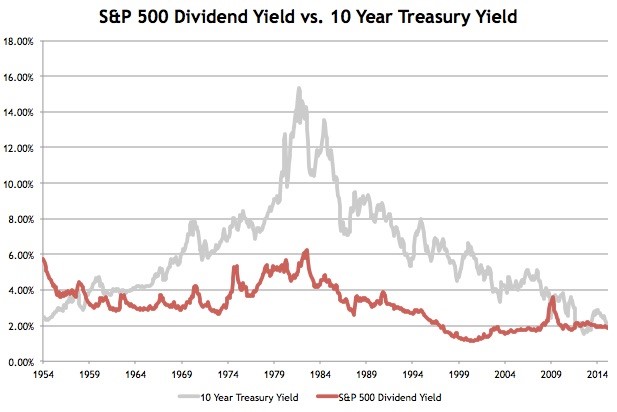
Stock prices have moved higher in concert with rising dividends, which, as you can see from the chart below, has kept the dividend yield flat at around 2% over the last few years. Treasury bond yields, on the other hand, have been on steady declining trend for the last 35 years. So, while coupons on newly issued bonds have been declining for virtually the last three and a half decades, stock dividends have been on a steadily upward moving rampage, excluding recessions (up +13% in the most recent reported period).
Source: Avondale Asset Management
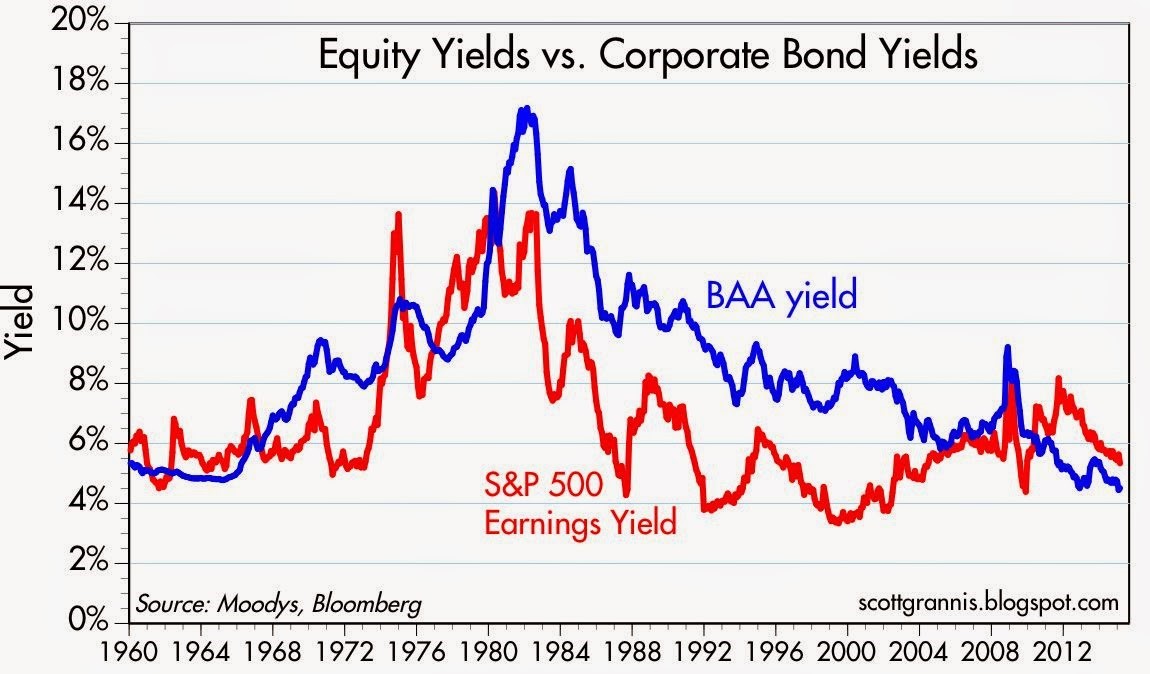
Declining interest rates have made stocks look attractive relative to investment grade corporate bonds too as evidenced by the chart below. As you can see, over the last half-century, corporate bond yields have predominantly offered higher income yields than the earnings yield on stocks – that is not the case today.
Source: Calafia Beach Pundit
What does all this stock dividend, earnings yield stuff mean? In the grand scheme of things, income starving Baby Boomers and retirees are slowly realizing that stocks in general stack up favorably in an environment in which interest payments are going down and dividend payments are going up. One of the areas highlighting the underlying demand for stocks is the Volatility Index (VIX) – a.k.a., the “Fear Gauge.” Despite Greece, Russia, ISIS, the Fed, and the Dollar dominating the headlines, the hunger for yield and growth in a declining interest rate environment is cushioning the blow during these heightened periods of volatility (see also A Series of Unfortunate Events).
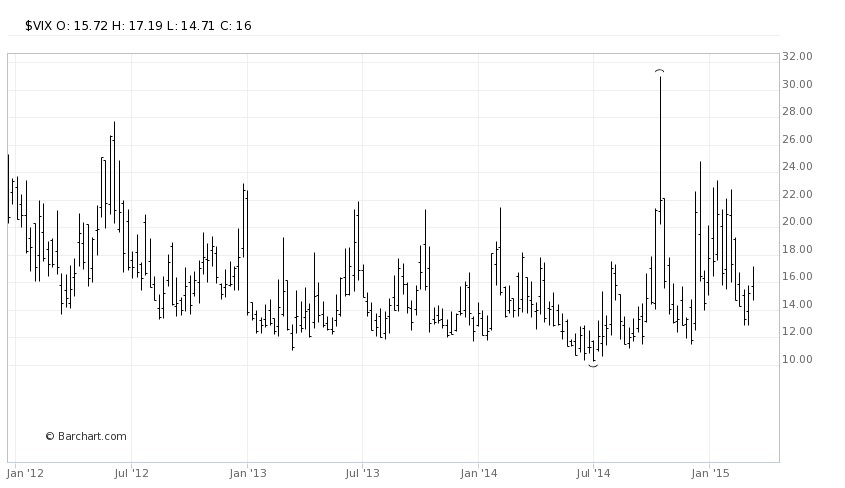
Since the end of 2011, the monthly close of the VIX has stayed above its historical average of approximately 20 only two times (see chart below). In other words, over that timeframe, the VIX has remained below average about 95% of the time. When the VIX has spiked above 20, generally it has only been for brief periods, until cooler heads prevail and bargain hunters come in to buy depressed stock bargains.
Source: Barchart
I’m not naïve enough to believe the bull market in stocks will last forever, but as long as interest rates don’t spike up and/or corporate earnings crater, underlying demand for yield should provide a floor for stocks during heightened periods of volatility. We may be in the midst of March Madness but volatility blandness is showing us that investors are paying attention to dividend grandness.
Wade W. Slome, CFA, CFP®
Plan. Invest. Prosper.
DISCLOSURE: Sidoxia Capital Management (SCM) and some of its clients hold positions in certain exchange traded funds (ETFs) and SPY, but at the time of publishing, SCM had no direct position in any other security referenced in this article. No information accessed through the Investing Caffeine (IC) website constitutes investment, financial, legal, tax or other advice nor is to be relied on in making an investment or other decision. Please read disclosure language on IC Contact page.
Ceasefires & Investor Quagmires

This article is an excerpt from a previously released Sidoxia Capital Management complementary newsletter (March 1, 2015). Subscribe on the right side of the page for the complete text.
Considering the following current event headlines, who would have guessed the stock market is trading near record, all-time highs and the NASDAQ index breaking 5,000 for the first time since the year 2000?
- Russia Lies Over Ukraine Ceasefire
- ISIS Beheadings and Jihadi John
- Strong Dollar, Weak Global Economy
- Fed’s Yellen: Rate Rise & Inflation
- Iranian Negotiations & Nuclear Weapons
- Grexit: The Likelihood of Greece’s Exit from the Euro
- The Chinese Bubble Pops
- Ebola and the Fear Epidemic
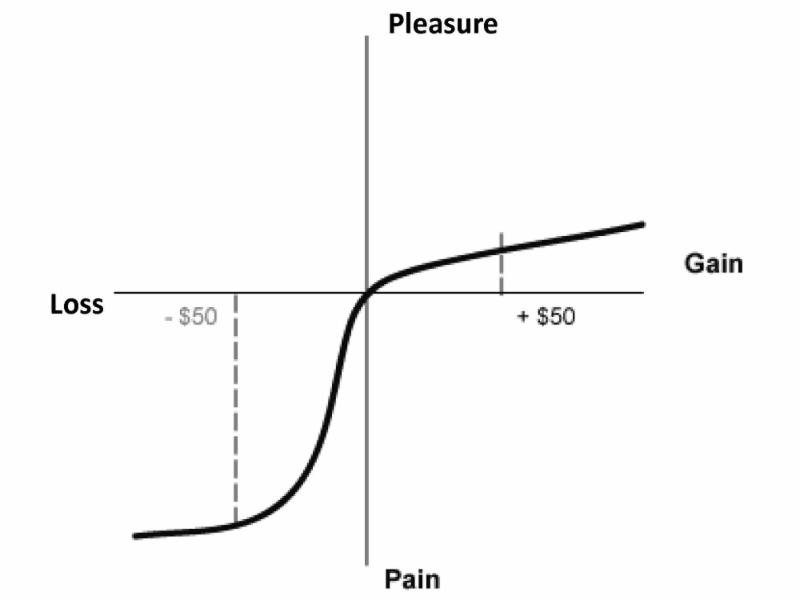
After reading all these depressing stories, I feel more like taking a Prozac pill than I do venturing into the investing world. Unfortunately, in the media world, the overarching motto driving the selection of published stories is, “If it bleeds, it leads!” Plainly and simply, bad news sells. The media outlets prey on our human behavioral shortcomings. Specifically, people feel the pain from losses at a rate more than double the feelings of pleasure (see Controlling the Lizard Brain and chart below).
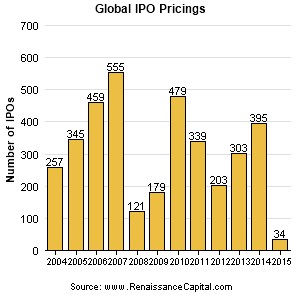
This phenomenon leaves Americans and the overall investing public choking on the daily doom and gloom headlines. Investor skepticism caused by the 2008-2009 financial crisis is evidenced by historically low stock ownership statistics and stagnant equity purchase flow data. Talk of another stock bubble has been introduced again now that the NASDAQ is approaching 5,000 again, but we are not seeing signs of this phenomenon in the IPO market (Initial Public Offering) – see chart below. IPOs are on the rise, but the number of filings is more than -50% below the peak of 845 IPOs seen in the late 1990s when former Federal Reserve Chairman Alan Greenspan made his famous “irrational exuberance” speech (see also Irrational Exuberance Deja Vu and chart below).
Uggh! 0.08% Really?
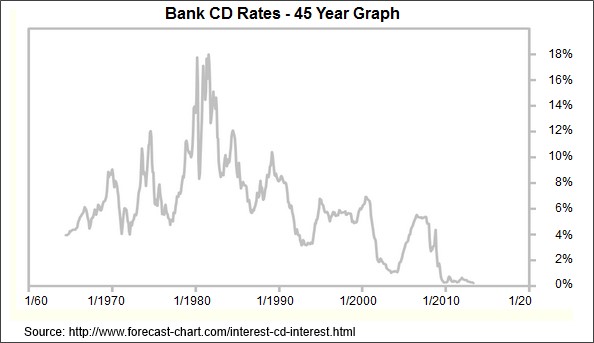
Compounding the never-ending pessimism problem is the near-0% interest rate environment. Times are long gone when you could earn 18% on a certificate of deposit (see chart below). Today, you can earn 0.08% on a minimum $10,000 investment in a Bank of America (BAC) Certificate of Deposit (CD). Invest at that rate for more than a decade and you will have almost accumulated a $100 (~1%) – probably enough for a single family meal…without tip. To put these paltry interest rates into perspective, the U.S. stock market as measured by the S&P 500 index was up a whopping +5.5% last month and the Dow Jones Industrials climbed +5.6% (+968 points to 18,133). Granted, last month’s S&P 500 percentage increase was the largest advance since 2011, but if I wanted to earn an equivalent +5.5% return by investing in that Bank of America CD, it would take me to age 100 years old before I earned that much!
Globally, the interest rate picture doesn’t look much prettier. In fact, the negative interest rate bonds offered in Switzerland and other neighboring countries, including France and Germany, have left investors in these bonds with guaranteed losses, if held to maturity (see also Draghi Beer Goggles).
Money Seeking Preferred Treatment
Investors and followers of mine have heard me repeatedly declare that “money goes where it is treated best.” When many investments are offering 0% (or negative yields), it comes as no surprise to me that dividend paying stocks have handily outperformed the overall bond market in recent years. Hard to blame someone investing in certain stocks offering between 2-6% in dividends when the alternative is offered at or near 0%.
While at Sidoxia we are still finding plenty of opportunities in the equity markets, I want to extend the reminder that not everyone can (or should) increase their equity allocation because of personal time horizon and risk tolerance constraints. Regardless, the current, restricting global financial markets are highlighting the scarcity of investment alternatives available.
As we will continue to be bombarded with more cease fires, quagmires and other bleeding headlines, investors will be better served by ignoring the irrelevant headlines and instead create a long-term financial plan with an asset allocation designed to meeting their personal goals. By following this strategy, you can let the dooms-dayers bleed while you succeed.

Wade W. Slome, CFA, CFP®
Plan. Invest. Prosper.
DISCLOSURE: Sidoxia Capital Management (SCM) and some of its clients hold positions in certain exchange traded funds (ETFs) and BAC, but at the time of publishing, SCM had no direct position in any other security referenced in this article. No information accessed through the Investing Caffeine (IC) website constitutes investment, financial, legal, tax or other advice nor is to be relied on in making an investment or other decision. Please read disclosure language on IC Contact page.
Santa and the Rate-Hike Boogeyman

Boo! … Rates are about to go up. Or are they? We’re in the fourth decade of a declining interest rate environment (see Don’t be a Fool), but every time the Federal Reserve Chairman speaks or monetary policies are discussed, investors nervously look over their shoulder or under their bed for the “Rate Hike Boogeyman.” While this nail-biting mentality has resulted in lost sleep for many, this mindset has also unfortunately led to a horrible forecasting batting average for economists. Santa and many equity investors have ignored the rate noise and have been singing Ho Ho Ho as stock prices hover near record highs.
A recent Deutsche Bank report describes the prognostication challenges here:
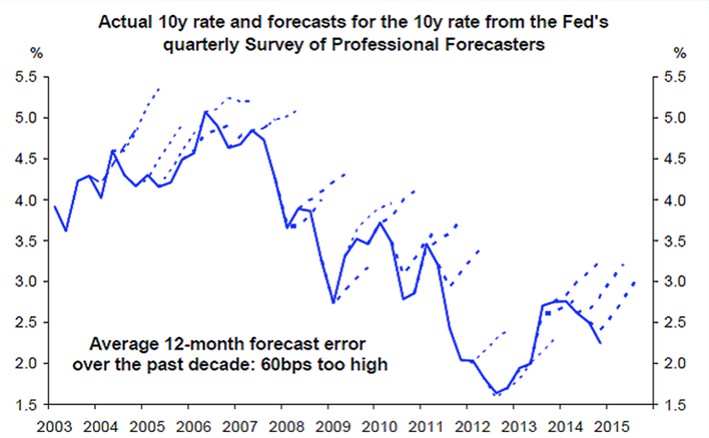
i.) For the last 10 years, professional forecasters have consistently been wrong on their predictions of rising interest rates.
Source: Deutsche Bank via Vox
ii.) For the last five years, investors haven’t fared any better. As you can see, they too have been continually wrong about their expectations for rising interest rates.
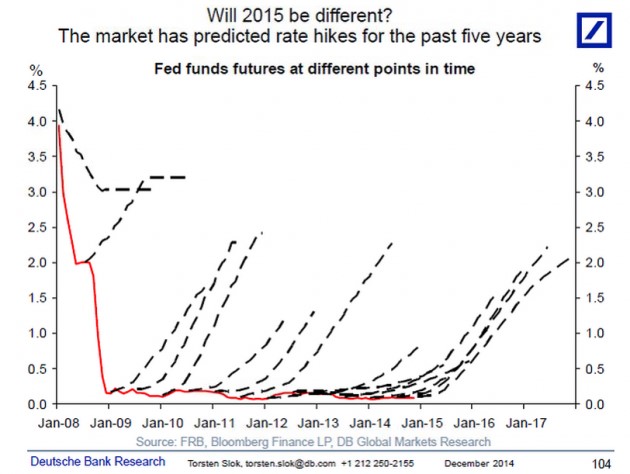
Source: Deutsche Bank via Vox
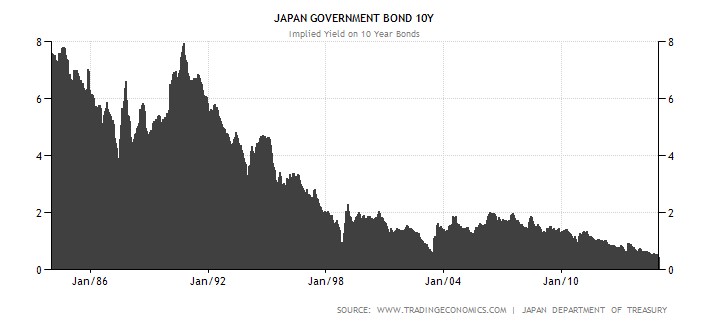
I’m the first to admit that rates have remained “lower for longer” than I guessed, but unlike many, I do not pretend to predict the exact timing of future rate increases. I strongly believe inevitable interest rate rises are not a matter of “if” but rather “when”. However, trying to forecast the timing of a rate increase can be a fool’s errand. Japan is a great case in point. If you take a look at the country’s interest rates on their long-term 10-year government bonds (see chart below), the yields have also been declining over the last quarter century. While the yield on the 10-Year U.S. Treasury Note is near all-time historic lows at 2.18%, that rate pales in comparison to the current 10-Year Japanese Bond which is yielding a minuscule 0.36%. While here in the states our long-term rates only briefly pierced below the 2% threshold, as you can see, Japanese rates have remained below 2% for a jaw-dropping duration of about 15 years.
Source: TradingEconomics.com
There are plenty of reasons to explain the differences in the economic situation of the U.S. and Japan (see Japan Lost Decades), but despite the loose monetary policies of global central banks, history has proven that interest rates and inflation can remain stubbornly low for longer than expected.
The current pundit thinking has Federal Reserve Chairwoman Yellen leading the brigade towards a rate hike during mid-calendar 2015. Even if the forecasters finally get the interest rate right for once, the end-outcome is not going to be catastrophic for equity markets. One need look no further than 1994 when Federal Reserve Chairman Greenspan increased the benchmark federal funds rate by a hefty +2.5%. (see 1994 Bond Repeat?). Rather than widespread financial carnage in the equity markets, the S&P 500 finished roughly flat in 1994 and resumed the decade-long bull market run in the following year.
Currently 15 of the 17 Fed policy makers see 2015 median short-term rates settling at 1.125% from the current level of 0-0.25%. This hardly qualifies as interest rate Armageddon. With a highly transparent and dovish Janet Yellen at the helm, I feel perfectly comfortable the markets can digest the inevitable Fed rate hikes. Will (could) there be volatility around changes in Fed monetary policy during 2015? Certainly – no different than we experienced during the “taper tantrum” response to Chairman Ben Bernanke’s rate rise threats in 2013 (see Fed Fatigue).
As 2014 comes to an end, Santa has wrapped investor portfolios with a generous bow of returns in the fifth year of this historic bull market. Not everyone, however, has been on Santa’s “nice” list. Regrettably, many sideliners have received no presents because they incorrectly assessed the elimination impact of Quantitative Easing (QE). If you prefer presents over a lump of coal in your stocking, it will be in your best interest to ignore the Rate Hike Boogeyman and jump on Santa’s sleigh.
Wade W. Slome, CFA, CFP®
Plan. Invest. Prosper.
DISCLOSURE: Sidoxia Capital Management (SCM) and some of its clients own a range of positions, including certain exchange traded fund positions, but at the time of publishing SCM had no direct position in DB or any other security referenced in this article. No information accessed through the Investing Caffeine (IC) website constitutes investment, financial, legal, tax or other advice nor is to be relied on in making an investment or other decision. Please read disclosure language on IC Contact page.
Don’t Be a Fool, Follow the Stool

It’s the holiday season and with another year coming to an end, it’s also time for a wide range of religious celebrations to take place. Investing is a lot like religion too. Just like there are a countless number of religions, there are also a countless number of investing styles, whether you are talking about Value investing, Growth, Quantitative, Technical, Momentum, Merger-Arbitrage, GARP (Growth At a Reasonable Price), or a multitude of other derivative types. But regardless of the style followed, most professional managers believe their style is the sole answer to lead followers to financial nirvana. While I may not share the same view (I believe there are many ways to skin the stock market cat), each investing discipline (or religion) will have its own unique core tenets that drive expectations for future returns (outcomes).
As it relates to my firm, Sidoxia Capital Management, our investment process is premised on four key tenets. Much like the four legs of a stool, the following principles provide the foundation for our beliefs and outlook on the mid-to-long-term direction of the stock market:
- Profits
- Interest Rates
- Sentiment
- Valuations
Why are these the key components that drive stock market returns? Let’s dig a little deeper to clarify the importance of these factors:
Profits: Over the long-run there is a very significant correlation between stock prices and profits (see also It’s the Earnings, Stupid). I’m not the only one preaching this religious belief, investment legends Peter Lynch and William O’Neil think the same. In answer to a question by Dell Computer’s CEO Michael Dell about its stock price, Lynch famously responded , “If your earnings are higher in five years, your stock will be higher.” The same idea works with the overall stock market. As I recently wrote (see Why Buy at Record Highs? Ask the Fat Turkey), with corporate profits at all-time record highs, it should come as no surprise that stock prices are near all-time record highs. Regardless of the absolute level of profits, it’s also very important to have a feel for whether earnings are accelerating or decelerating, because investors will pay a different price based on this dynamic.
Interest Rates: When embarrassingly low CD interest rates of 0.08% are being offered on $10,000 deposits at Bank of America, do you think stocks look more or less attractive? It’s obviously a rhetorical question, because I can earn 20x more just by collecting the dividends from the S&P 500 index. Now in 1980 when the Federal Funds rate was set at 20.0% and investors could earn 16.0% on CDs, guess what? Stocks were logging their lowest valuation levels in decades (approximately 8x P/E ratio vs 17x today). The interest rate chart from Scott Grannis below highlights the near generational low interest rates we are currently experiencing.

Source: Calafia Beach Pundit
Sentiment: As I wrote in my Sentiment Indicators: Reading the Tea Leaves article, there are plenty of sentiment indicators (e.g., AAII Surveys, VIX Fear Gauge, Breadth Indicators, NYSE Bulls %, Put-Call Ratio, Volume), which traditionally are good contrarian indicators for the future direction of stock prices. When sentiment is too bullish (optimistic), it is often a good time to sell or trim, and when sentiment is too bearish (pessimistic), it is often good to buy. With that said, in addition to many of these short-term sentiment indicators, I realize that actions speak louder than words, therefore I like to also see the flows of funds into and out of stocks/bonds to gauge sentiment (see also Market Champagne Sits on Ice).
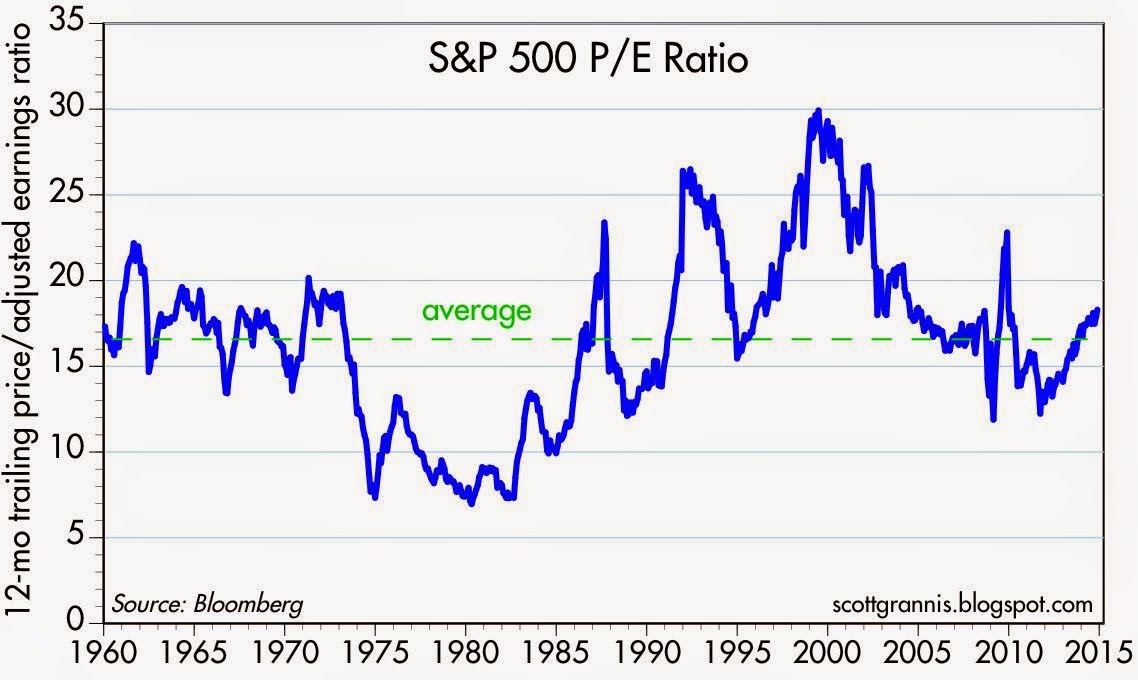
Valuations: As Fred Hickey, the lead editor of the High Tech Strategist noted, “Valuations do matter in the stock market, just as good pitching matters in baseball.” The most often quoted valuation metric is the Price/Earnings multiple or PE ratio. In other words, this ratio compares the price you would pay for an annual stream of profits. This can be tricky to determine because there are virtually an infinite number of factors that can impact the numerator and denominator. Currently P/E valuations are near historical averages (see below) – not nearly as cheap as 1980 and not nearly as expensive as 2000. If I only had one metric to choose, this would be a good place to start because the previous three legs of the stool feed into valuation calculations. In addition to P/E, at Sidoxia one of our other favorite metrics is Free-Cash-Flow Yield (annual cash generation after all expenses and expenditures divided by a company’s value). Earnings can be manipulated much easier than cold hard cash in our view.
Source: Calafia Beach Pundit
Nobody, myself and Warren Buffett included, can consistently predict what the stock market will do in the short-run. Buffett freely admits it. However, investing is a game of probabilities, and if you use the four tenets of profits, interest rates, sentiment, and valuations to drive your long-term investing decisions, your chances for future financial success will increase dramatically. This framework is just as relevant today as it is when studying the 1929 Crash, the 1989 Japan Bubble, or the 2008-2009 Financial Crisis. If your goal is to not become an investing fool, I highly encourage you to follow the legs of the Sidoxia stool.
Wade W. Slome, CFA, CFP®
Plan. Invest. Prosper.
DISCLOSURE: Sidoxia Capital Management (SCM) and some of its clients own a range of positions, including BAC and certain exchange traded fund positions, but at the time of publishing SCM had no direct position in any other security referenced in this article. No information accessed through the Investing Caffeine (IC) website constitutes investment, financial, legal, tax or other advice nor is to be relied on in making an investment or other decision. Please read disclosure language on IC Contact page.
Why Buy at Record Highs? Ask the Fat Turkey

This article is an excerpt from a previously released Sidoxia Capital Management complementary newsletter (December 1, 2014). Subscribe on the right side of the page for the complete text.
I’ve fulfilled my American Thanksgiving duty by gorging myself on multiple helpings of turkey, mash potatoes, and pumpkin pie. Now that I have loosened my belt a few notches, I have had time to reflect on the generous servings of stock returns this year (S&P 500 index up +11.9%), on top of the whopping +104.6% gains from previous 5 years (2009-2013).
Conventional wisdom believes the Federal Reserve has artificially inflated the stock market. Given the perceived sky-high record stock prices, many investors are biting their nails in anticipation of an impending crash. The evidence behind the nagging investor skepticism can be found in the near-record low stock ownership statistics; dismal domestic equity fund purchases; and apathetic investor survey data (see Market Champagne Sits on Ice).
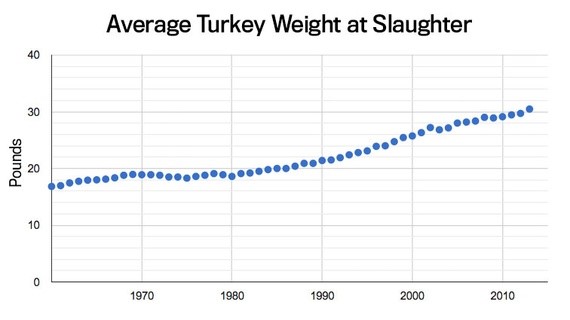
Turkey-lovers are in a great position to understand the predicted stock crash expected by many of the naysayers. As you can see from the chart below, the size of turkeys over the last 50+ years has reached a record weight – and therefore record prices per turkey:
Source: The Atlantic
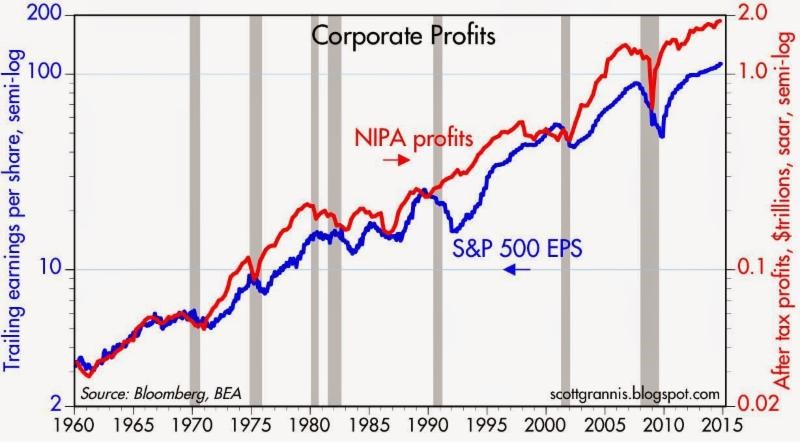
Does a record size in turkeys mean turkey meat prices are doomed for an imminent price collapse? Absolutely not. A key reason turkey prices have hit record levels is because Thanksgiving stomachs have been buying fatter and fatter turkeys every year. The same phenomenon is happening in the stock market. The reason stock prices have continued to move higher and higher is because profits have grown fatter and fatter every year (see chart below). Profits in corporate America have never been higher. CEOs are sitting on trillions of dollars of cash, and providing stock-investors with growing plump dividends (see also The Gift that Keeps on Giving), $100s of billions in shareholder friendly stock buybacks, while increasingly taking leftover profits to invest in growth initiatives (e.g., technology investments, international expansion, and job hiring).
Source: Calafia Beach Pundit
Despite record turkey prices, I will make the bold prediction that hungry Americans will continue to buy turkey. More important than the overall price paid per turkey, the statistic that consumers should be paying more attention to is the turkey price paid per pound. Based on that more relevant metric, the data on turkey prices is less conclusive. In fact, turkey prices are estimated to be -13% cheaper this year on a per pound basis compared to last year ($1.58/lb vs. $1.82/lb).
The equivalent price per pound metric in the stock market is called the Price-Earnings (P/E) ratio, which is the price paid by a stock investor per $1 of profits (or earnings). Today that P/E ratio sits at approximately 17.5x. As you can see from the chart below, the current P/E ratio is reasonably near historical averages experienced over the last 50+ years. While, all else equal, anyone would prefer paying a lower price per pound (or price per $1 in earnings), any objective person looking at the current P/E ratio would have difficulty concluding recent stock prices are in “bubble” territory.
However, investor doubters who have missed the record bull run in stock market prices over the last five years (+210% since early 2009) have clung to a distorted, overpriced measurement called the CAPE or Shiller P/E ratio. Readers of my Investing Caffeine blog or newsletters know why this metric is misleading and inaccurate (see also Shiller CAPE Peaches Smell).
Don’t Be an Ostrich

While prices of stocks arguably remain reasonably priced for many Baby Boomers and retirees, the conclusion should not be to gorge 100% of investment portfolios into stocks. Quite the contrary. Everyone’s situation is unique, and every investor should customize a globally diversified portfolio beyond just stocks, including areas like fixed income, real estate, alternative investments, and commodities. But the exposures don’t stop there, because in order to truly have the diversified shock absorbers in your portfolio necessary for a bumpy long-term ride, investors need exposure to other areas. Such areas should include international and emerging market geographies; a diverse set of styles (e.g., Value, Growth, Blue Chip dividend-payers); and a healthy ownership across small, medium, and large equities. The same principles apply to your bond portfolio. Steps need to be taken to control credit risk and interest rate risk in a globally diversified fashion, while also providing adequate income (yield) in an environment of generationally low interest rates.
While I’ve spent a decent amount of time talking about eating fat turkeys, don’t let your investment portfolio become stuffed. The year-end time period is always a good time, after recovering from a food coma, to proactively review your investments. While most non-vegetarians love eating turkey, don’t be an investment ostrich with your head in the sand – now is the time to take actions into your own hands and make sure your investments are properly allocated.
Wade W. Slome, CFA, CFP®
Plan. Invest. Prosper.
DISCLOSURE: Sidoxia Capital Management (SCM) and some of its clients own a range of positions in certain exchange traded fund positions, but at the time of publishing SCM had no direct position in any other security referenced in this article. No information accessed through the Investing Caffeine (IC) website constitutes investment, financial, legal, tax or other advice nor is to be relied on in making an investment or other decision. Please read disclosure language on IC Contact page.
The Gift that Keeps on Giving

There have been numerous factors contributing to this bull market, even in the face of a slew of daunting and exhausting headlines. Contributing to the advance has been a steady stream of rising earnings; a flood of price buoying stock buybacks; and the all-important gift of growing dividends that keep on giving. Bonds have benefited to a lesser extent than stocks over the last five years in part because bonds lack the gift of rising dividend payouts. Life would be grander for bondholders, if the issuers had the heart to share generous news like this:
“Good day Mr. & Mrs. Jones. As your bond issuer, we value our mutually beneficial relationship so much that we would like to reward you as a bond investor. In addition to the 2.5% we are paying you now, we have decided to increase your annual payments by 6% per year for the next 20 years. In other words, we will increase your $2,500 in annual interest payments to over $8,000 per year. But wait…there’s more! You are such great people, we are going to increase the value of your initial $100,000 investment to $450,000.”
Does this sound too good to be true? Well, it’s not…sort of. However, the scenario is absolutely true, if you invested $100,000 in S&P 500 stocks during 1993 and held that investment until today. Unfortunately, the gift giving conversation above would be unattainable and the furthest from the truth, if you invested $100,000 into bonds. Today, if you decided to invest $100,000 in 20-year government bonds paying 2.5%, your $2,500 in annual payments will never increase over the next two decades. What’s more, by 2034 your initial principal of $100,000 won’t increase by a penny, while inflation slowly but surely crushes your investment’s purchasing power.
To illustrate the magical power of dividend compounding at a 6% CAGR, here is a chart of the S&P 500 dividend stream over the 21-year period of 1993 – 2014:

The trend of increasing dividends doesn’t appear to be slowing either. Here is a table showing the number of S&P 500 companies increasing their dividend payouts:
| COUNT OF DIVIDEND ACTIONS YEAR-TO-DATE | INCREASING THEIR DIVIDEND |
| 2014 YTD | 292 |
| 2013 | 366 |
| 2012 | 333 |
| 2011 | 320 |
| 2010 | 243 |
| 2009 | 151 |
Source: Standard and Poor’s
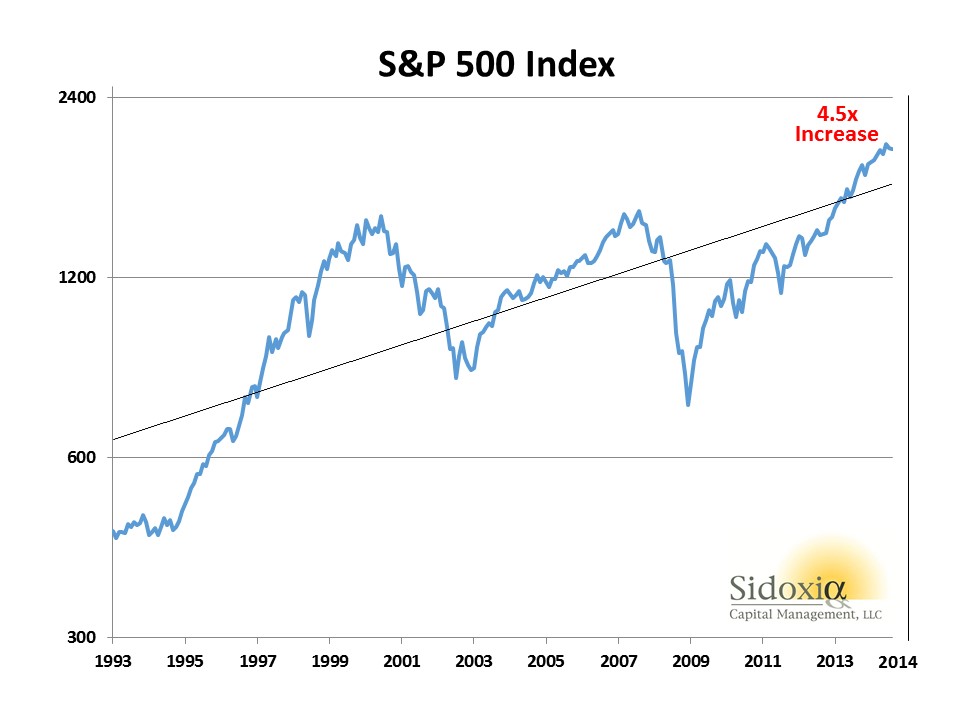
As I mentioned before, while dividends have more than tripled over the last twenty years, stock prices have gone up even more – appreciating about 4.5x’s (see chart below):
With aging demographics increasing retirement income needs, it comes as no surprise to me that the percentage of S&P 500 companies paying dividends has increased from 71% (351 companies) in 2001 to 84% (423 companies) at the end of Q3 – 2014. Interestingly, all 30 members of the Dow Jones Industrial Average currently pay a dividend. If you broaden out the perspective to all S&P Dow Jones Indices, you will discover the strength of dividends is particularly evident over the last 12 months. During this period, dividends increased by a whopping +27%, or $55 billion.
This trend in increasing dividends can also be seen through the lens of the dividend payout ratio. It is true that over longer timeframes the dividend payout ratio has been coming down (see Dividend Floodgates Widen) because of share buyback tax efficiency. Nevertheless, more recently the dividend payout ratio has drifted upwards to a range of about 32% of profits since 2011 (see chart below):

Source: FactSet
There’s no disputing the benefit of rising stock dividends. Baby Boomers, retirees, and other long-term investors are increasingly reaping the rewards of these dividend gifts that keep on giving.
Other Investing Caffeine articles on dividends:
Dividends: From Sapling to Abundant Fruit Tree
Wade W. Slome, CFA, CFP®
Plan. Invest. Prosper.
DISCLOSURE: Sidoxia Capital Management (SCM) and some of its clients hold positions in certain exchange traded funds (ETFs) including SPY, but at the time of publishing SCM had no direct position in any other security referenced in this article. No information accessed through the Investing Caffeine (IC) website constitutes investment, financial, legal, tax or other advice nor is to be relied on in making an investment or other decision. Please read disclosure language on IC Contact page.
Scrapes on the Sidewalk

Baron Rothschild, an 18th century British nobleman and member of the Rothschild banking family, is credited with the investment advice to “buy when there’s blood in the streets.” Well, with the Russell 2000 correcting about -14% and the S&P 500 -8% from their 2014 highs, you may not be witnessing drenched, bloody streets, but you could say there has been some “scrapes on the sidewalk.”
Although the Volatility Index (VIX – a.k.a., “Fear Gauge”) reached the highest level since 2011 last week (31.06), the S&P 500 index still hasn’t hit the proverbial “correction” level yet. Even with some blood being shed, the clock is still running since the last -10% correction experienced during the summer of 2011 when the Arab Spring sprung and fears of a Greek exit from the EU was blanketing the airwaves. If investors follow the effective 5-year investment playbook, this recent market dip, like previous ones, should be purchased. Following this “buy-the-dip” mentality since the lows experienced in 2011 would have resulted in stock advancing about +75% in three years.
If you have a more pessimistic view of the equity markets and you think Ebola and European economic weakness will lead to a U.S. recession, then history would indicate investors have suffered about 50% of the pain. Your ordinary, garden-variety recession has historically resulted in about a -20% hit to stock prices. However, if you’re in the camp that we’re headed into another debilitating “Great Recession” as we experienced in 2008-2009, then you should brace for more pain and grab some syringes of Novocaine.
If you’re seriously considering some of these downside scenarios, wouldn’t it make sense to analyze objective data to bolster evidence of an impending recession? If the U.S. truly was on the verge of recession, wouldn’t the following dynamics likely be in place?
- Two quarters of consecutive, negative GDP (Gross Domestic Property) data
- Inverted yield curve
- Rising unemployment and mass layoff announcements
- Declining corporate profits
- Hawkish Federal Reserve
The reality of the situation is the U.S. economy continues to expand; the yield curve remains relatively steep and positive; unemployment declined to 5.9% in the most recent month; corporate profits are at record levels and continue to grow; and the Fed has communicated no urgency to raise short-term interest rates in the near future. While the current headlines may not be so rosy, and the Ebola, eurozone, and Chinese markets may be giving you heartburn, nevertheless, the stock market has steadily climbed a wall of market worry over the last five years.
As the great Peter Lynch stated (see also Inside the Brain of an Investing Genius), “Far more money has been lost by investors preparing for corrections, or trying to anticipate corrections, than has been lost in corrections themselves.” Stated differently, Value investor Seth Klarman noted, “We can predict 10 of the next two recessions,” which highlights pundits’ inabilities of accurately predicting the next downturn (see also 100-Year Flood ≠ 100-Day Flood). As Lynch also adds, rather than trying to time the market, it is better to “assume the market is going nowhere and invest accordingly.”
Now may not be the time to dive into stocks headfirst, but many stocks have fallen -10%, -20%, and -30%, so it behooves long-term investors to take advantage of the correction. It’s true that buying when there is “blood in the streets” is an optimal strategy, but facts show this is a difficult strategy to execute. Rather than get greedy, long-term investors may be better served by opportunistically buying when there are “scrapes on the sidewalk.”
Wade W. Slome, CFA, CFP®
Plan. Invest. Prosper.
DISCLOSURE: Sidoxia Capital Management (SCM) and some of its clients hold positions in certain exchange traded funds (ETFs), but at the time of publishing SCM had no direct position in any other security referenced in this article. No information accessed through the Investing Caffeine (IC) website constitutes investment, financial, legal, tax or other advice nor is to be relied on in making an investment or other decision. Please read disclosure language on IC Contact page.