Posts tagged ‘SHGR’
Sports, Stocks, & the Magic Quadrants

Picking stocks is a tricky game and so is sports betting. With the NFL and NCAA football seasons only a few months away, we can analyze the professional sports-betting industry to better understand the complexities behind making money in the stock market. Anybody who has traveled to Las Vegas, and bet on a sporting event, understands that simply choosing a game winner is not enough for a casino to pay you winnings. You also need to forecast how many points you think a certain team will win or lose by (i.e., the so-called “spread”) – see also What Happens in Vegas, Stays on Wall Street. In the world of stocks, winning/losing is not measured by spreads but rather equities are measured by valuation (e.g., Price/Earnings or P/E ratios).
To make my point, here is a sports betting example from some years back:
Florida Gators vs. Charleston Southern Buccaneers: Without knowing a lot about the powerhouse Southern Buccaneers squad from South Carolina, 99% of respondents polled before the game are likely to unanimously select the winner as Florida – a consistently dominant, nationally ranked powerhouse program. The tougher question becomes trickier if football observers are asked, “Will the Florida Gators win by more than 63 points?”(see picture below). Needless to say, although the Buccs kept it close in the first half, and only trailed by 42-3 at halftime, the Gators still managed to squeak by with a 62-3 victory. Importantly, if you had bet on this game and placed money on the Florida Gators, the overwhelming pre-game favorite, the 59 point margin of victory would have resulted in a losing wager. In order for Gator fans to win money, they would have needed Florida to win by 64 points.

If investing and sports betting were easy, everybody would do it. The reason sports betting is so challenging is due to very intelligent statisticians and odds-makers that create very accurate point spreads. In the investing world, a broad swath of traders, market makers, speculators, investment bankers, and institutional/individual investors set equally efficient valuations over the long-term.
The goal in investing is very similar to sports betting. Successful professionals in both industries are able to consistently identify inefficiencies and then exploit them. Inefficiencies occur for a bettor when point spreads are too high or low, while investors identify inefficient prices in the marketplace by shorting expensive stocks and buying cheap stocks (i.e., undervalued or overvalued).
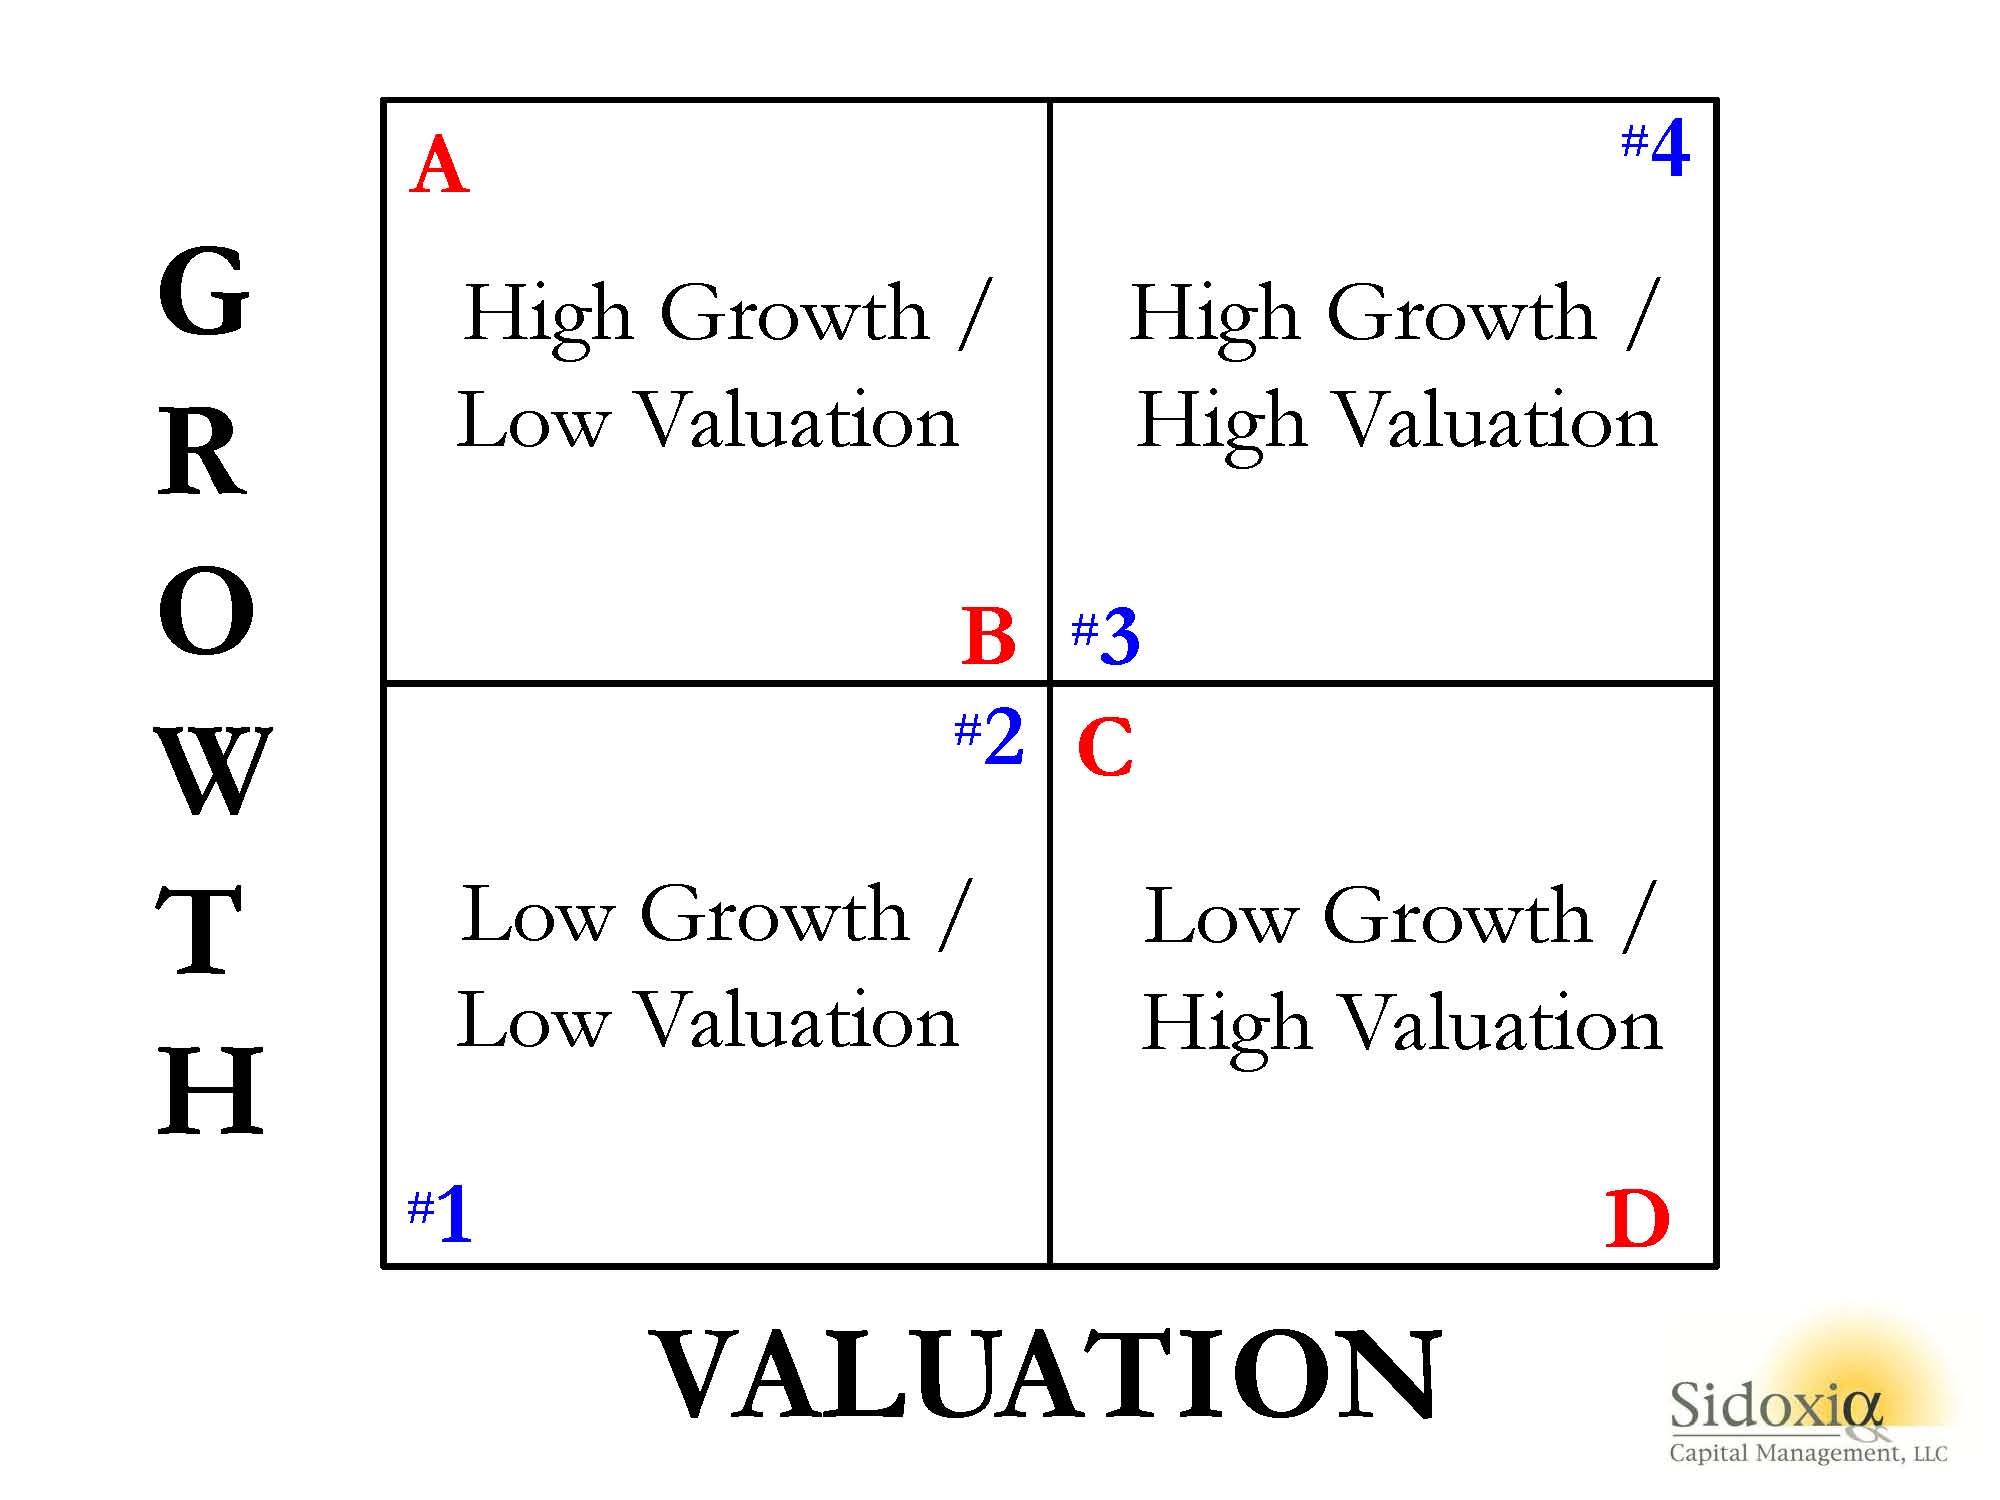
To illustrate my point, let’s take a look at Sidoxia’s “Magic Quadrant“:
 A-B-Cs & 1-2-3s
What Sidoxia’s “Magic Quadrant” demonstrates is a framework for evaluating stocks. By devoting a short period of time reviewing the quadrants, it becomes apparent fairly quickly that Stock A is preferred over Stock B, which is preferred over Stock C, which is preferred over Stock D. In each comparison, the former is preferred over the latter because the earlier letters all have higher growth, and lower (cheaper) valuations. The same relative attractive relationships cannot be applied to stocks #1, #2, #3, and #4. Each successive numbered stock has higher growth, but in order to obtain that higher growth, investors must pay a higher valuation. In other words, Stock #1 has an extremely low valuation with low growth, while Stock #4 has high growth, but an investor must pay an extremely high valuation to own it.
While debating the efficiency of the stock market can escalate into a religious argument, I would argue the majority of stocks fall in the camp of #1, #2, #3, or #4. Or stated differently, you get what you pay for. For example, investors are paying a much higher valuation (high P/E) for Tesla Motors, Inc (TSLA) for its rapid electric car growth vs. paying a much lower valuation (low P/E) for Pitney Bowes Inc (PBI) for its more mature mail equipment business.
The real opportunities occur for those investors capable of identifying companies in the upper-left quadrant (i.e., Stock A) and lower-right quadrant (i.e., Stock D). If the analysis is done correctly, investors will load up on the undervalued Stock A and aggressively short the expensive Stock D. Sidoxia has its own proprietary valuation model (Sidoxia Holy Grail Ranking – SHGR or a.k.a. “SUGAR”) designed specifically to identify these profitable opportunities.
The professions of investing and sports betting are extremely challenging, however establishing a framework like Sidoxia’s “Magic Quadrants” can help guide you to find inefficient and profitable investment opportunities.

Wade W. Slome, CFA, CFP®
Plan. Invest. Prosper.
DISCLOSURE: Sidoxia Capital Management (SCM) and some of its clients hold positions in certain exchange traded funds (ETFs) and TSLA, but at the time of publishing, SCM had no direct position in PBI, or any other security referenced in this article. No information accessed through the Investing Caffeine (IC) website constitutes investment, financial, legal, tax or other advice nor is the information to be relied on in making an investment or other decision. Please read disclosure language on IC Contact page.
Stock Market Tug-of-War

Image by © Royalty-Free/Corbis
Some things never change. There are several certainties in life, including death and taxes. And when it comes to investing, there are several other certainties: the never-ending existence of geopolitical concerns, and incessant worries over Fed policy.
Let’s face it, since the dawn of mankind, humans have been programmed to worry, whether it stemmed from avoiding a man-eating lion or foraging for food to survive (see Controlling the Investment Lizard Brain). Investors function in much the same way.
There is always a constant tug-of-war between bulls and bears, and if you are obsessed with following the relentless daily headlines about a Grexit (European Greek Exit) and an imminent Federal Reserve rate hike, you like many other investors will continue to experience sweaty palms, heart palpitations, and underperformance.
Despite the gloomy headlines, the bulls are currently winning the tug-of-war as measured by the 6-year boom in global stock prices, which has breached a record $70 trillion in value (see chart below).
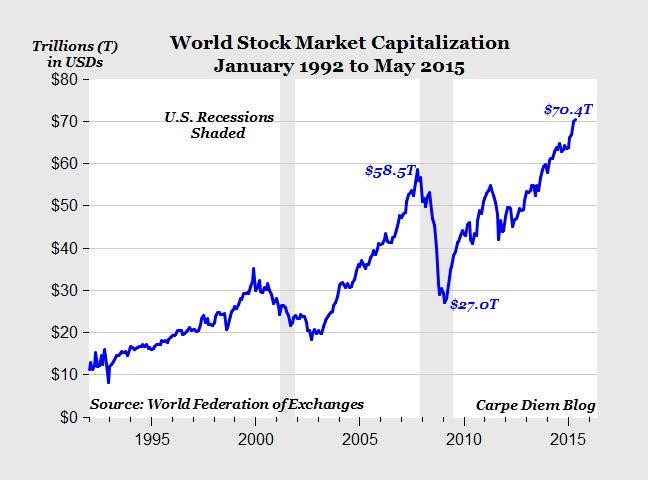
Source: Mark J. Perry (Carpe Diem)
If you become hostage and react to the headlines about Greece, China, Fed policy, Ukraine, ISIS, Russia, Ebola, North Korea, QE Tapering, etc., not only are you ignoring the key positives fueling this bull market (see also Don’t Be a Fool, Follow the Stool) but you are also costing yourself a lot of money. While I have been watching the “sideliners” for years, they have missed a market driven by generationally low interest rates; improved employment picture (10% to 5%); tame inflation; steady improvement in housing market; fiscal deficit reductions; record corporate profits; record share buybacks and dividends; contrarian investor sentiment (leaving plenty of room for converts to join the party), and other fundamentally positive factors.
Yes, stocks will eventually go down by a significant amount – they always do. Stocks can temporarily go down based on the fear du jour (like the 10-20% declines in 2010, 2011, 2012, and 2014), but the nastier hits to stock markets always come from good old fashion cyclical recessions. As I’ve discussed before, there are no signs of a recession on the horizon, and the yield curve has been a great predictor of this trigger (see Dynamic Yield Curve in Digesting Stock Gains). Until then, the bears will be fighting an uphill battle.
Independent of recession timing, investing is a very challenging game, even for the most experienced professionals. The best long-term investors, including the likes of Warren Buffett and Peter Lynch, understand the never-ending geopolitical and Fed policy headlines are absolutely meaningless over the long run. However, media outlets, blogs, newspapers, and radio shows make money by peddling fear as economic and political concerns jump like a frog from one lily pad to the next. At Sidoxia we have a disciplined and systematic approach to creating diversified portfolios with our proprietary S.H.G.R. model (“sugar”) that screens for attractively valued investments. We believe this is the way to win the long-term tug-of-war.

Wade W. Slome, CFA, CFP®
Plan. Invest. Prosper.
DISCLOSURE: Sidoxia Capital Management (SCM) and some of its clients hold positions in certain exchange traded funds (ETFs), but at the time of publishing, SCM had no direct position in any other security referenced in this article. No information accessed through the Investing Caffeine (IC) website constitutes investment, financial, legal, tax or other advice nor is to be relied on in making an investment or other decision. Please read disclosure language on IC Contact page.
Building Your All-Star NBA Portfolio

Image by © Royalty-Free/Corbis
You may or may not care, but the NBA (National Basketball Association) playoffs are in full swing. If you were an owner/manager of an NBA team, you probably wouldn’t pick me as a starting player on your roster – and if you did, we would need to sit down and talk. I played high school basketball (“played” is a loose term) in my youth, and even played in my early 40s against other over-aged veterans with knee braces, goggles, and headbands. Once my injuries began to pile up and my playing time was minimized by the spry, millennial team members, I knew it was time to retire and hang up my jockstrap.
The great thing about your investments is that you can create an All-Star NBA portfolio without the necessity of a salary market cap or billions of dollars like Mark Cuban. You can actually put the greatest professional players in the world (stocks/bonds) into your portfolio whether you invest $1,000 or $10,000,000. Sure, transactions costs can eat away at the smaller portfolios, but if investors are correctly managing their funds over years, and not months, then virtually everyone can create a cost-efficient elite team of stocks, bonds, and alternatives.
Now that we’ve established that anyone can create a championship caliber portfolio, the question then becomes, how does an owner go about selecting his/her team’s players? It may sound like a cliché, but diversification is paramount. Although centers Tim Duncan, Dwight Howard, Chris Bosh, Marc Gasol, and DeAndre Jordan may get a lot of rebounds for your team, it wouldn’t make sense to have those five starting centers on your team. The same principle applies to your investment portfolio.
Generally speaking, the best policy for investors is to establish exposure to a broad set of asset classes customized to your time horizon, risk tolerance, objectives, and constraints. In other words, it is prudent to have exposure to not only stocks and bonds, but other areas like real estate, commodities, alternatives, and emerging markets. Everybody has their own unique situation, and with interest rates and valuations continually changing, it makes sense that asset allocations across all individuals will be very diverse.
In basketball terms, the sizes and types of guards, forwards, and centers will be dependent on the objectives of the team’s owners/managers. For example, it is very logical to have Stephen Curry (see great video) as the starting guard for the fast-paced, highest scoring NBA team, Golden State Warriors but Curry would not be ideally suited for the slow, grind-em-up offense of the Utah Jazz (one of the lowest scoring teams in the NBA).
In order to build a consistent winning percentage for your portfolio, you need to have a systematic, disciplined process of choosing your all-star-team, which can’t just consist of picking the hottest player of the day. Not only could it be too expensive, the consequences of over-concentrating your portfolio with an expensive position can be painful….just ask Los Angeles Laker fans how they feel about overpaying for Kobe Bryant’s $23.5 million 2014-2015 salary. Investors who chased the overpriced tech sector in the late 1990s, with stock prices trading at over 100 times trailing 12-month earnings, understand how painful losses can be in the subsequent “bubble” burst.
Having a strong bench of players is crucial as well. This requires a research process that can prioritize opportunities based on quantitative and fundamental processes (at Sidoxia we use our SHGR model). Sometimes your starters get injured, fatigued, or bought out by a competitor. Interest rates, valuations, exchange rates, earnings growth rates and other economic factors are continually fluctuating, so having a bench of suitable investment ideas is critical for different financial environments.
Beating the market is a challenging endeavor, not only for individuals, but also for professionals. If you don’t believe me, then check out what Dalbar had to say about this subject in its annual report entitled, Quantitative Analysis of Investor Behavior:
Dalbar found that in 2014, the average investor in a stock mutual fund underperformed the S&P 500 by a margin of 8.19 percent. Fixed-income investors underperformed the Barclays Aggregate Bond Index by a margin of 4.81 percent.
Ouch! If you want to generate winning returns matching the likes of the 1,000-win club, which includes Gregg Popovich, Phil Jackson, and Pat Riley then you need to avoid some of the most common investor mistakes (see also 10 Ways to Destroy Your Portfolio). Chasing performance, ignoring diversification, emotionally reacting to news headlines, paying high fees, and over-trading are sure fire ways to get technical fouls and ejected from the investment game. Avoiding these mistakes and following a systematic, objective process will make you and your investment portfolio a successful all-star.
Wade W. Slome, CFA, CFP®
Plan. Invest. Prosper.
DISCLOSURE: Sidoxia Capital Management (SCM) and some of its clients hold positions in certain exchange traded funds (ETFs), but at the time of publishing, SCM had no direct position in any other security referenced in this article. No information accessed through the Investing Caffeine (IC) website constitutes investment, financial, legal, tax or other advice nor is to be relied on in making an investment or other decision. Please read disclosure language on IC Contact page.
The Buyback Bonanza Boost

With the S&P 500 off -1% from its all-time record high, many bears have continued to wait for and talk about a looming crash. For the naysayers, the main focus has been on the distorted monetary policies instituted by the Federal Reserve, but as I pointed out in Fed Fatigue is Setting In, QE and tapering talk are not the end-all, be-all of global financial markets. One need not look further than the dozen or so countries listed in the FT that have bond yields below the abnormally low yields we are experiencing in the U.S. (10-Year Treasury +2.75%).
Although there are many who believe a freefall is coming, much like a trampoline, a naturally occurring financial mechanism has provided a relentless bid to boost stock prices higher…a buyback bonanza! How significant have corporate stock repurchases been to spring prices higher? Jason Zweig, in his Intelligent Investor column, wrote the following:
In the Russell 3000, a broad U.S. stock index, repurchased $567.6 billion worth of their own shares—a 21% increase over 2012, calculates Rob Leiphart, an analyst at Birinyi Associates, a research firm in Westport, Conn. That brings total buybacks since the beginning of 2005 to $4.21 trillion—or nearly one-fifth of the total value of all U.S. stocks today.
To further put this gargantuan buyback bonanza into perspective, a recent Fox Business article described it this way:
Companies spent an estimated $477 billion on share buybacks last year. That’s enough to buy every NFL team 12 times over, run the federal government for 50 days or host the next nine Olympic Games with several billion left to spare. This year, companies are expected to ramp up buybacks by 35%, according to Goldman Sachs.
The bears continue to scream, while purple in the face, that the Fed’s QE and zero interest rate program (ZIRP) shenanigans are artificially propping up stock prices. The narrative then states the tapering and inevitable Fed Funds rate reversal will cause the market to come crashing down. While there is some truth behind this commentary, history reminds us that not all rate rising cycles end in bloodshed (see 1994 Bond Repeat or Stock Defeat?). Even if you believe in Armageddon, this rate reversal scenario is unlikely to happen until mid-2015 or beyond.
And for those worshipping the actions of Ms. Yellen at the Fed altar, believe it or not, there are other factors besides monetary policy that cause stock prices to go up or down. In addition to stock buybacks, there are dynamics such as record corporate profits, rising dividends, expanding earnings, reasonable valuations, improving international economies, and other factors that have contributed to this robust bull market.
At the end of the day, as I have continued to argue for some time, money goes where it is treated best – and generally that is not in savings accounts earning 0.003%. There is no reason to be a perma-bull, and I have freely acknowledged the expansion of froth in areas such as social media, biotech, Bitcoin and other areas. Regardless, there is, and will always be areas of speculation, in bull and bear markets (e.g., gold in the 2008-2009 period).
Magical Math
Investing involves a mixture of art and science, but with a few exceptions (i.e., fraud), numbers do not lie, and using math when investing is a good place to start. A simple but powerful mathematical formula instituted at Sidoxia Capital Management is the “Free Cash Flow Yield”, which is a metric we integrate into our proprietary SHGR (a.k.a.,“Sugar”) quantitative model (see Investing Holy Grail).
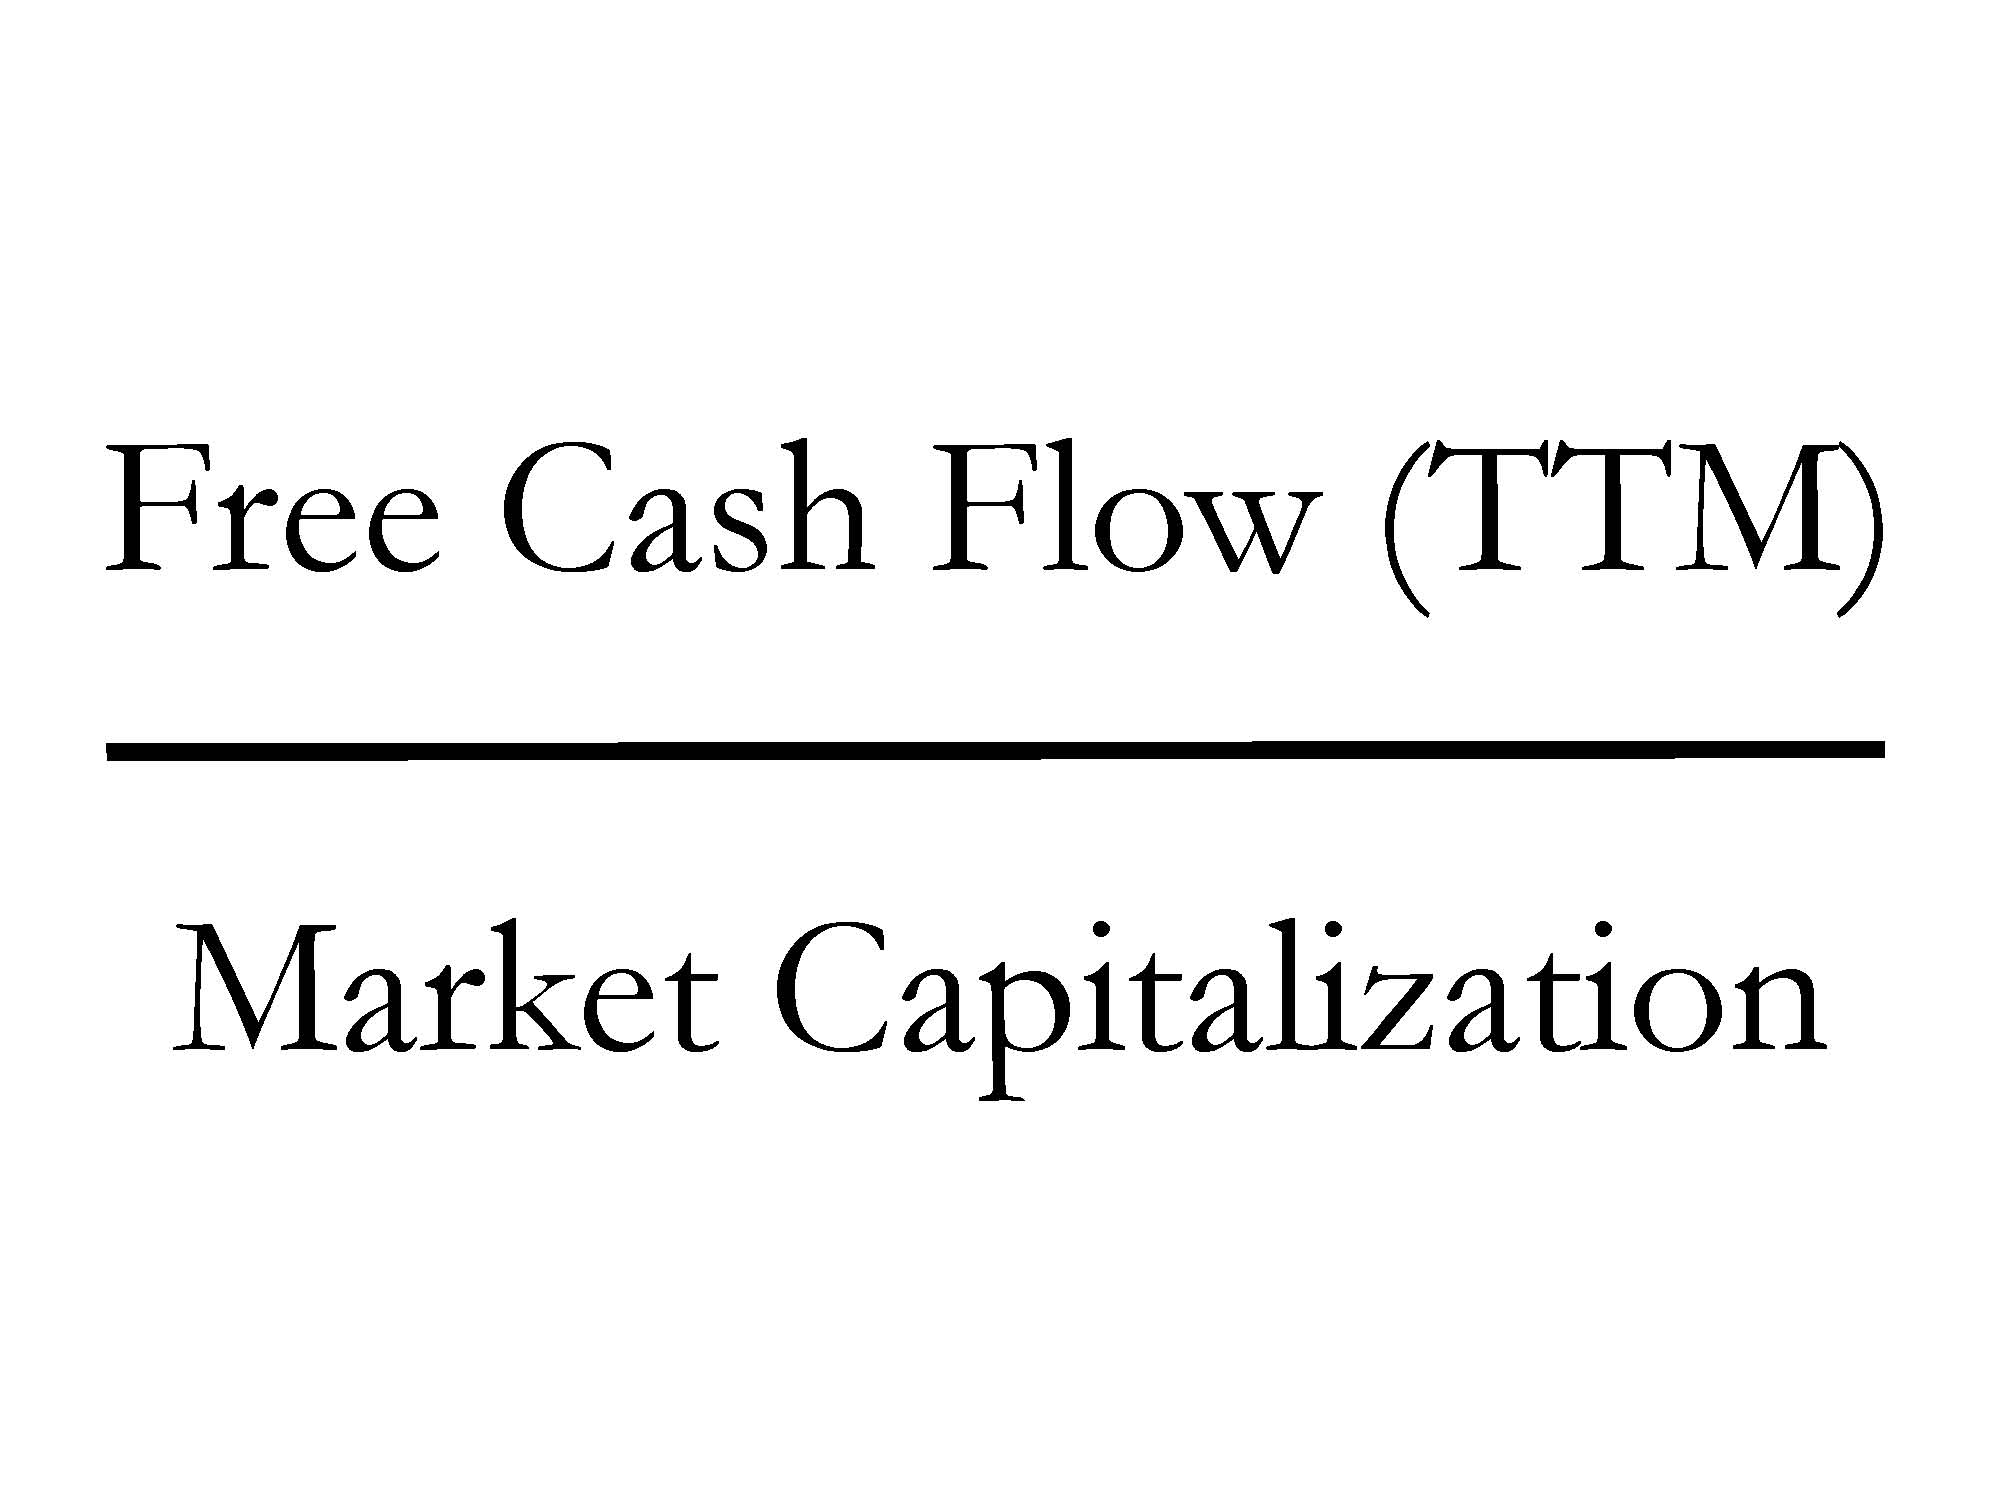
Quite simply, Free Cash Flow (FCF) is computed by taking the excess cash generated by a company after ALL expenses/expenditures (marketing, payroll, R&D, CAPEX, etc.) over a trailing twelve month period (TTM), then dividing that figure by the total equity value of a company (Market Capitalization). Mechanically, FCF is calculated by taking “Cash Flow from Operations” and subtracting “Capital Expenditures” – both figures can be found on the Cash Flow Statement. The Free Cash Flow ratio may sound complicated, but straightforwardly this is the leftover cash generated by a business that can be used for share buybacks, dividends, acquisitions, investments, debt pay-down, and/or placed in a banking account to pile up.
The great thing about FCF yields is that this ratio (%) can be compared across asset classes. For example, I can compare the FCF yield of Apple Inc – AAPL (+9.5%) versus a 10-Year Treasury (+2.75%), 1-year CD (+0.85%), Tesla Motors – TSLA (0.0%), Netflix, Inc – NFLX (-0.001%), or Twitter, Inc – TWTR (-0.003%). For growth and capital intensive companies, I can make adjustments to this calculation. However, what you quickly realize is that even if you assume massive growth in the coming years (i.e., $100s of millions in FCF), the prices for many of these momentum stocks are still astronomical.
An important insight about the current corporate buyback bonanza is that much of this price boost is being fueled by the colossal free cash flow generation of corporate America. Sure, some companies are borrowing through the debt markets to buy back stock, but if you were the Apple CFO sitting on $159,000,000,000 in cash earning 1%, it doesn’t make a lot of sense to sit on the cash earning nothing. It also doesn’t take a genius (or Carl Icahn) to figure out borrowing at record low rates (2.75% 10-year) while earning +10% on a stock buyback will increase shareholder value and earnings per share (EPS). More specifically, when Apple borrowed $17 billion at interest rates ranging from 0.5% – 3.9%, a shrewd, rational human being would borrow to the max all day long at those rates, if you could earn +10% on that investment. It is true that Apple’s profitability could drop and the numerator in our FCF ratio could decrease, but with $45 billion smackers coming in every year on top of $142 billion in net cash on the balance sheet, Apple has a healthy margin of safety to make the math work.
Where the math doesn’t compute is in insanely priced deals. For example, the recent merger in which Facebook Inc (FB) paid $19 billion (1,000 x’s the estimated 2013 annual revenues) for a 50-person, money-losing company (WhatsApp) that is offering a free service, makes zero financial sense to me. Suffice it to say, the FCF yield on WhatsApp could cause Warren Buffett to have a coronary event. Yes, diamond covered countertops would be nice to have in my kitchen, but I probably wouldn’t get much of a return on that investment.
Share buybacks are not a magical elixir to endless prosperity (see Share Buybacks & Bathroom Violators), but given the record profits and record low interest rates, basic math shows that even if stock prices correct (as should be expected), the trampolining effect of this buyback bonanza will provide support to the market.
Wade W. Slome, CFA, CFP®
Plan. Invest. Prosper.
DISCLOSURE: Sidoxia Capital Management (SCM) and some of its clients hold long positions in certain exchange traded funds (ETFs), AAPL and a short position in NFLX, but at the time of publishing SCM had no direct position in TSLA, TWTR, FB, Bitcoin, or any other security referenced in this article. No information accessed through the Investing Caffeine (IC) website constitutes investment, financial, legal, tax or other advice nor is to be relied on in making an investment or other decision. Please read disclosure language on IC Contact page.
Sports, Stocks, & the Magic Quadrants
Picking stocks is a tricky game and so is sports betting. With the NFL and NCAA football seasons swinging into full gear, understanding the complexity of making money in the stock market can be explained in terms of professional sports-betting. Anybody who has traveled to Las Vegas and bet on a sporting event, understands that choosing a winner of a game simply is not enough…you also need to forecast how many points you think a certain team will win by (see also What Happens in Vegas, Stays on Wall Street). In the world of sports, winning/losing is measured by point spreads. In the world of stocks, winning/losing is measured by valuation (e.g., Price/Earnings ratios).
To make my point, here is a sports betting example from a handful years back:
Florida Gators vs. Charleston Southern Buccaneers (September 2009): Without knowing a lot about the powerhouse Southern Buccaneers squad from South Carolina, 99% of respondents, when asked before the game who would win, would unanimously select Florida – a consistently dominant, national franchise, powerhouse program. The question becomes a little trickier when participants are asked, “Will the Florida Gators win by more than 63 points?” Needless to say, although the Buccs kept it close in the first half, and only trailed by 42-3 at halftime, the Gators still managed to squeak by with a 62-3 victory. Worth noting, had you selected Florida, the overwhelming favorite, the 59 point margin of victory would have resulted in a losing wager (see picture below).
If investing and sports betting were easy, everybody would do it. The reason sports betting is so challenging is due to very intelligent statisticians and odds-makers that create very accurate point spreads. In the investing world, a broad swath of traders, market makers, speculators, investment bankers, and institutional/individual investors set equally efficient valuations.
The goal in investing is very similar to sports betting. Successful professionals in both industries are able to consistently identify inefficiencies and then exploit them. Inefficiencies occur for a bettor when point spreads are too high or low, while investors identify inefficient prices in the marketplace (undervalued or overvalued).
To illustrate my point, let’s take a look at Sidoxia’s “Magic Quadrant“:
A-B-Cs & 1-2-3s
What Sidoxia’s “Magic Quadrant” demonstrates is a framework for evaluating stocks. By devoting a short period of time reviewing the quadrants, it becomes apparent fairly quickly that Stock A is preferred over Stock B, which is preferred over Stock C, which is preferred over Stock D. In each comparison, the former is preferred over the latter because the earlier letters all have higher growth, and lower (cheaper) valuations. The same relative attractive relationships cannot be applied to stocks #1, #2, #3, and #4. Each successive numbered stock has higher growth, but in order to obtain that higher growth, investors must pay a higher valuation. In other words, Stock #1 has an extremely low valuation with low growth, while Stock #4 has high growth, but an investor must pay an extremely high valuation to own it.
While debating the efficiency of the stock market can escalate into a religious argument, I would argue the majority of stocks fall in the camp of #1, #2, #3, or #4. Or stated differently, you get what you pay for. For example, investors are paying a much higher valuation (~100x 2014 P/E) for Tesla Motors, Inc (TSLA) for its rapid electric car growth vs. paying a much lower valuation (~10x 2014 P/E) for Pitney Bowes Inc (PBI) for its mature mail equipment business.
The real opportunities occur for those investors capable of identifying companies in the upper-left quadrant (i.e., Stock A) and lower-right quadrant (i.e., Stock D). If the analysis is done correctly, investors will load up on the undervalued Stock A and aggressively short the expensive Stock D. Sidoxia has its own proprietary valuation model (Sidoxia Holy Grail Ranking – SHGR or a.k.a. “SUGAR”) designed specifically to identify these profitable opportunities.
The professions of investing and sports betting are extremely challenging, however establishing a framework like Sidoxia’s “Magic Quadrants” can help guide you to find inefficient and profitable investment opportunities.
Wade W. Slome, CFA, CFP®
Plan. Invest. Prosper.
DISCLOSURE: Sidoxia Capital Management (SCM) and some of its clients hold positions in certain exchange traded funds (ETFs), but at the time of publishing, SCM had no direct position in TSLA, PBI, or any other security referenced in this article. No information accessed through the Investing Caffeine (IC) website constitutes investment, financial, legal, tax or other advice nor is the information to be relied on in making an investment or other decision. Please read disclosure language on IC Contact page.
Fine Tuning Your Stock Fishing Skills

If you are one of those fishing hobbyists crowded among a large group while hunting for a big fish, mathematics dictates your odds of reeling in a grand prize are significantly diminished. Expert fishermen are generally the first to arrive because they understand once the masses appear the opportunities will disappear. Like big fish, colossal stocks are rarely discovered by a large herd of investors. Financial bubbles occur in this manner, however these periods are usually short-lived and the investor pack often ends up losing more money on the way down relative to the profits earned on the way up. Successful investors are usually the ones following a disciplined systematic approach that is often contrarian in nature. In other words, not chasing performance requires patience, an elusive quality in these fast-paced, frenetic financial markets.
More prevalent in these markets are impulsive day-traders, unruly high frequency traders, and tempestuous hedge funds. Why own stocks, if you can rent them? Like a fisherman who constantly casts his/her bait in and out of the water, a short-sighted investor cannot realize outsized gains, unless the bait is given sufficient time to lure (find) the next winning idea.
Like many professions, experts often optimally mix the quantitative science and behavioral art of their craft. Whether it’s a teacher, doctor, accountant, attorney, or bus driver, the people who excel in their profession are the ones who move beyond the statistical and procedural basics of their trade. Practicing and understanding the nuts and bolts of your job is important, but developing those intangible, artistic skills only comes with experience. Unfortunately, many investing hobbyists don’t appreciate these artistic nuances and as a result go on destroying their portfolios, even though they act as if they were experts.
On the flip-side, decisions purely based on gut instincts will also lead to sub-par outcomes. The fisherman who does not account for the wind, temperature, geography, light, and seasonal differences will be at a distinct disadvantage to those who have studied these scientific factors.
In the fishing world, there is no miracle GPS device that will guide fish onto your hook, and the same is true for stocks. No software package or technical pattern will be a panacea for profits, however having some type of scientific tool to assist in the identification of investment opportunities should be exploited to its fullest. For us at Sidoxia Capital Management (www.Sidoxia.com), our tool is called SHGR (pronounced “SUGAR”), or Sidoxia Holy Grail Ranking. The name was created tongue-in-cheek; however its purpose is crucial. Following a quantitative system like SHGR ensures that a healthy dosage of discipline and objectivity is factored into our investment decisions, so inherent biases do not creep into our process and detract from performance. Specifically, our proprietary SHGR model incorporates multiple factors, including valuation, growth, sentiment indicators, profitability, and other qualitative measurements.
Although we use a “Holy Grail” ranking system, the fact of the matter is there are none in existence – for fishermen or investors. Experience teaches us the best opportunities are found where few are looking, and if proper quantitative tools are integrated into a multi-pronged process, then you will be uniquely positioned to catch a big fish.
Wade W. Slome, CFA, CFP®
Plan. Invest. Prosper.
DISCLOSURE: Sidoxia Capital Management (SCM) and some of its clients hold positions in certain exchange traded funds (ETFs) and CMCSA, but at the time of publishing SCM had no direct position in BRKB, HNZ, HRL, UL, T, VZ, CAR, ZIP, AMR, LCC, ORCL, APKT, DELL, MSFT, RDSA, Repsol, ODP, OMX, HLF, BUD, STZ, GE, or any other security referenced in this article. No information accessed through the Investing Caffeine (IC) website constitutes investment, financial, legal, tax or other advice nor is to be relied on in making an investment or other decision. Please read disclosure language on IC Contact page.


