Posts tagged ‘share buybacks’
Podcast 3/3/19: Week in Review and Share Buybacks
![]()
The Investing Caffeine podcast is designed to wake up your investment brain with weekly overviews of financial markets and other economic-related topics.
Episode 2
Market Review, Stock Ideas, and The Weekly Rant: Share Buybacks
Don’t miss out! Follow us on either SoundCloud or PodBean to get a new episode each week. Or follow our InvestingCaffeine.com blog and watch for new podcast updates each week.
SoundCloud: soundcloud.com/sidoxia
PodBean: sidoxia.podbean.com

Why the Masses Missed the 10-Year Bull Market
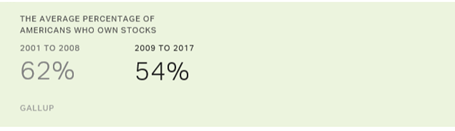
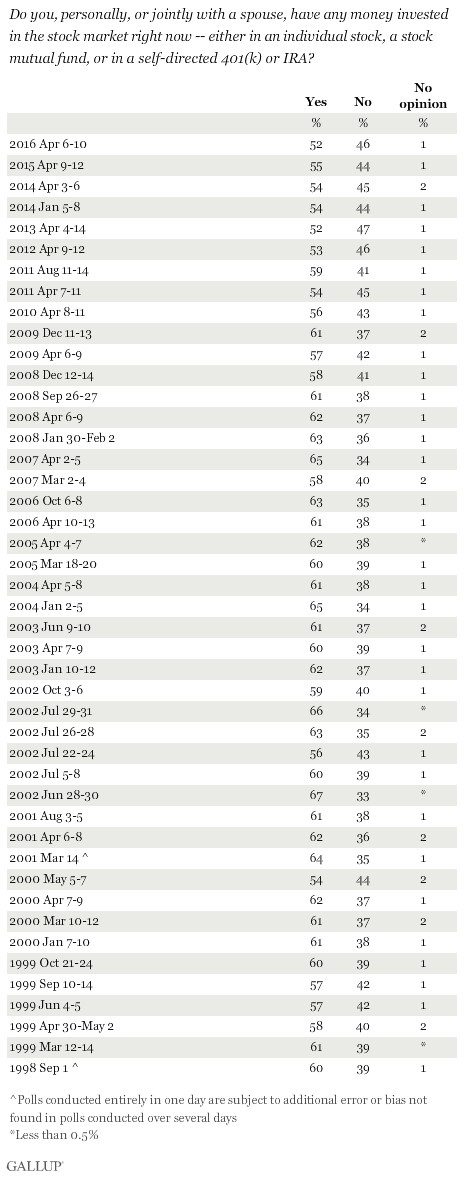
The investing masses generally are notoriously short-termed focused. Although the overall stock market notched another gain this month, stock values are still down roughly -8% from the January peak, which has caused some investor angst. Despite this nervousness, stock prices have quadrupled and the bull market has entered its 10th year after the March 2009 low (S&P 500: 666). Given this remarkable accomplishment, we can now look back and ask, “Did investors take advantage of this massive advance?” The short answer is “No.” For the most part, the fearful masses missed the decade-long, U.S. bull market. We know this dynamic to be true because data regarding stock ownership has gone down significantly, and hundreds of billions of dollars have been pulled from U.S. equity funds over the duration. For instance, Gallup, the survey and analytics company, annually polls the average percentage of Americans who own stocks and they found ownership has dropped from 62% of Americans in 2008 to 54% in 2017 (see chart below).
Much of the negativity that has dominated investor behavior over the last decade can be explained by important behavioral biases. As I describe in Controlling the Investment Lizard Brain, evolution created an almond-sized tissue in the prefrontal cortex of the brain (amygdala), which controls reasoning. Originally, the amygdala triggered the instinctual survival flight response for lizards to avoid hungry hawks and humans to flee ferocious lions. In today’s modern society, the probability of getting eaten by a lion is infinitesimal, so rather than fretting over a potential lion slaughtering, humans now worry about their finances getting eaten by financial crises, Federal Reserve interest rate hikes, and/or geopolitical risks.
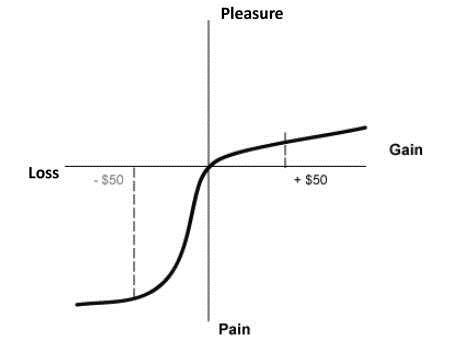
Even with the spectacular +300% appreciation in stock values from early 2009, academic research can help us understand how pessimism can outweigh optimism, even in the wake of a raging bull market. Consider the important risk aversion research conducted by Nobel Prize winner Daniel Kahneman and his partner Amos Tversky (see Pleasure/Pain Principle). Their research pointed out the pain of losses can be twice as painful as the pleasure experienced through gains (see diagram below).
Given this backdrop, how can these gargantuan gains be maintained (or improved upon) when investors are continually draining money out of riskier stocks and pouring cash into more conservative bonds? (see Fund Flows Paradox). There are several major factors that can explain the colossal gains in the face of a stock investor exodus:
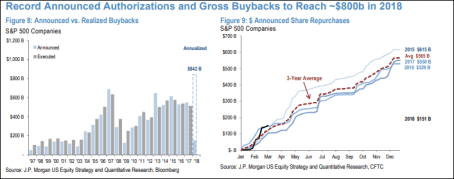
- Share Buybacks: While investors might not be buying loads of stocks, corporations have purchased trillions of dollars in stocks since the financial crisis. As you can see from the chart below, the table is set for 2018 to be a record year in share buybacks ($842 billion estimate), thanks to record profits and tax legislation that is making it cheaper for corporations to bring back foreign profits abroad.
Source: Marketwatch
- Mergers & Acquisitions (M&A): Record profits, low interest rates, and high cash levels have led to trillions of dollars in U.S. M&A activity (almost $2 trillion in 2017) – see chart below. Not all of this was funded with cash and debt, but suffice it to say, enormous amounts of equity have been removed from the stock market.
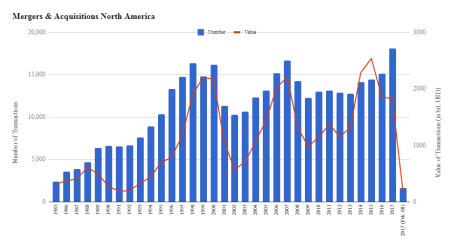
Source: IMAA Institute
- Limited IPOs: Certainly, we have seen a few high-profile, stock deals hit the market in the form of initial public offerings (IPOs) over the last year. Some prominent IPOs over the last year, include Dropbox Inc. (DBX), Spotify Technology (SPOT), and Snap Inc. (SNAP), however this limited supply of new deals is a drop in the bucket. As you can see from the chart below, the number of IPOs is significantly below the 1999-2000 peak and the recent added supply pales in comparison to the latest supply-sucking share buybacks and acquisitions.

Source: Statista
Just as important as these supply related issues are to the stock market, demand related issues are important as well. While individual U.S. investors have been scarred by the 2008-2009 financial crisis, ultimately, over the long run, money does not care about behavioral biases. Money goes where it is treated best. Theoretically, the best treatment could be in U.S. stocks or U.S. bonds, or it could be in pork bellies or the Thai baht currency, among many other asset classes (e.g., real estate, commodities, venture capital, Bitcoin, etc.). Much like a trip to the grocery store, global money flows search for the best deals. If beef prices spike by +30% and chicken prices drop by -20%, guess what? Shoppers will now buy more chicken and less beef. Similarly, when Japanese 10-year bonds are yielding 0.04%, German 10-year bonds 0.56%, and U.K. 10-year bonds 1.42%, then U.S. 10-year Treasuries with a 2.96% yield don’t look so bad.
More importantly, as it relates to stock prices, there has been a mass divergence between the interest rate yields earned on Treasuries and the earnings yield (E/P or the inverse P/E ratio) since this 10-year bull market began (Ed Yardeni has a great chart of this Fed Valuation chart). Stocks, as they are valued today, are effectively providing double the yield of bonds (roughly a 6% yield vs 3% yield, respectively). As long as this phenomenon remains intact over the medium term, stocks could continue to significantly outperform bonds. Eventually a spike in stock prices and/or an earnings decline caused by a recession will lower the earnings yield on stocks, but until then, nervous investors will likely continue to underperform.
What the almost 10-year bull market teaches us is that our behavioral shortcomings can be a drag on performance and stock values, but the economic laws of supply and demand can play an even more significant role in the direction of the stock market. Learning how to control your lizard brain (amygdala), and understand how the pain of losses (risk aversion) can distort decision making processes can help you more clearly see how record profits (see chart below), share buybacks, M&A activity, and limited stock issuance (i.e. IPOs) will impact stock prices. Understanding these lessons will better prepare the masses in navigating through future bull and bear markets.
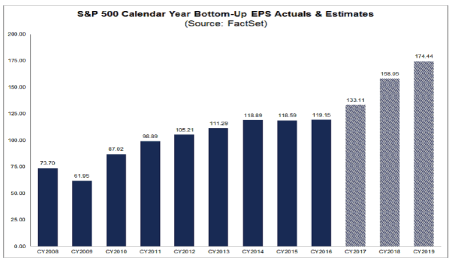
Source: FACTSET

Wade W. Slome, CFA, CFP®
Plan. Invest. Prosper.
This article is an excerpt from a previously released Sidoxia Capital Management complimentary newsletter (May 1, 2018). Subscribe on the right side of the page for the complete text.
DISCLOSURE: Sidoxia Capital Management (SCM) and some of its clients hold positions in certain exchange traded funds (ETFs), but at the time of publishing had no direct position in DBX, SPOT, SNAP, or any other security referenced in this article. No information accessed through the Investing Caffeine (IC) website constitutes investment, financial, legal, tax or other advice nor is to be relied on in making an investment or other decision. Please read disclosure language on IC Contact page.
Investors Perilously Wait for Goldilocks Market

Like Goldilocks searching for the “just right” porridge, chair size, and bed, so too are investors searching for the Goldilocks stock market that is not too hot or too cold. Many are aptly calling this the “most hated” bull market in recent history as Goldilock investors have decided to stay home rather than look for an investment prize. What many investors don’t quite realize is that waiting too long for an elusive, perfect Goldilocks scenario will only lead to your portfolio getting eaten by unhappy bears.
Waiting on the sidelines for a perfect buy signal is a hopeless endeavor (see also Getting Off the Market Timing Treadmill). The evidence for extreme risk aversion is extensive. From a corporate standpoint, it’s clear executives and board members have been scarred by the 2008-2009 financial crisis. Management teams have been quick to cut expenses and slow to invest and hire. And speaking of hiring, the post-crisis expansion has led to the slowest job recovery since World War II.
In the face of all the investor pessimism, the economy has been adding a few million jobs per year on average, resulting in a unemployment level below 5%; corporate profits at/near record levels; and trillions of dollars of cash piling up on corporate balance sheets. Rather than accelerate investments, companies have by and large chosen to spend that mountain of cash into trillions of rising dividends and share buybacks.
Risk aversion is evident at the individual level as well. Part of the explanation of why corporations have increased dividends to record levels is due to 76 million Baby Boomers approaching or entering retirement. Boomers need more income just as interest rates are rapidly approaching 0%, and in many cases negative interest rates, which effectively means they are earning $0 on their bank savings and losing to inflation.
Collecting fatter dividend checks from stocks actually sounds pretty attractive when individual investors are scared silly about geopolitics, terrorism, elections, Zika virus, and other horror story headlines of the day. Fortunately, it’s profits, interest rates, valuations, and contrarian sentiment indicators that control the stock market (see Follow the Stool), and not Fox, CNN, ABC, NBC, and internet bloggers (myself included).
With all this scary news, no wonder investors are afraid to invest. Gallup conducted a survey earlier this year asking investors whether they were invested in the stock market. With the stock market at or near record all-time highs, stock ownership should be up…right? Wrong! The Gallup results showed stock ownership at its lowest level in 18 years, as long as results have been tabulated (1998).
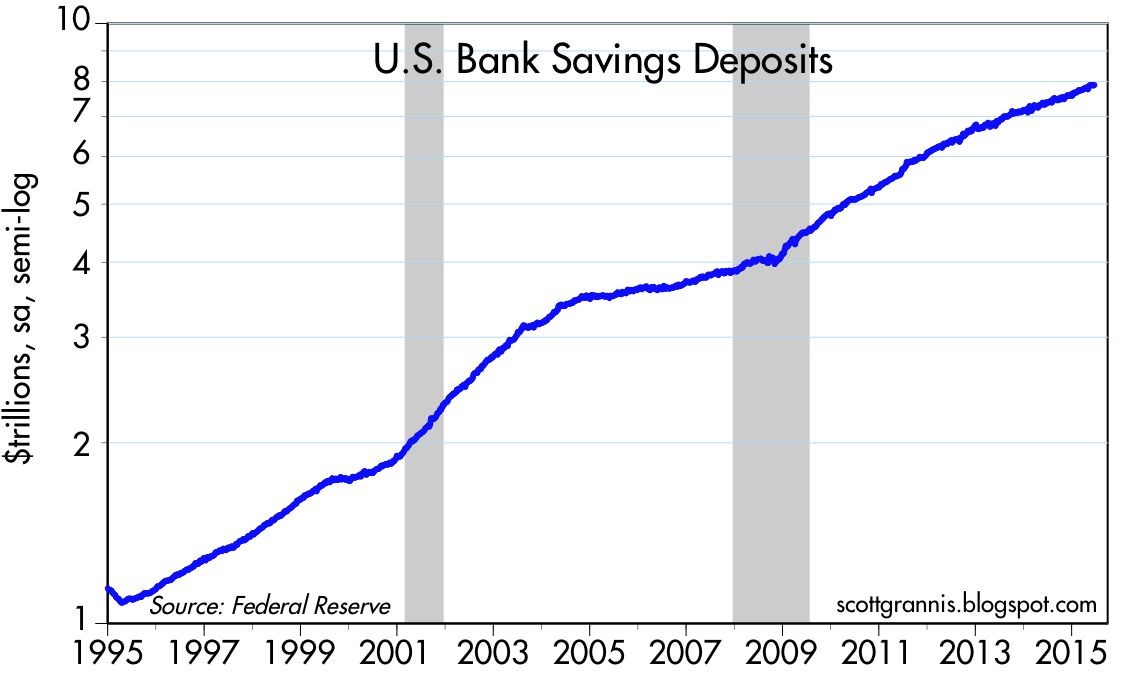
In case you are still skeptical, we can point to other evidence of investor skepticism. If you believe, like I do, that actions speak louder than words, then the actions of individuals are screaming with risk aversion at the top of their lungs. In order to understand how frightened individuals are, all you have to do is look at the more than $8 trillion (with a “t”) of cash sitting in personal savings accounts earning nothing (see chart below).

Source: Calafia Beach Pundit
You can see from the chart above, the slope of cash accumulation accelerated at a steeper slope after the Great Recession. Besides allowing the mountain of cash to pile up, what else have investors been doing with their greenbacks? One thing for sure is individuals have been spooked into paying down debt (reducing leverage), as you can see from the chart below.
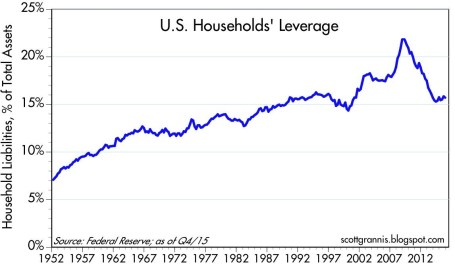
Source: Calafia Beach Pundit
As Warren Buffett reminds investors, it is best to “buy fear, and sell greed.” There is plenty of other evidence, including the examples above, that shows most average investors are destructive by doing the opposite…they buy greed, and sell fear. Sadly, sitting on the sidelines with cash stuffed under your mattress, earning nothing and losing to inflation, is not the optimal strategy for long-term wealth creation and preservation. Investors can continue waiting for Goldilock conditions, but unfortunately, history reminds us that market timing, sideline-sitters are likely to get eaten by the bears.
Wade W. Slome, CFA, CFP®
Plan. Invest. Prosper.
DISCLOSURE: Sidoxia Capital Management (SCM) and some of its clients hold positions in certain exchange traded funds (ETFs), but at the time of publishing had no direct position in any other security referenced in this article. No information accessed through the Investing Caffeine (IC) website constitutes investment, financial, legal, tax or other advice nor is to be relied on in making an investment or other decision. Please read disclosure language on IC Contact page.
Stock Market Tug-of-War

Image by © Royalty-Free/Corbis
Some things never change. There are several certainties in life, including death and taxes. And when it comes to investing, there are several other certainties: the never-ending existence of geopolitical concerns, and incessant worries over Fed policy.
Let’s face it, since the dawn of mankind, humans have been programmed to worry, whether it stemmed from avoiding a man-eating lion or foraging for food to survive (see Controlling the Investment Lizard Brain). Investors function in much the same way.
There is always a constant tug-of-war between bulls and bears, and if you are obsessed with following the relentless daily headlines about a Grexit (European Greek Exit) and an imminent Federal Reserve rate hike, you like many other investors will continue to experience sweaty palms, heart palpitations, and underperformance.
Despite the gloomy headlines, the bulls are currently winning the tug-of-war as measured by the 6-year boom in global stock prices, which has breached a record $70 trillion in value (see chart below).
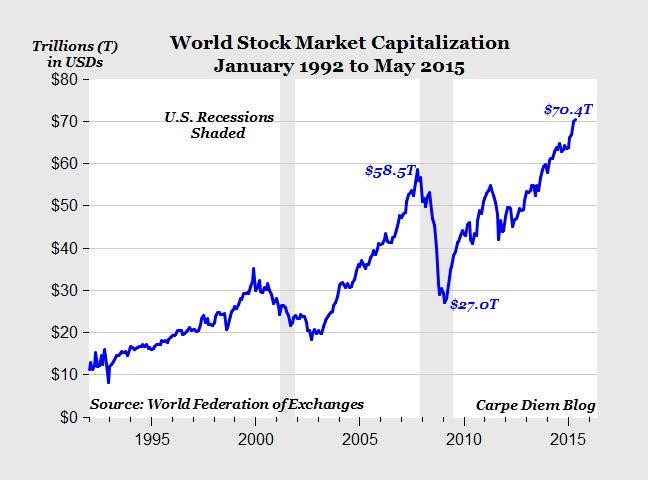
Source: Mark J. Perry (Carpe Diem)
If you become hostage and react to the headlines about Greece, China, Fed policy, Ukraine, ISIS, Russia, Ebola, North Korea, QE Tapering, etc., not only are you ignoring the key positives fueling this bull market (see also Don’t Be a Fool, Follow the Stool) but you are also costing yourself a lot of money. While I have been watching the “sideliners” for years, they have missed a market driven by generationally low interest rates; improved employment picture (10% to 5%); tame inflation; steady improvement in housing market; fiscal deficit reductions; record corporate profits; record share buybacks and dividends; contrarian investor sentiment (leaving plenty of room for converts to join the party), and other fundamentally positive factors.
Yes, stocks will eventually go down by a significant amount – they always do. Stocks can temporarily go down based on the fear du jour (like the 10-20% declines in 2010, 2011, 2012, and 2014), but the nastier hits to stock markets always come from good old fashion cyclical recessions. As I’ve discussed before, there are no signs of a recession on the horizon, and the yield curve has been a great predictor of this trigger (see Dynamic Yield Curve in Digesting Stock Gains). Until then, the bears will be fighting an uphill battle.
Independent of recession timing, investing is a very challenging game, even for the most experienced professionals. The best long-term investors, including the likes of Warren Buffett and Peter Lynch, understand the never-ending geopolitical and Fed policy headlines are absolutely meaningless over the long run. However, media outlets, blogs, newspapers, and radio shows make money by peddling fear as economic and political concerns jump like a frog from one lily pad to the next. At Sidoxia we have a disciplined and systematic approach to creating diversified portfolios with our proprietary S.H.G.R. model (“sugar”) that screens for attractively valued investments. We believe this is the way to win the long-term tug-of-war.

Wade W. Slome, CFA, CFP®
Plan. Invest. Prosper.
DISCLOSURE: Sidoxia Capital Management (SCM) and some of its clients hold positions in certain exchange traded funds (ETFs), but at the time of publishing, SCM had no direct position in any other security referenced in this article. No information accessed through the Investing Caffeine (IC) website constitutes investment, financial, legal, tax or other advice nor is to be relied on in making an investment or other decision. Please read disclosure language on IC Contact page.
F.U.D. and Dividend Shock Absorbers
As the existential question remains open on whether Greece will remain a functioning entity within the eurozone, investor anxiety and manic behavior continues to be the norm. Rampant fear seems very counterintuitive for a stock market that has more than tripled in value from early 2009 with the S&P 500 index only sitting -3% below all-time record highs. Common sense would dictate that euphoric investor appetites have contributed to years of new record highs in the U.S. stock market, but that isn’t the case now. Rather, the enormous appreciation experienced in recent years can be better explained by the trillions of dollars directed towards buoyant share buybacks and mergers.
With a bull market still briskly running into its sixth year, where can we find the evidence for all this anxiety? Well, if you don’t believe all the nail biting concerns you hear from friends, family members, and co-workers about a Grexit (Greek exit from the euro), Chinese stock market bubble, Puerto Rico collapse, and/or impending Fed rate hike, then here are a few confirming data points.
For starters, let’s take a look at the record $8 trillion of cash being stuffed under the mattress at near 0% rates in savings deposits (see chart below). The unbelievable 15% annual growth rate in cash hoarding since the turn of the century is even scarier once you consider the massive value destruction from the eroding impact of inflation and the colossal opportunity costs lost from gains and yields in alternative investments.
Next, you can witness the irrational risk averse behavior of investors piling into low (and negative) yielding bonds. Case in point are the 10-year yields in developing countries like Germany, Japan, and the U.S. (see chart below).
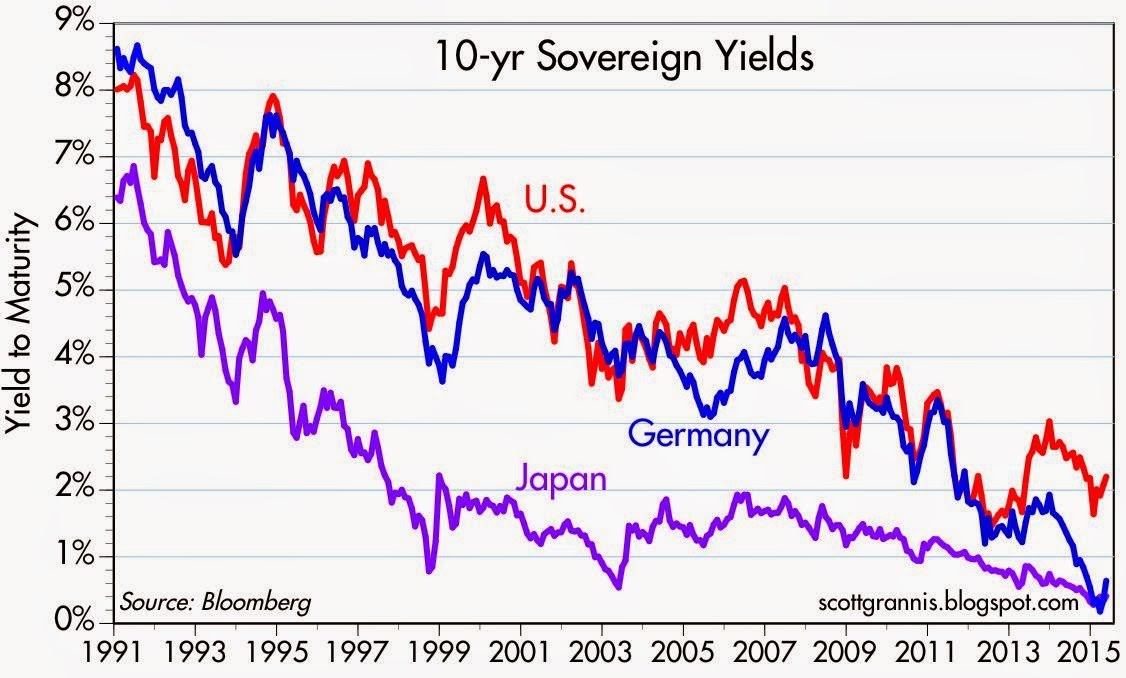
The 25-year downward trend in rates is a very scary development for yield-hungry investors. The picture doesn’t look much prettier once you realize the compensation for holding a 30-year bond (currently +3.2%) is only +0.8% more than holding the same Treasury bond for 10 years (now +2.4%). Yes, it is true that sluggish global growth and tame inflation is keeping a lid on interest rates, but these trends highlight once again that F.U.D. (fear, uncertainty, and doubt) has more to do with the perceived flight to safety and high bond prices (low bond yields).
In addition, the -$57 billion in outflows out of U.S. equity funds this year is further evidence that F.U.D. is out in full force. As I’ve noted on repeated occasions, when the tide turns on a sustained multi-year basis and investors dive head first into stocks, this will be proof that the bull market is long in the tooth and conservatism should be the default posture.
Dividend Shock Absorbers
There are always plenty of scary headlines that tempt investors to bail out of their investments. Today those alarming headlines span from Greece and China to Puerto Rico and the Federal Reserve. When the winds of fear, uncertainty, and doubt are fiercely swirling, it’s important to remember that any investment strategy should be constructed in a diversified manner that meshes with your time horizon and risk tolerance.
Consistent with maintaining a diversified portfolio, owning reliable dividend paying stocks is an important component of investment strategy, especially during volatile periods like we are experiencing currently. Sure, I still love to own high octane, non-dividend growth stocks in my personal and client portfolios, but owning stocks with a healthy stream of dividends serve as shock absorbers in bumpy markets with periodic surprise potholes.
As I’ve note before, bond issuers don’t call up investors and raise periodic coupon payments out of the kindness of their hearts, but stock issuers can and do raise dividends (see chart below). Most people don’t realize it, but over the last 100 years, dividends have accounted for approximately 40% of stocks’ total return as measured by the S&P 500.
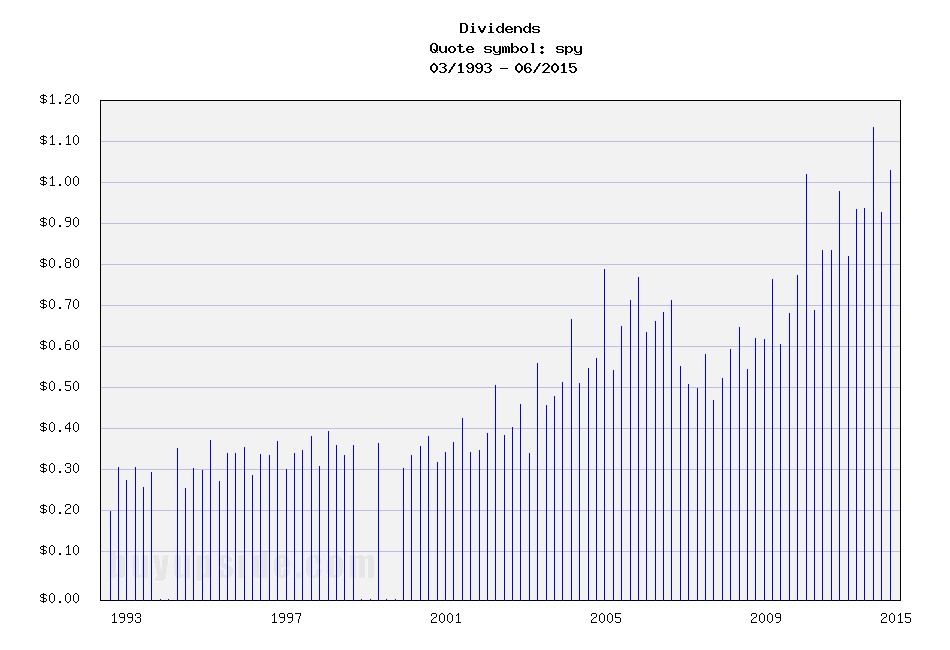
Source: BuyUpside.com
Markets will continue to move up and down on the news du jour, but dividends overall remain fairly steady. In the worst financial crisis in a generation, dividends dipped temporarily, but as I explain in a previous article (The Gift that Keeps on Giving), dividends have been on a fairly consistent 6% growth trajectory over the last two decades. With corporate dividend payout ratios well below long term historical averages of 50%, companies still have plenty of room to maintain (and grow) dividends – even if the economy and corporate profits slow.
Don’t succumb to all the F.U.D., and if you feel yourself beginning to fall into that trap, re-evaluate your portfolio to make sure your diversified portfolio has some shock absorbers in the form of dividend paying stocks. That way your portfolio can handle those unexpected financial potholes that repeatedly pop up.
Wade W. Slome, CFA, CFP®
Plan. Invest. Prosper.
DISCLOSURE: Sidoxia Capital Management (SCM) and some of its clients hold positions in certain exchange traded funds (ETFs) and SPY, but at the time of publishing, SCM had no direct position in any other security referenced in this article. No information accessed through the Investing Caffeine (IC) website constitutes investment, financial, legal, tax or other advice nor is to be relied on in making an investment or other decision. Please read disclosure language on ICContact page.
Supply & Demand: The Lesson of a Lifetime

Between all the sporting events, road trips, and parties, I had a difficult time balancing my academic responsibilities just like any other college student. Nonetheless, after a few jobs and a few decades post my graduation, it is refreshing to see my economics college degree was able to teach me one valuable lesson…”supply & demand” actually works.
Emotions and animal spirits can separate fact from fiction in the short-run, but over the long-run, the economic forces of “supply & demand” will ultimately determine the direction of asset prices. If you can think of any bubble market, ranging from tulips and tech stocks (see Bubbles and Naps) to commodities and houses, sooner or later new supply will enter the market, and/or some other factor, which will prick the demand side of the bubble equation.
The same economic rules apply to currencies. Gut-based, day-traders may be skeptical, but economics’ longest enduring axiom shined last week when we saw the Swiss franc spike +20% against the euro in a single day. On the heels of a weakening euro currency and heightened demand for the franc, the Swiss National Bank (SNB) decided to remove its artificial peg to the euro. Effectively, the SNB has been selling francs and buying $490 billion in reserves (the majority of which is in euros and U.S. dollars). As a result, exports of Swiss army knives, watches, and industrial equipment will be more expensive now, which could potentially crimp demand for the country’s goods and services. The SNB, however, could no longer afford to buy euros and dollars to artificially depress the franc. Swiss bankers were very worried about the possible amplified costs of a currency war in the face of this week’s expected European Central Bank (ECB) announcements on quantitative easing (QE) monetary stimulus, so they decided to allow the franc to free-float versus global currencies.
Another asset class heavily impacted by volatile supply-demand dynamics has been the oil market. Weaker demand from Europe/Russia combined with the higher supply from U.S. shale has created a recipe for a crude price collapse (> -50% declines over the last year). Thus far, OPEC (Organization of Petroleum Exporting Countries) has remained committed to maintaining its supply/production levels.
Interest Rates and Supply-Demand
Not every asset price is affected by direct supply-demand factors. Take for example the stock market. I have been writing and commentating about the fascinating persistence and accelerated decline in global interest rates recently (see Why 0% Rates?). Near-0% rates are important because interest rates are just another name for the “cost of money” (or “opportunity cost of money”). When the Prime Rate was 20% in the early 1980s, the cost of money was high and a 16% CD at the bank looked pretty attractive relative to rolling the dice on volatile/risky stocks. Any economics, finance, or accounting student knows through their studies of the “time value of money” that interest rates have a tight inverse correlation to asset values (i.e., lower interest rates = higher asset values, and vice versa).
More practically speaking, we see stock prices supported by the lower borrowing costs tied to low interest rates. Just look at the $500,000,000,000+ conducted in share buybacks over the past 12 months (chart below). Economics works quite effectively when you can borrow at 3% and then purchase your own stock yielding 6% (the inverse percentage of the current 16x P/E ratio). What makes this mathematical equation even more accretive for corporate CFOs is the 6% rate earned today should double to 12% in 10 years, if a company resembles an average S&P 500 company. In other words, S&P 500 earnings have historically grown at a 7% annual clip, therefore the 6% earnings yield should double to 12% in about a decade, based on current prices. This basic arbitrage strategy is a no-brainer for corporate execs because it provides instantaneous EPS (earnings per share) growth with minimal risk, given the current bullet proof status of many blue-chip company balance sheets.

Source: Financial Times
I have provided a few basic examples of how straightforward supply-demand dynamics can be used to analyze market relationships and trends. Although supply-demand analysis is a great rudimentary framework at looking at markets and various asset classes, unanticipated exogenous factors such regulation, terrorism, politics, weather, and a whole host of other influences can throw a wrench into your valuation conclusions. Until rates normalize, the near-0% interest rates we are experiencing now will continue to be a significant tailwind for stock prices. As interest rates have been declining for the last three and a half decades, it appears I still have time before I will need to apply the other important concept I learned in college…mean reversion.
Wade W. Slome, CFA, CFP®
Plan. Invest. Prosper.
DISCLOSURE: Sidoxia Capital Management (SCM) and some of its clients own a range of positions, including positions in certain exchange traded funds positions , but at the time of publishing SCM had no direct position in any other security referenced in this article. No information accessed through the Investing Caffeine (IC) website constitutes investment, financial, legal, tax or other advice nor is to be relied on in making an investment or other decision. Please read disclosure language on IC Contact page.
Winning via Halftime Adjustments
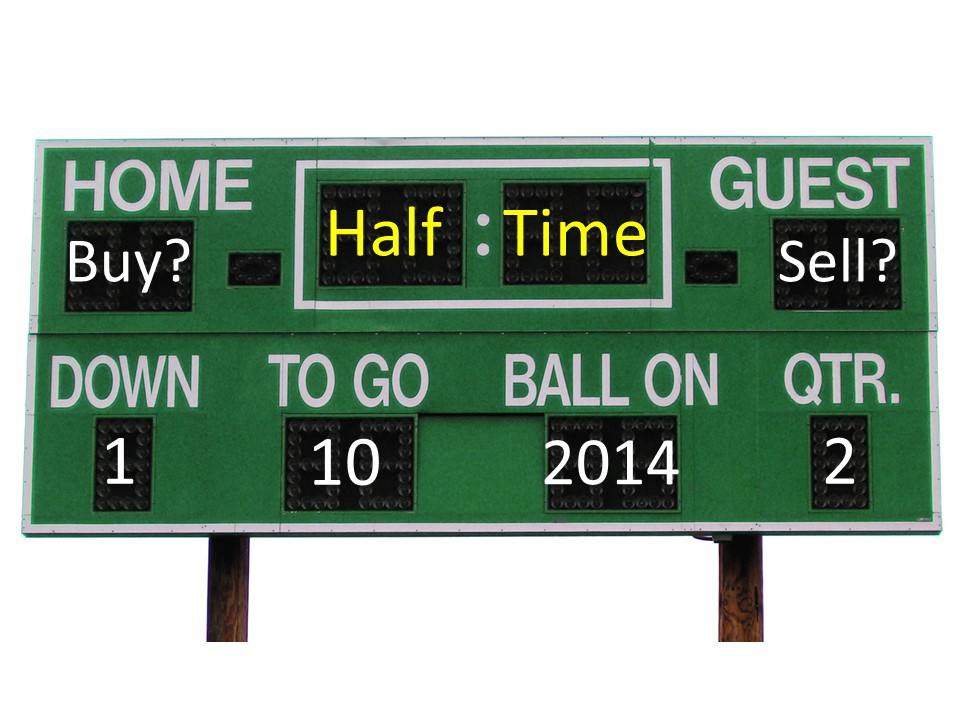
This article is an excerpt from a previously released Sidoxia Capital Management complementary newsletter (July 1, 2014). Subscribe on the right side of the page for the complete text.
In the game of sports and investing there are a lot of unanticipated dynamics that occur during the course of a game, season, or year. With the second quarter of 2014 now coming to a close, we have reached the half-way point of the year. Along the way, the coach (and investors) may need to make some strategic halftime adjustments. Reassessing or reflecting on the positioning of your investment portfolio once or twice per year in the context of your investment objectives, time horizon, and risk tolerance level is never a bad idea – especially when there are unforeseen events continually materializing during the game.
During the first half of the year, the financial markets have experienced numerous surprises:
- Declining Interest Rates: Under the auspices of a massive 2013 gain in stock prices, expectations were for an accelerating economy and rising interest rates in 2014. Instead, the 10-Year Treasury Note has seen its yield counterintuitively plunge from 3.03% to 2.52%.
- Geopolitical Tensions (Ukraine/Syria/Iraq): The stock market has ground higher this year in spite of geopolitical tensions in Ukraine, Syria, and now Iraq. These skirmishes make for great TV, radio, and blog content, but the reality is these conflicts will likely be forgotten/ignored in favor of other fresher clashes in the coming months and quarters.
- Unabated Tapering: It’s true the Federal Reserve signaled the reduction in its bond buying stimulus program last year, however the more surprising aspect has been the pace of the taper. From the beginning of the year, the $85 billion program has already been reduced to $35 billion and will likely be reduced to $0 by the fall.
- Polar Vortex/GDP: Weather is very unpredictable, and regardless of your views on global warming, the unseasonably cold weather on the eastern half of the country had a severely negative impact on first half GDP (Gross Domestic Product). In fact, first quarter GDP was revised lower to a contraction of -2.9%. The good news is expectations are for an improved second half of the year according to Merrill Lynch.
While it would be wonderful to live in Utopia, unfortunately for investors, there is always uncertainty and risk. These elements come with the investing territory. Of course, you can always compensate for that unwanted uncertainty by accepting low interest-paying options (e.g., stuffing your money under a mattress, in a CD, savings account, Treasury bonds, etc.).
Despite the unexpected first half events, the market continues to grind higher. During the first half of the year, the S&P 500 index rose 6.1% (+1.9% in June); the Dow Jones Industrials edged higher by +1.5% (+0.7% in June); and the Nasdaq climbed +5.5% (+3.9% in June). But stocks weren’t the only winning investment team in town – bonds tasted victory during the first half also, notching gains of +2.8% (AGG – Aggregate Bond), almost double the Dow’s performance.
Investor Psyche Pendulum Swinging in Positive Direction
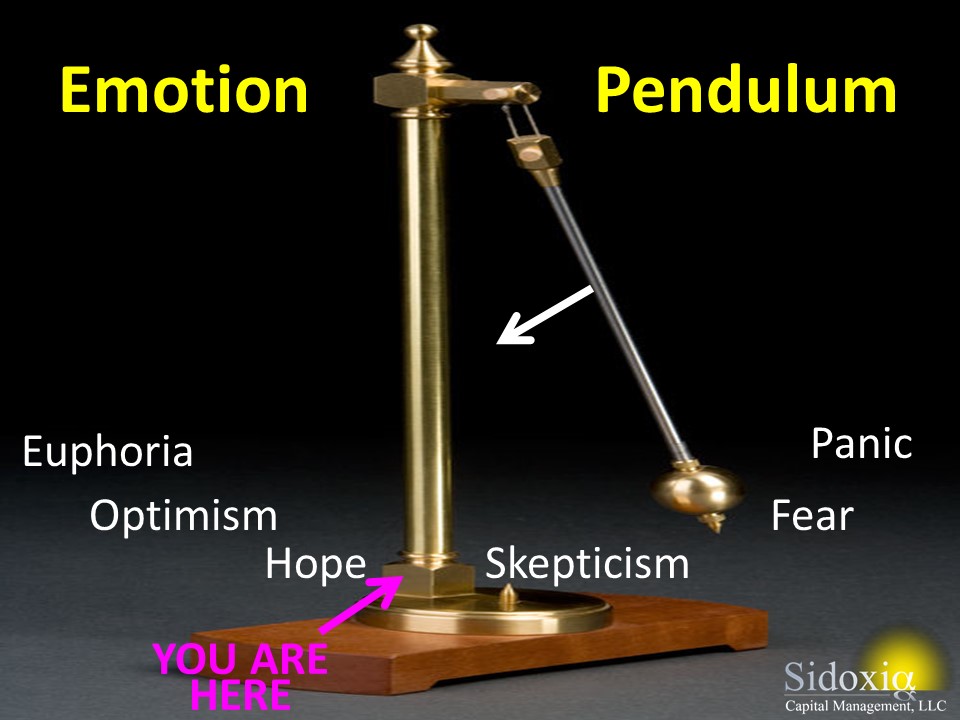
As I have written in the past, investor psyches continually swing along an emotional pendulum (see also Sentiment Pendulum article) from a state of “Panic” to “Euphoria”. While the pendulum has clearly swung in a positive direction, away from the emotional states of “Panic & Fear,” we appear to now be between “Skepticism & Hope.” The timing of when we get to the latter stages of “Optimism & Euphoria” is dependent on the pace of the economic recovery, risk appetites of consumers/businesses, and the trajectory of risky assets like stocks. Just because the ride has been fun for the last five years, does not mean the ride is over. However, as the pendulum continues to swing to the left, long-term investors need to fight the tempting urge to increase risk appetite just as the allure of high stock returns appears more achievable.
During the second half of this economic cycle, before the next recession, investors need to be more cognizant of controlling risk (the probability of permanent losses) by paying closer attention to valuations, diversification, and rebalancing too heavily weighted equity portfolios.
Besides rising stock prices and the beginning of positive fund flows, investors’ increasing appetite for risk is evidenced by the yield chasing occurring in junk bonds, which has raised prices of the lowest quality bonds to lofty levels. The chart below shows this phenomenon happening with the yields narrowing between high yield (HY) bonds and investment grade (IG) corporate bonds.
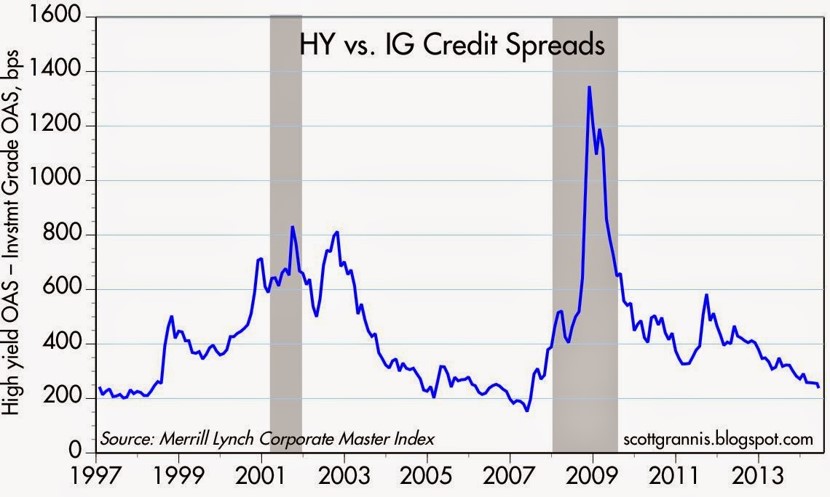
Source: Calafia Beach Pundit
Even though I pointed out a number of disconcerting surprises in the first half of the year, as you consider making halftime adjustments to your portfolios, do not forget some of the underlying positive currents that are leading to a winning halftime score.
Here are some of the constructive factors supporting stock prices, which have nearly tripled in value from the 2009 lows (S&P 500 – 666 to 1,960):
Record Corporate Profits: I constantly bump into skeptics who fail to realize the fundamental power of record profits driving stock prices higher (see chart below). As the late John Templeton stated, “In the long run, the stock market indexes fluctuate around the long-term upward trend of earnings per share.”
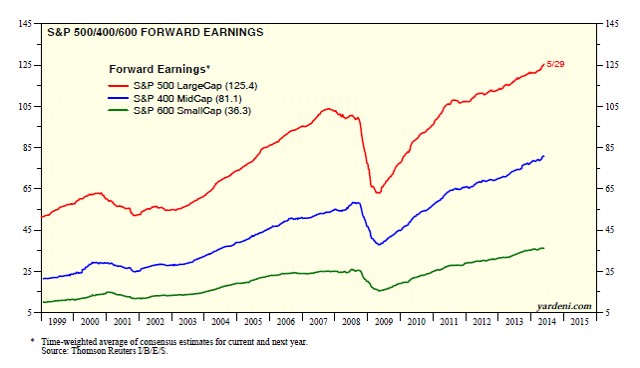
Source: Dr. Ed’s Blog
Improving Consumer Confidence: The University of Michigan consumer sentiment index increased to 82.5 for June from May. The confidence score came in above the consensus forecast of 82.0. Confidence has increased significantly from the 2009 lows but as the chart below shows, there is plenty of room for this metric to advance – consistent with the emotion pendulum discussed previously.
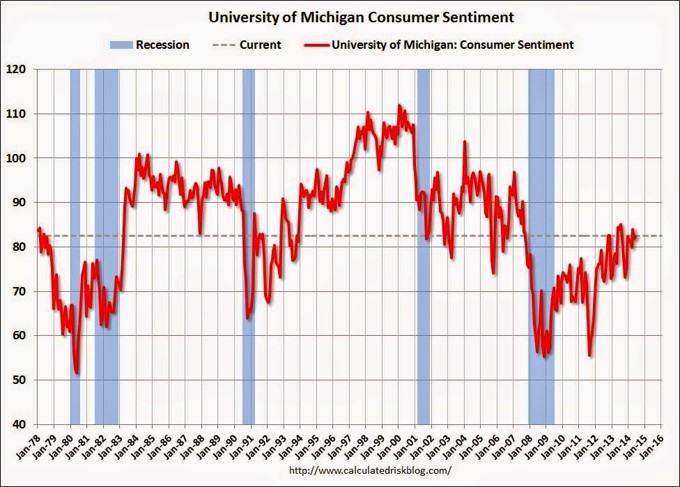
Source: Calculated Risk
Dividends & Share Buybacks Near Record Levels: A bird in the hand is worth two in the bush. Corporations have realized this investor desire and as a result companies are returning record levels of money (“capital”) to stock shareholders via increasing dividends and share buybacks (see chart below).
Source: Dr. Ed’s Blog
Housing on the Mend: The housing market has improved in fits and starts, but the most recent data point of new home sales shows significant improvement. More specifically, May’s new home sales were up +18.6% from the previous month (see chart below), the highest level seen since 2008. Although this data is encouraging, there is still plenty of room for improvement, as current sales remain more than 50% below 2005 peak levels.
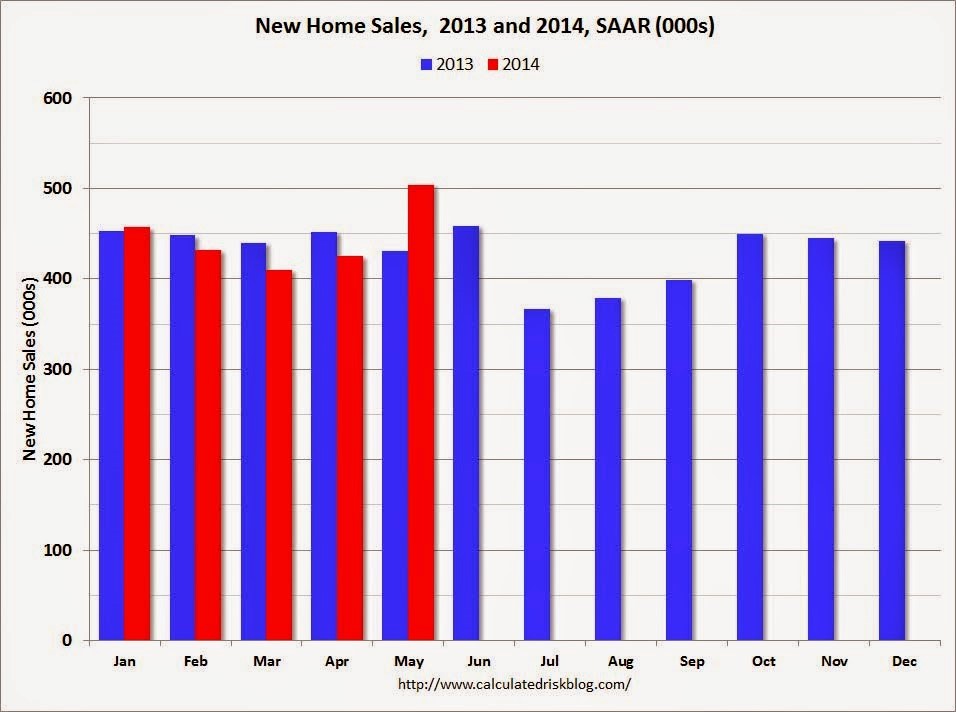
Source: Calculated Risk
Record Industrial Production: Adding support to the improving economic outlook are the industrial production figures, which also hit a record (see chart below). This data also adds credence to why the U.S. stock market has outperformed the European markets during the economic recovery from 2009.
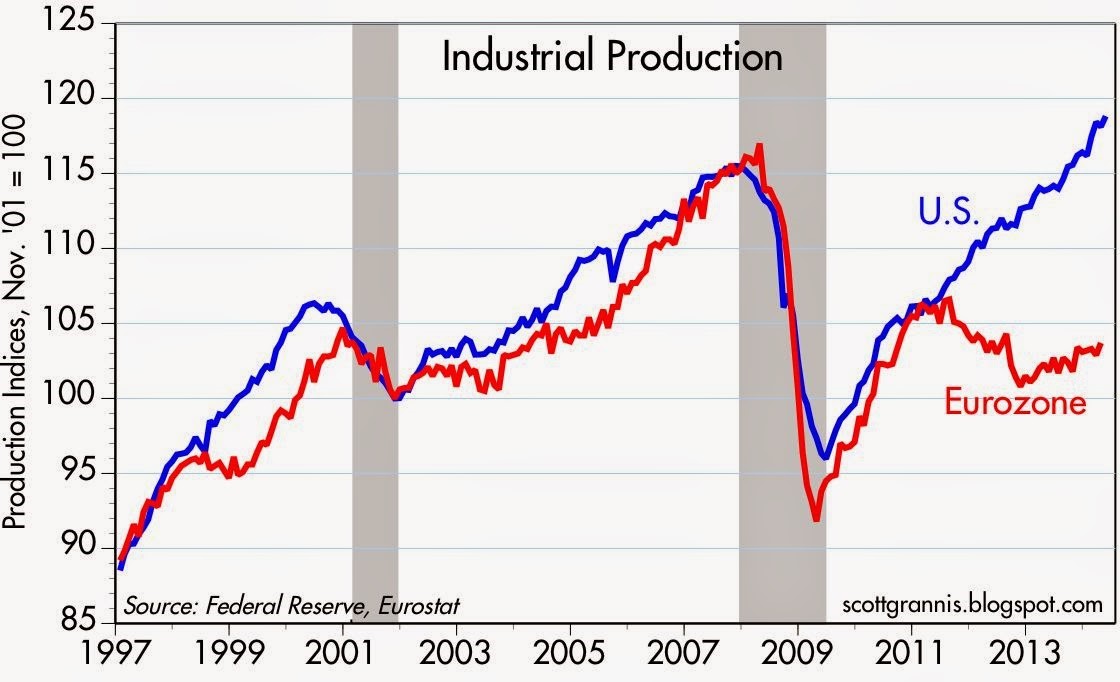
Source: Calafia Beach Pundit
Declining Federal Deficit: The federal deficit continues to narrow (i.e., tax revenues growing faster than government spending), so previous fiscally panicked screams have quieted down. We’re not out of the woods yet, but the trends are encouraging (see chart below):
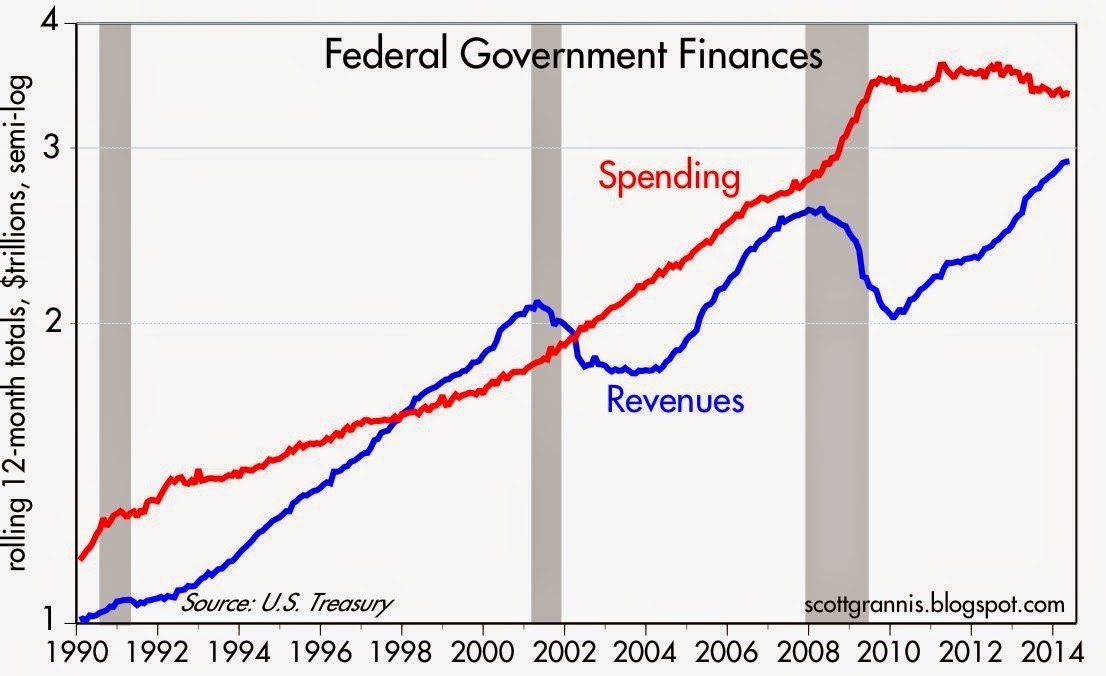
Source: Calafia Beach Pundit
There have been plenty of bombshells during the first half of 2014 (no pun intended), and there are bound to be plenty more during the second half of the year. By definition, nobody can be fully prepared for a surprise, or else it wouldn’t be called a “surprise”. For those skeptical investors sitting on the sidelines, the record breaking stock market performance has also been astonishing. Regardless of what happens over the next six months, periodically making adjustments to your financial plan is important, whether it’s during the pre-game, post-game, or halftime. And if you’re not interested or capable of making those adjustments yourself, find a professional advisor/coach to assist you.
Wade W. Slome, CFA, CFP®
Plan. Invest. Prosper.
DISCLOSURE: Sidoxia Capital Management (SCM) and some of its clients hold long positions in certain exchange traded funds and AGG, but at the time of publishing SCM had no direct position in any other security referenced in this article. No information accessed through the Investing Caffeine (IC) website constitutes investment, financial, legal, tax or other advice nor is to be relied on in making an investment or other decision. Please read disclosure language on IC Contact page.
The Buyback Bonanza Boost

With the S&P 500 off -1% from its all-time record high, many bears have continued to wait for and talk about a looming crash. For the naysayers, the main focus has been on the distorted monetary policies instituted by the Federal Reserve, but as I pointed out in Fed Fatigue is Setting In, QE and tapering talk are not the end-all, be-all of global financial markets. One need not look further than the dozen or so countries listed in the FT that have bond yields below the abnormally low yields we are experiencing in the U.S. (10-Year Treasury +2.75%).
Although there are many who believe a freefall is coming, much like a trampoline, a naturally occurring financial mechanism has provided a relentless bid to boost stock prices higher…a buyback bonanza! How significant have corporate stock repurchases been to spring prices higher? Jason Zweig, in his Intelligent Investor column, wrote the following:
In the Russell 3000, a broad U.S. stock index, repurchased $567.6 billion worth of their own shares—a 21% increase over 2012, calculates Rob Leiphart, an analyst at Birinyi Associates, a research firm in Westport, Conn. That brings total buybacks since the beginning of 2005 to $4.21 trillion—or nearly one-fifth of the total value of all U.S. stocks today.
To further put this gargantuan buyback bonanza into perspective, a recent Fox Business article described it this way:
Companies spent an estimated $477 billion on share buybacks last year. That’s enough to buy every NFL team 12 times over, run the federal government for 50 days or host the next nine Olympic Games with several billion left to spare. This year, companies are expected to ramp up buybacks by 35%, according to Goldman Sachs.
The bears continue to scream, while purple in the face, that the Fed’s QE and zero interest rate program (ZIRP) shenanigans are artificially propping up stock prices. The narrative then states the tapering and inevitable Fed Funds rate reversal will cause the market to come crashing down. While there is some truth behind this commentary, history reminds us that not all rate rising cycles end in bloodshed (see 1994 Bond Repeat or Stock Defeat?). Even if you believe in Armageddon, this rate reversal scenario is unlikely to happen until mid-2015 or beyond.
And for those worshipping the actions of Ms. Yellen at the Fed altar, believe it or not, there are other factors besides monetary policy that cause stock prices to go up or down. In addition to stock buybacks, there are dynamics such as record corporate profits, rising dividends, expanding earnings, reasonable valuations, improving international economies, and other factors that have contributed to this robust bull market.
At the end of the day, as I have continued to argue for some time, money goes where it is treated best – and generally that is not in savings accounts earning 0.003%. There is no reason to be a perma-bull, and I have freely acknowledged the expansion of froth in areas such as social media, biotech, Bitcoin and other areas. Regardless, there is, and will always be areas of speculation, in bull and bear markets (e.g., gold in the 2008-2009 period).
Magical Math
Investing involves a mixture of art and science, but with a few exceptions (i.e., fraud), numbers do not lie, and using math when investing is a good place to start. A simple but powerful mathematical formula instituted at Sidoxia Capital Management is the “Free Cash Flow Yield”, which is a metric we integrate into our proprietary SHGR (a.k.a.,“Sugar”) quantitative model (see Investing Holy Grail).
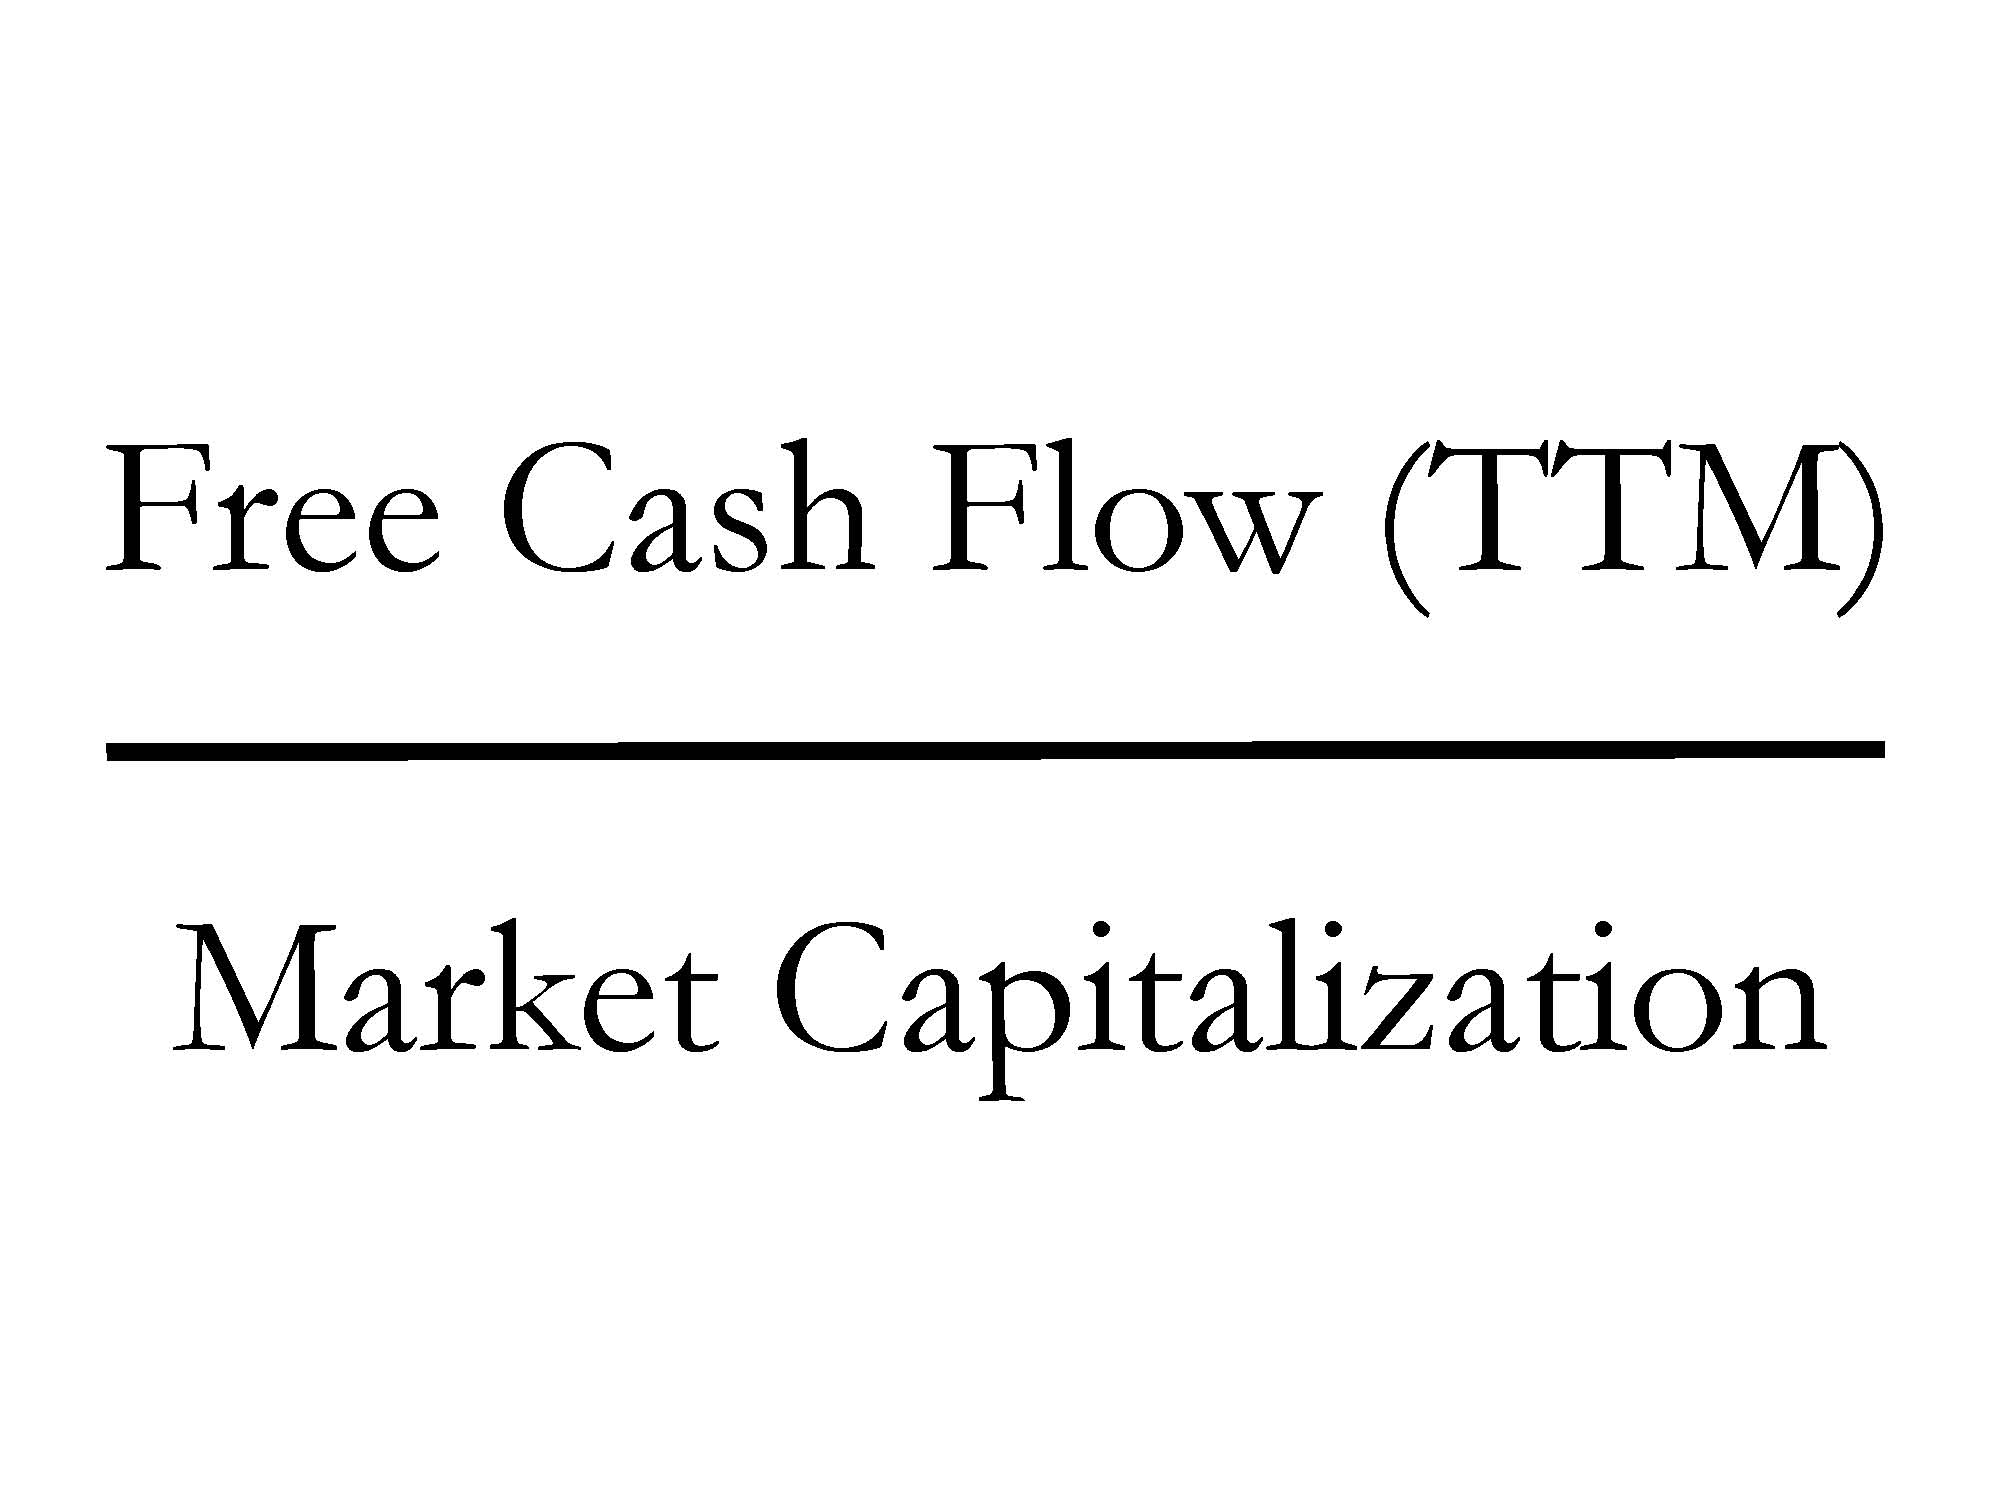
Quite simply, Free Cash Flow (FCF) is computed by taking the excess cash generated by a company after ALL expenses/expenditures (marketing, payroll, R&D, CAPEX, etc.) over a trailing twelve month period (TTM), then dividing that figure by the total equity value of a company (Market Capitalization). Mechanically, FCF is calculated by taking “Cash Flow from Operations” and subtracting “Capital Expenditures” – both figures can be found on the Cash Flow Statement. The Free Cash Flow ratio may sound complicated, but straightforwardly this is the leftover cash generated by a business that can be used for share buybacks, dividends, acquisitions, investments, debt pay-down, and/or placed in a banking account to pile up.
The great thing about FCF yields is that this ratio (%) can be compared across asset classes. For example, I can compare the FCF yield of Apple Inc – AAPL (+9.5%) versus a 10-Year Treasury (+2.75%), 1-year CD (+0.85%), Tesla Motors – TSLA (0.0%), Netflix, Inc – NFLX (-0.001%), or Twitter, Inc – TWTR (-0.003%). For growth and capital intensive companies, I can make adjustments to this calculation. However, what you quickly realize is that even if you assume massive growth in the coming years (i.e., $100s of millions in FCF), the prices for many of these momentum stocks are still astronomical.
An important insight about the current corporate buyback bonanza is that much of this price boost is being fueled by the colossal free cash flow generation of corporate America. Sure, some companies are borrowing through the debt markets to buy back stock, but if you were the Apple CFO sitting on $159,000,000,000 in cash earning 1%, it doesn’t make a lot of sense to sit on the cash earning nothing. It also doesn’t take a genius (or Carl Icahn) to figure out borrowing at record low rates (2.75% 10-year) while earning +10% on a stock buyback will increase shareholder value and earnings per share (EPS). More specifically, when Apple borrowed $17 billion at interest rates ranging from 0.5% – 3.9%, a shrewd, rational human being would borrow to the max all day long at those rates, if you could earn +10% on that investment. It is true that Apple’s profitability could drop and the numerator in our FCF ratio could decrease, but with $45 billion smackers coming in every year on top of $142 billion in net cash on the balance sheet, Apple has a healthy margin of safety to make the math work.
Where the math doesn’t compute is in insanely priced deals. For example, the recent merger in which Facebook Inc (FB) paid $19 billion (1,000 x’s the estimated 2013 annual revenues) for a 50-person, money-losing company (WhatsApp) that is offering a free service, makes zero financial sense to me. Suffice it to say, the FCF yield on WhatsApp could cause Warren Buffett to have a coronary event. Yes, diamond covered countertops would be nice to have in my kitchen, but I probably wouldn’t get much of a return on that investment.
Share buybacks are not a magical elixir to endless prosperity (see Share Buybacks & Bathroom Violators), but given the record profits and record low interest rates, basic math shows that even if stock prices correct (as should be expected), the trampolining effect of this buyback bonanza will provide support to the market.
Wade W. Slome, CFA, CFP®
Plan. Invest. Prosper.
DISCLOSURE: Sidoxia Capital Management (SCM) and some of its clients hold long positions in certain exchange traded funds (ETFs), AAPL and a short position in NFLX, but at the time of publishing SCM had no direct position in TSLA, TWTR, FB, Bitcoin, or any other security referenced in this article. No information accessed through the Investing Caffeine (IC) website constitutes investment, financial, legal, tax or other advice nor is to be relied on in making an investment or other decision. Please read disclosure language on IC Contact page.
QE: The Greatest Thing Since Sliced Bread*

Quantitative easing (QE), or the Federal Reserve’s bond buying program, has been a spectacular success. Arguably, the greatest innovation since sliced bread. Don’t believe me? I mean, if you listen to many of the experts, strategists, economists, and blogosphere pundits, the magical elixir of QE can be the only explanation rationalizing the multi-year economic recovery and stock market boom. Don’t believe me? Well, apparently many of the bearish pros make sure to credit QE for all our financial/economic positives. For example…
- QE is the reason the stock market is near all-time record highs.
- QE created seven million jobs in the U.S. over the last four years.
- QE turned around the housing market.
- QE turned around the auto market.
- QE weakened the U.S. dollar, resulting in flourishing exports.
- QE has lowered borrowing rates, thereby cleansing consumer balance sheets through deleveraging.
- QE is the reason Facebook Inc. (FB) hired 1,323 employees over the last year.
- QE is the reason Google Inc. (GOOG) has spent $7.8 billion on R&D over the last year.
- QE explains why McDonald’s Corp. (MCD) plans to open more than 1,400 stores this year.
- QE explains why Warren Buffett and 3G capital paid $28 billion to buy Heinz.
- QE is the reason Elon Musk and Tesla Motors (TSLA) invented the model S electric vehicle.
- QE exhibits why Target Corp. (TGT) is expanding outside the U.S. into Canada.
- QE is the reason why S&P 500 companies are expected to pay $300 billion in dividends this year.
- QE is the reason why S&P 500 companies were buying back shares at a $400 billion clip this year.
- QE is the basis for corporations spending billions on efficiency enhancing cloud-based services.
- QE led to a record number of new FDA drug approvals last year.
- QE has caused a natural gas production boom in numerous shale regions.
Wow…the list goes on and on! Heck, I even hear QE can take the corrosion off of a rusted car battery. Given how incredible this QE stuff is, why even consider tapering QE? Financial markets have been volatile on the heels of tapering the 3rd iteration of quantitative easing (QE3), but why slow QE3, when the FED could add more awesomeness with QE4, QE10, QE 100, and QE 1,000?
All of this QE talk is so wonderful, but unfortunately, according to all the bearish pundits, QE has created an artificial sugar high, thus creating an asset bubble that is going to end in a disastrous cratering of financial markets.
I know it’s entirely possible that QE may have absolutely nothing to do with the financial market recovery (other than a bid under Treasury & mortgage backed security prices), and also has no bearing on why I buy or sell stocks, but I guess I will need to hide in a cave when QE3 tapering begins. Although the end of dividends, share buybacks, housing/auto recoveries, acquisitions, expansion, innovation, etc., caused by QE tapering sure does not sound like a cheery outcome, at least I still have a loaf of sliced bread to make a sandwich.
*DISCLOSURE: For those readers not familiar with my writing style, I have been known to use a healthy dose of sarcasm. Call me if you want a deeper explanation.
Wade W. Slome, CFA, CFP®
Plan. Invest. Prosper.
DISCLOSURE II : Sidoxia Capital Management (SCM) and some of its clients hold positions in certain exchange traded funds (ETFs) and GOOG, but at the time of publishing, SCM had no direct position in FB, TSLA, MCD, BRKA, TGT, or any other security referenced in this article. No information accessed through the Investing Caffeine (IC) website constitutes investment, financial, legal, tax or other advice nor is to be relied on in making an investment or other decision. Please read disclosure language on IC Contact page
Share Buybacks and Bathroom Violators

We all have our own unique pet peeves that drive us crazy, and I am no exception. More grating than fingernails scraping down the chalkboard or rude drivers who refuse to let you merge lanes are those citizens that unabashedly exercise poor public bathroom etiquette. The only thing worse than listening to the loud-mouth cell phone talker in the neighboring stall is watching a restroom participant move straight from zipper closure (if they remember), immediately to the bathroom exit. I mean really, would it kill you at a minimum to pay a visit to the sink and feign a phantom hand-swipe under some running water? Don’t those people understand that I have to grab the same handle they use to exit the facility after they conduct their bathroom business? OK, now that I have gotten this issue off my chest, I feel better and I can get off my soapbox (no pun intended).
Something Stinks in Share Buyback Land
Beyond potty etiquette, there is another maddening pet peeve that drives me nuts in the realm of corporate capital allocation. I like to call this particular scheme the “empty share buyback.” Those companies that announce the empty share buyback do it with the intention of either getting a quick, short-term jump in stock price, or use the ploy as a way to indirectly line their pockets with future stock and option grants.
Here are a few ways on how the ruse works:
Scheme #1 – The Empty Pump-Fake: In one form or another, here is what the CEO basically says, “We plan to buyback zillions of shares from time to time, based on market conditions, and do not have any set expiration date for the plan.” In other words, the company executives are committing to absolutely nothing, but are hoping to confuse traders into buying shares to temporarily increase the stock price, so management can unload their shares for a swift profit. In actuality the management team is not obligated to purchase one share and may keep the pseudo-share buyback plan in place for years with no benefit to shareholders.
Scheme #2 – The Pocket Swap: Another one of my favorites, I like to call the pocket swap. Management effectively exchanges money from one pocket to the other. Typically management starts off by stating, “We treasure investor feedback, so we have initiated a new program to return capital to our valued shareholders in the form of a share buyback.” What they usually don’t tell investors is that the shares are being purchased (with shareholder money), so the executives can give more shares back to themselves (and a few other fortunate employees). That’s great for them, but what about me?!
At the end of the day, if the management team is truly working for the shareholder, the game is all about reducing the outstanding share count, which thereby increases earnings per share (and better yet free cash flow per share). Despite the recent climb in interest rates, yields are still near multi-decade lows. Corporations are flush with cash after cutting expenses to the bone, delaying hiring, and riding the global recovery wave. For those real investors not trading a position for a few days, weeks, or months, it behooves you to hold management’s feet to the fire to make sure “empty pump-fakes” or “pocket swap” share buybacks are not occurring.
If you have difficulty gauging the integrity of those management teams announcing share buybacks, I have a litmus test that can be used to judge the executive’s true intentions. It’s quite simple – just follow the CEO into the bathroom (same gender required) and see whether they honorably follow bathroom etiquette by washing their hands after completing their duty. Sleuth work can be tricky, but failure in determining the genuine purpose of management’s capital allocation decisions can lead to a share buyback program that will get flushed down the toilet.
Wade W. Slome, CFA, CFP®
Plan. Invest. Prosper.
DISCLOSURE: Sidoxia Capital Management (SCM) and some of its clients own certain exchange traded funds, but at the time of publishing SCM had no direct position in any other security referenced in this article. No information accessed through the Investing Caffeine (IC) website constitutes investment, financial, legal, tax or other advice nor is to be relied on in making an investment or other decision. Please read disclosure language on IC “Contact” page.


