Posts tagged ‘profits’
The Art of Catching Falling Knives

“In the middle of every difficulty lies an opportunity.” ~Albert Einstein
It was a painful week for bullish investors in the stock market as evidenced by the -1,018 point drop in the Dow Jones Industrial Average, equivalent to approximately a -6% decline. The S&P 500 index did not fare any better, and the loss for the tech-heavy NASDAQ index was down closer to -7% for the week.
The media is attributing much of the short-term weakness to a triple Chinese whammy of factors: 1) Currency devaluation of the Yuan; 2) Weaker Chinese manufacturing data registering in at the lowest level in over six years; and 3) A collapsing Chinese stock market.
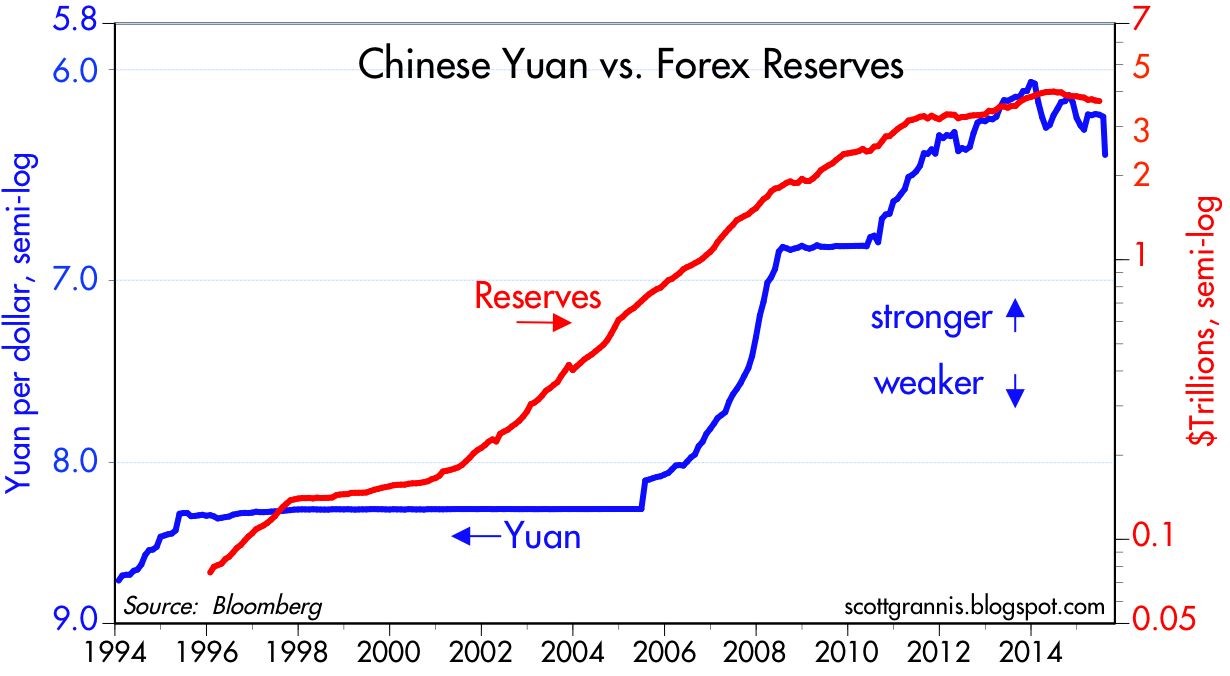
As the second largest economy on the planet, developments in China should not be ignored, however these dynamics should be put in the proper context. With respect to China’s currency devaluation, Scott Grannis at Calafia Beach Pundit puts the foreign exchange developments in proper perspective. If you consider the devaluation of the Yuan by -4%, this change only reverses a small fraction of the Chinese currency appreciation that has taken place over the last decade (see chart below). Grannis rightfully points out the -25% collapse in the value of the euro relative to the U.S. dollar is much more significant than the minor move in the Yuan. Moreover, although the move by the People’s Bank of China (PBOC) makes America’s exports to China less cost competitive, this move by Chinese bankers is designed to address exactly what investors are majorly concern about – slowing growth in Asia.
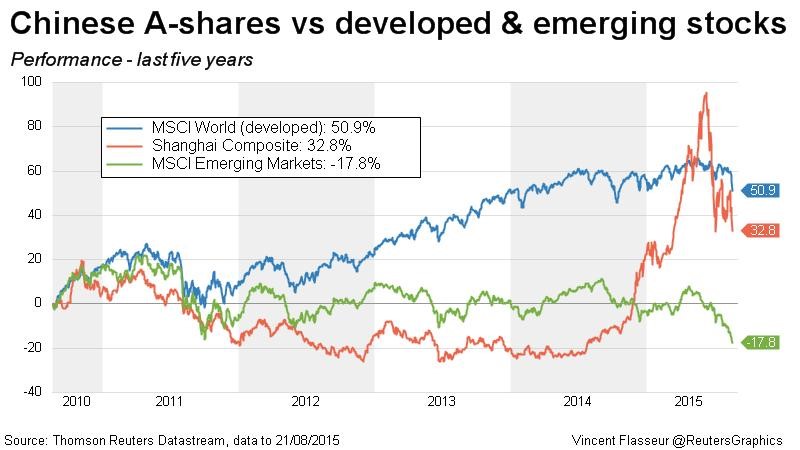
Although the weak Chinese manufacturing data is disconcerting, this data is nothing new – the same manufacturing data has been very choppy over the last four years. On the last China issue relating to its stock market, investors should be reminded that despite the massive decline in the Shanghai Composite, the index is still up by more than +50% versus a year ago (see chart below)
Fear the Falling Knife?
Given the fresh carnage in the U.S. and foreign markets, is now the time for investors to attempt to catch a falling knife? Catching knives for a living can be a dangerous profession, and many investors – professionals and amateurs alike – have lost financial fingers and blood by attempting to prematurely purchase plummeting securities. Rather than trying to time the market, which is nearly impossible to do consistently, it’s more important to have a disciplined, unemotional investing framework in place.
Hall of Fame investor Peter Lynch sarcastically highlighted the difficulty in timing the market, “I can’t recall ever once having seen the name of a market timer on Forbes‘ annual list of the richest people in the world. If it were truly possible to predict corrections, you’d think somebody would have made billions by doing it.”
Readers of my blog, Investing Caffeine understand I am a bottom-up investor when it comes to individual security selection with the help of our proprietary S.H.G.R. model, but those individual investment decisions are made within Sidoxia’s broader, four-pronged macro framework (see also Don’t be a Fool, Follow the Stool). As a reminder, driving our global views are the following four factors: a) Profits; b) Interest rates; c) Sentiment; and Valuations. Currently, two of the four indicators are flashing green (Interest rates and Sentiment), and the other two are neutral (Profits and Valuations).
- Profits (Neutral): Profits are at record highs, but a strong dollar, weak energy sector, and sluggish growth internationally have slowed the trajectory of earnings.
- Valuation (Neutral): At an overall P/E of about 18x’s profits for the S&P 500, current valuations are near historical averages. For CAPE investors who have missed the tripling in stock prices, you can reference prior discussions (see CAPE Smells Like BS). I could make the case that stocks are very attractive with a 6% earnings yield (inverse P/E ratio) compared to a 2% 10—Year Treasury bond, but I’ll take off my rose-colored glasses.
- Interest Rates (Positive): Rates are at unambiguously low levels, which, all else equal, is a clear-cut positive for all cash generating asset classes, including stocks. With an unmistakably “dovish” Federal Reserve in place, whether the 0.25% interest rate hike comes next month, or next year will have little bearing on the current shape of the yield curve. Chairman Yellen has made it clear the trajectory of rate increases will be very gradual, so it will take a major shift in economic trends to move this factor into Neutral or Negative territory.
- Sentiment (Positive): Following the investment herd can be very dangerous for your financial health. We saw that in spades during the late-1990s in the technology industry and also during the mid-2000s in the housing sector. As Warren Buffett says, it is best to “buy fear and sell greed” – last week we saw a lot of fear.
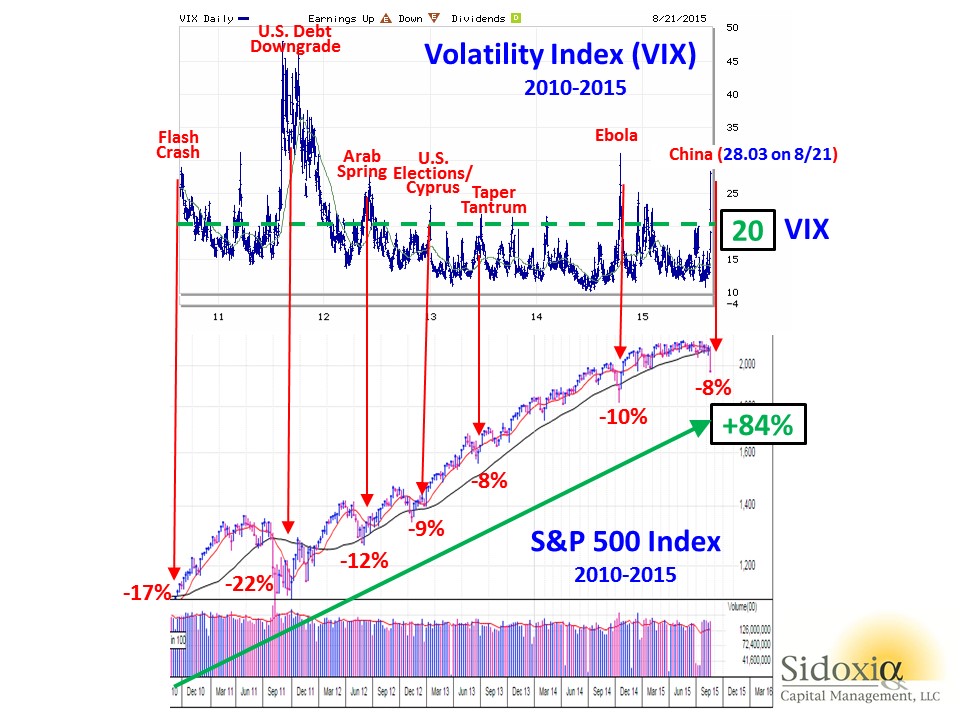
In addition to the immense outflows out of stock funds (see also Great Rotation) , panic was clearly evident in the market last week as shown by the Volatility Index (VIX), a.k.a., the “Fear Gauge.” In general, volatility over the last five years has been on a declining trend, however every 6-12 months, some macro concern inevitably rears its ugly head and volatility spikes higher. With the VIX exploding higher by an amazing +118% last week to a level of 28.03, it is proof positive how quickly sentiment can change in the stock market.
Not much in the investing world works exactly like science, but buying stocks during previous fear spikes, when the VIX level exceeds 20, has been a very lucrative strategy. As you can see from the chart below, there have been numerous occasions over the last five years when the over-20 level has been breached, which has coincided with temporary stock declines in the range of -8% to -22%. However, had you held onto stocks, without adding to them, you would have earned an +84% return (excluding dividends) in the S&P 500 index. Absent the 2011 period, when investors were simultaneously digesting a debt downgrade, deep European recession, and domestic political fireworks surrounding a debt ceiling, these periods of elevated volatility have been relatively short-lived.
Whether this will be the absolute best time to buy stocks is tough to say. Stocks are falling like knives, and in many instances prices have been sliced by more than -10%, -20%, or -30%. It’s time to compile your shopping list, because valuations in many areas are becoming more compelling and eventually gravity will run its full course. That’s when your strategy needs to shift from avoiding the falling knives to finding the bouncing tennis balls…excuse me while I grab my tennis racket.

Wade W. Slome, CFA, CFP®
Plan. Invest. Prosper.
DISCLOSURE: Sidoxia Capital Management (SCM) and some of its clients hold positions in certain exchange traded funds (ETFs) including emerging market/Chinese ETFs, but at the time of publishing, SCM had no direct position in any other security referenced in this article. No information accessed through the Investing Caffeine (IC) website constitutes investment, financial, legal, tax or other advice nor is to be relied on in making an investment or other decision. Please read disclosure language on IC Contact page.
Take Me Out to the Stock Game

This article is an excerpt from a previously released Sidoxia Capital Management complementary newsletter (October 1, 2013). Subscribe on the right side of the page for the complete text.
The Major League Baseball playoffs are just about to start, and the struggling U.S. economy is also trying to score some more wins to make the postseason as well. In 2008 and early 2009, the stock market looked more like The Bad News Bears with the S&P 500 index losing -58% of its value from the peak to the trough. The overleveraged (debt-laden) financial system, banged by a speculative housing bubble, swung the global economy into recession and put a large part of the economic team onto the disabled list.
Since the lows of 2009, S&P 500 stocks have skyrocketed +152%, including an +18% gain in 2013, and a +3% jump in September alone. With that incredible track record, one might expect a euphoric wave of investors pouring into the stock market stadium, ready to open their wallets at the financial market concession stand. Au contraire. Despite the dramatic winning streak, investors remain complacent skeptics, analyzing and critiquing every political, economic, and financial market movement and gyration.
Unfortunately, as stock prices have scored massive gains, many market followers have been too busy eating peanuts and drinking beer, rather than focusing on the positive economic statistics in the scorebook, such as these:
15/16 Quarters of Positive GDP Growth:
 |
| Source: Crossing Wall Street |
Precipitous Drop in Unemployment Claims: The lowest level since 2007 (7.5 million private sector jobs added since employment trough).
 |
| Source: Bespoke |
All-Time Record Corporate Profits:
 |
| Source: Ed Yardeni |
Financially Healthier Consumer – Lower Debt & Higher Net Worth:
 |
| Source: Scott Grannis |
Improving Housing Market:
 |
| Source: Scott Grannis |
While you can see a lot of financial momentum is propelling Team USA, there are plenty of observers concerned more about potential slumps and injuries emanating from a lineup of uncertainties. Currently, the fair-weather fans who are sitting in the bleachers are more interested in the uncertainty surrounding a government shutdown, debt ceiling negotiations, Syrian unrest, Iranian nuclear discussions, Obamacare defunding, and an imminent tapering of the Federal Reserve’s QE bond purchasing program (see Perception vs. Reality). The fearful skepticism of the fans has manifested itself in the form of a mountain of cash ($7 trillion), which is rapidly eroding to inflation and damaging millions of retirees’ long-term goals (see chart below). The fans sitting in the bleachers are less likely to buy long-term season tickets until some of these issues are settled.
 |
| Source: Scott Grannis – $3 trillion added since crisis. |
The aforementioned list of worries are but a few of the concerns that have investors biting their nails. While there certainly is a possibility the market could be thrown a curve ball by one of these issues, veteran all-star investors understand there are ALWAYS uncertainties, and when the current list of concerns eventually gets resolved or forgotten, you can bet there will be plenty of new knuckle-balls and screw-balls (i.e., new list of worries) to fret over in the coming weeks, months, and years (see Back to the Future I, II,& III). Ultimately, the vast majority of concerns fade away.
Yoooouuuuuu’rrrreee Out!
The politicians in Washington are a lot like umpires, but what our country really needs are umpires who can change and improve the rules, especially the silly, antiquated ones (see also Strangest Baseball Rules). The problem is that bad rules (not good ones) often get put in place so the umpires/politicians can keep their jobs at the expense of the country’s best interest.
When umpires (politicians) cannot agree on how to improve the rules, gridlock actually is the next best outcome (see Who Said Gridlock is Bad?). The fact of the matter is that deficits and debt/GDP ratios have declined dramatically in recent years due in part to bitter political feuds (see chart below). When responsible spending is put into action, good things happen and a stronger economic foundation can be established to cushion future crises.
 |
| Source: Scott Grannis |
There is plenty of room for improvement, but the statistics speak for themselves, which help explain why patient fans/investors have been handsomely rewarded with a homerun over the last four years. October historically has been a volatile month for the stock market, and the looming government shutdown and $16.7 trillion debt ceiling negotiations may contribute to some short-term strike-outs. However, if history proves to be a guide, stocks on average rise +4.26% during the last three months of the year (source: Bespoke), meaning the game may just not be over yet. With plenty of innings remaining for stocks to continue their upward trajectory, I still have ample time to grab my hot dog and malt during the 7th inning stretch.
Wade W. Slome, CFA, CFP®
Plan. Invest. Prosper.
DISCLOSURE: Sidoxia Capital Management (SCM) and some of its clients hold positions in certain exchange traded funds (ETFs), but at the time of publishing, SCM had no direct position in TSLA, PBI, or any other security referenced in this article. No information accessed through the Investing Caffeine (IC) website constitutes investment, financial, legal, tax or other advice nor is the information to be relied on in making an investment or other decision. Please read disclosure language on IC Contact page.
EBITDA: Sniffing Out the Truth

Financial analysts are constantly seeking the Holy Grail when it comes to financial metrics, and to some financial number crunchers EBITDA (Earnings Before Interest Taxes Depreciation and Amortization – pronounced “eebit-dah”) fits the bill. On the flip side, Warren Buffett’s right hand man Charlie Munger advises investors to replace EBITDA with the words “bullsh*t earnings” every time you encounter this earnings metric. We’ll explore the good, bad, and ugly attributes of this somewhat controversial financial metric.
The Genesis of EBITDA
The origin of the EBITDA measure can be traced back many years, and rose in popularity during the technology boom of the 1990s. “New Economy” companies were producing very little income, so investment bankers became creative in how they defined profits. Under the guise of comparability, a company with debt (Company X) that was paying interest expense could not be compared on an operational profit basis with a closely related company that operated with NO debt (Company Z). In other words, two identical companies could be selling the same number of widgets at the same prices and have the same cost structure and operating income, but the company with debt on their balance sheet would have a different (lower) net income. The investment banker and company X’s answer to this apparent conundrum was to simply compare the operating earnings or EBIT (Earnings Before Interest and Taxes) of each company (X and Z), rather than the disparate net incomes.
The Advantages of EBITDA
Although there is no silver bullet metric in financial statement analysis, nevertheless there are numerous benefits to using EBITDA. Here are a few:
- Operational Comparability: As implied above, EBITDA allows comparability across a wide swath of companies. Accounting standards provide leniency in the application of financial statements, therefore using EBITDA allows apples-to-apples comparisons and relieves accounting discrepancies on items such as depreciation, tax rates, and financing choice.
- Cash Flow Proxy: Since the income statement traditionally is the financial statement of choice, EBITDA can be easily derived from this statement and provides a simple proxy for cash generation in the absence of other data.
- Debt Coverage Ratios: In many lender contracts certain debt provisions require specific levels of income cushion above the required interest expense payments. Evaluating EBITDA coverage ratios across companies assists analysts in determining which businesses are more likely to default on their debt obligations.
The Disadvantages of EBITDA
While EBITDA offers some benefits in comparing a broader set of companies across industries, the metric also carries some drawbacks.
- Overstates Income: To Charlie Munger’s point about the B.S. factor, EBITDA distorts reality. From an equity holder’s standpoint, in most instances, investors are most concerned about the level of income and cash flow available AFTER all expenses, including interest expense, depreciation expense, and income tax expense.
- Neglects Working Capital Requirements: EBITDA may actually be a decent proxy for cash flows for many companies, however this profit measure does not account for the working capital needs of a business. For example, companies reporting high EBITDA figures may actually have dramatically lower cash flows once working capital requirements (i.e., inventories, receivables, payables) are tabulated.
- Poor for Valuation: Investment bankers push for more generous EBITDA valuation multiples because it serves the bankers’ and clients’ best interests. However, the fact of the matter is that companies with debt or aggressive depreciation schedules do deserve lower valuations compared to debt-free counterparts (assuming all else equal).
Wading through the treacherous waters of accounting metrics can be a dangerous game. Despite some of EBITDA’s comparability benefits, and as much as bankers and analysts would like to use this very forgiving income metric, beware of EBITDA’s shortcomings. Although most analysts are looking for the one-size-fits-all number, the reality of the situation is a variety of methods need to be used to gain a more accurate financial picture of a company. If EBITDA is the only calculation driving your analysis, I urge you to follow Charlie Munger’s advice and plug your nose.
Wade W. Slome, CFA, CFP®
Plan. Invest. Prosper.
*DISCLOSURE: Sidoxia Capital Management (SCM) and some of its clients own certain exchange traded funds, but at the time of publishing had no direct positions in any security referenced in this article. No information accessed through the Investing Caffeine (IC) website constitutes investment, financial, legal, tax or other advice nor is to be relied on in making an investment or other decision. Please read disclosure language on IC “Contact” page.
Measuring the Market with Valuation Dipstick

Investor opinions about the stock market’s value are all over the map.
Doomsayers think the market is valued at crazy levels, and believe that “buy-and-hold” investing is dead. Bears remind investors that stocks have led to nothing good except for a lost decade of performance (read article on Lost Decade). Many speculators on the other hand believe they have the ability to “time the markets” to take advantage of volatility in any market (see also Market Timing article). In trader land, overconfidence is never in short-supply. Certainly, if you are a trader at Goldman Sachs (GS) or UBS and you are trading with privileged client data, then taking advantage of volatility can be an extremely lucrative endeavor. However most day-traders, and average investors, are not honored with the same information. Rather, the public gets overwhelmed by online brokerage firms and their plethora of software bells and whistles – inadequate protection when investing among a den of wolves. Equipping speculators with day trading tools is a little like giving a 7-year old a squirt gun and shipping them off to Afghanistan to fight the Taliban – the odds are not in the kid’s favor.
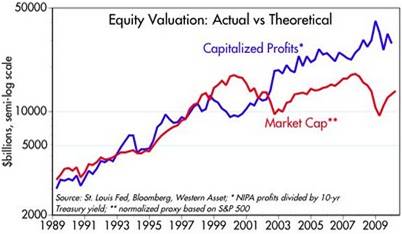
With so much uncertainty out in the marketplace, how do we know if the overall market is cheap or expensive? According to Scott Grannis, former Chief Economist at Western Asset Management and author of the Calafia Beach Pundit blog, the dipstick components necessary to measure the value of the market are corporate profits relative to the level of Gross Domestic Product (GDP) and the value (market cap) of the S&P 500 index. Grannis is a believer in the tenet that stock prices follow earnings, and as you can see from his charts below, earnings have grown much faster than stock prices over the last 10 years:
20 Year Chart
50 Year Chart
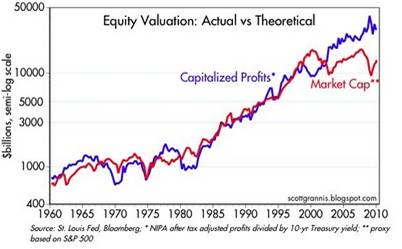
As you can see there is an extremely tight correlation on the 50-year chart until the last decade. What does the recent diverging trend mean? Here’s what Grannis has to say:
“Note that profits doubled from 1998 to 2009, yet the S&P 500 index today is still lower than it was at the end of 1998…equities continue to be extremely undervalued. Another way of looking at this is that the market is discounting current profits using an 8% 10-yr Treasury yield, or a 50% drop in corporate profits from here. Simply put, according to this model the market is priced to some very awful assumptions.”
How will this valuation gap be alleviated? Grannis correctly identifies two scenarios to achieve this end: 1) Rising treasury yields; and 2) Rising equity prices. His base case would be a move on the 10-year yield to 5.5%, and a move upwards in the S&P 500 index +50%.
Judging by Grannis’s dipstick measurement, there’s plenty of oil in the system to prevent the market engine from overheating just quite yet.
Read the Complete Scott Grannis Article
Wade W. Slome, CFA, CFP®
Plan. Invest. Prosper.
*DISCLOSURE: Sidoxia Capital Management (SCM) and some of its clients own certain exchange traded funds, but at the time of publishing SCM had no direct positions in GS, UBS, or any security referenced in this article. No information accessed through the Investing Caffeine (IC) website constitutes investment, financial, legal, tax or other advice nor is to be relied on in making an investment or other decision. Please read disclosure language on IC “Contact” page.