Posts tagged ‘profits’
A Tale of Two Cities

In 1859, Charles Dickens published his timeless historical novel, A Tale of Two Cities, set in London and Paris before and during the French Revolution (1775 – 1789). He opens the book with one of the most famous passages in literary history:
“It was the best of times, it was the worst of times, it was the age of wisdom, it was the age of foolishness, it was the epoch of belief, it was the epoch of incredulity, it was the season of Light, it was the season of Darkness, it was the spring of hope, it was the winter of despair.”
Nearly 170 years later, Dickens’ words could easily describe today’s stock market.
On one hand, the S&P 500 has climbed +9.6% this year and recently reached another all-time high – the “best of times.” On the other hand, many investors believe the artificial intelligence boom has become dangerously speculative and bears an uncomfortable resemblance to the technology bubble that burst in 2000 – the “worst of times.”
That divergence in sentiment was reflected in last month’s market performance:
- Dow Jones Industrial Average: +2.5%
- S&P 500: -1.1%
- NASDAQ: -2.8%
THE BEST OF TIMES
There are plenty of reasons why this multi-year bull market continues to march higher. Here are three of the most compelling.
AI Boom – Micron
As I discussed in last month’s article, The Multi-Trillion AI Tsunami, trillions of dollars are being invested across the artificial intelligence ecosystem.
Among the biggest beneficiaries are semiconductor memory companies such as Micron Technology, Inc. (MU), whose High-Bandwidth Memory (HBM) chips have become critical components powering next-generation AI data centers.
Micron recently reported extraordinary financial results as demand continues to outstrip supply. In its most recent quarterly report, Micron’s revenues more than quadrupled to $41.5 billion from $9.3 billion (+346%), a year ago. Profits for the three-month period skyrocketed even more by 15-fold to $28.2 billion from $1.9 billion (+1,398%).
Behind this remarkable growth is a structural supply shortage. Unlike software, semiconductor manufacturing capacity cannot be expanded overnight. Building a state-of-the-art memory fabrication facility requires billions of dollars of investment and typically takes three to four years to complete.
That lengthy construction timeline suggests favorable pricing and elevated profitability may persist well beyond the current earnings cycle, which explains Micron’s +837% spike in its stock price over the last year.
Earnings Are Rising Faster Than Stock Prices
Many investors assume record highs automatically mean expensive valuations. Not necessarily. Valuation depends on both price and earnings. When corporate earnings grow faster than stock prices, the market actually becomes less expensive despite reaching new highs.
Think back to elementary school fractions. If the denominator (earnings) grows faster than the numerator (price), the overall ratio becomes smaller. The same principle applies to the market’s Price-to-Earnings (P/E) ratio.
That is exactly what has occurred this year. Projected corporate profits are expected to surge +31%, causing the S&P 500’s valuation multiple to decline even as the index has reached record levels. One of my favorite long-term charts (below) illustrates this relationship perfectly. While stock prices can deviate from fundamentals over shorter periods, they ultimately follow the direction of corporate earnings.
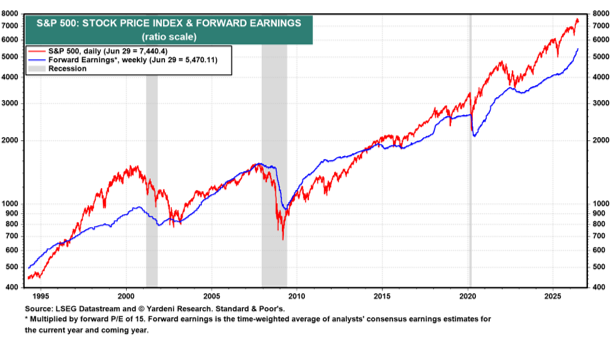
Source: Yardeni Research
Economic Momentum Is Improving
Another encouraging development is the improving economic backdrop. The ISM Manufacturing Index remains one of the most reliable gauges of economic activity. Readings above 50 signal expansion, while readings below 50 indicate contraction. Recent data show both the United States and the Eurozone moving back into expansionary territory, suggesting manufacturing activity and economic momentum are strengthening after an extended slowdown.
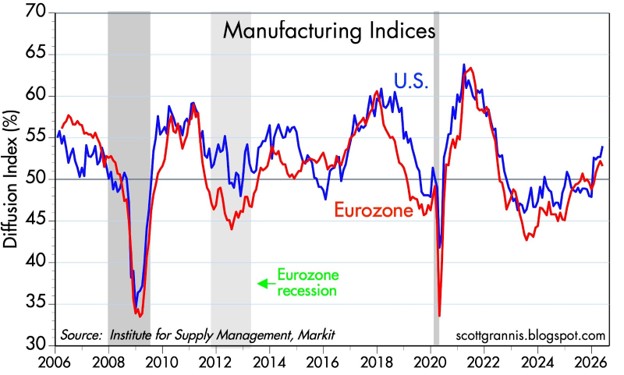
Source: Calafia Beach Pundit
THE WORST OF TIMES
As I discussed in my earlier article, The SaaSpocalypse Has Arrived?, the AI revolution is creating a palpable anxiety attack as broad swaths of Americans worry about AI agents stealing their $180,000 managerial positions for a $200/month subscription fee.
There are many reasons to remain optimistic about AI’s long-term benefits, but investors should also recognize several risks that could quickly shift today’s “best of times” into the “worst of times.”
Speculative Valuations
Although the overall market appears far more reasonably valued than during the peak of the Dot-Com Bubble, speculation has clearly returned to select areas of the market.
The recent public debut of Elon Musk’s SpaceX serves as a prime example. Despite generating billions in operating losses and burning -$9 billion in cash in its recent quarter, investors have assigned the company a valuation exceeding $2 trillion. Based on trailing revenues of approximately $19 billion, investors are effectively paying more than 100 times annual sales. Such valuations require extraordinary execution over many years to ultimately justify today’s prices.
Nor is the enthusiasm limited to SpaceX. Reports indicate AI leaders Anthropic and OpenAI are preparing their own public offerings, with expected valuations approaching $1 trillion despite annual revenues that remain a fraction of those levels. History teaches us that transformative technologies often create enormous long-term winners — but periods of genuine innovation can also produce speculative excess.
Geopolitical Risks
Although a tentative ceasefire currently exists between the United States and Iran, geopolitical conditions remain fluid. Markets have largely looked through the recent conflict, but history reminds us that geopolitical events can change quickly and unexpectedly. A deterioration in the Middle East could rapidly reverse investor sentiment.
AI-Driven Layoffs
The labor market remains relatively healthy, with unemployment near 4.3%. However, beneath the surface, signs of workforce restructuring continue to emerge as companies invest aggressively in automation and artificial intelligence.
Technology companies have announced approximately 125,000 layoffs this year—roughly 66% more than during the same period last year. Oracle recently announced plans to eliminate an estimated 21,000 positions. Robinhood is reducing its workforce by approximately 10%, while Cisco revealed it is slashing its workforce by 5% (4,000 jobs). Although today’s labor market remains resilient, investors should monitor whether AI-driven productivity gains ultimately translate into broader employment weakness.
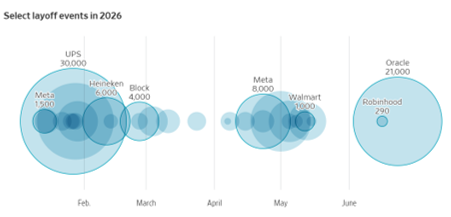
Source: Wall Street Journal
Final Thoughts
Last month’s mixed market performance reflects an investment landscape filled with both optimism and uncertainty.
If Charles Dickens were writing today, his Tale of Two Cities might instead be titled A Tale of Two Markets. The speculative excesses we experience in every technological revolution could lead to the “worst of times” but for now, the “best of times” is currently prevailing as investor optimism over AI’s productivity benefits remains front and center.
Wade W. Slome, CFA, CFP®
Plan. Invest. Prosper.
Disclosure: Sidoxia Capital Management (SCM) and some of its clients hold positions in certain exchange traded funds (ETFs), but at the time of publishing had no direct position in MU or any other security referenced in this article. No information accessed through the Investing Caffeine (IC) website constitutes investment, financial, legal, tax or other advice nor is to be relied on in making an investment or other decision. Each investor’s situation is unique so please work with a professional financial adviser, tax accountant or legal representative, as applicable, to develop an individualized plan or address any questions you may have. Investing involves risk including the possibility of loss of one’s investment.
Stocks Soar as Profits Roar

The Geopolitical Dilemma: Iran Gone Wrong
It has been a volatile and unsettling period in the Middle East. Following more than a month of continuous bombing in Iran, the United States reached a tenuous ceasefire. While the active conflict has paused, the U.S. continues to maintain a financially crippling blockade against the Iranian regime.
If that geopolitical stress isn’t enough, oil prices remain elevated at $105 per barrel (WTI), roughly 57% above levels seen before the bombings began. Furthermore, gasoline prices hovering around the $4.40 per gallon threshold are acting like a brake that is slowing down global economic activity.
On the surface, this negative narrative sounds like a disastrous backdrop for financial markets. Yet, last month’s stock market performance tells a completely different story:
· S&P 500: +10.4%
· NASDAQ: +15.3%
· Dow Jones Industrial Average: +7.1%
Why the Disconnect?
Followers of my firm, Sidoxia Capital Management, and my blog, Investing Caffeine, know that geopolitics are rarely the primary drivers of long-term stock performance. Instead, we look to the “four legs of the Sidoxia stool”: profits, interest rates, valuations, and sentiments. For a deeper dive, check out my article: Don’t Be a Fool, Follow the Stool. The vital leg supporting the recent move in stocks has been soaring profits. As illustrated by data from Yardeni.com, S&P 500 profits (red line) are accelerating at a much steeper pace than those of the S&P 400 MidCap (blue line) and S&P 600 SmallCap (green line).
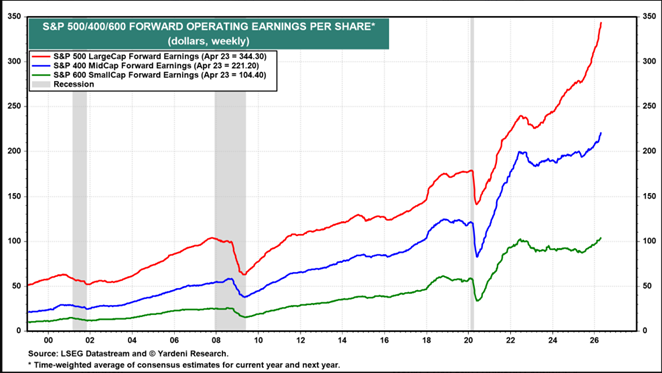
Source: Yardeni.com
A major contributor to this profit expansion is rising profit margins. Today, companies are earning a profit of approximately11 cents per dollar of sales, compared to just 5.5 cents during the 1970s and 1980s. The chart below highlights this phenomenon.
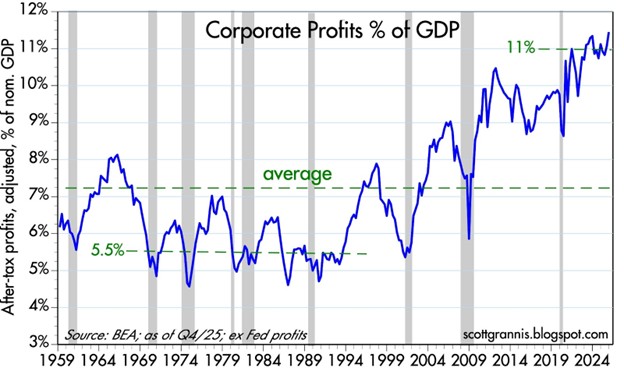
Source: Calafia Beach Pundit
The AI Productivity Revolution
What is driving much of this margin expansion? You guessed it: Artificial Intelligence.
We need to look no further than the mega-cap tech companies that reported Q1 financial results this week (Alphabet, Amazon, Microsoft, and Meta Platforms) to see how AI is helping companies cut costs and grow revenues:
- Combined, these four companies boast a revenue run-rate exceeding $1.7 trillion, with an accelerating growth rate above +22%.
- Meanwhile, headcount growth at these firms has remained virtually flat at < 2%. In fact, Meta and Microsoft recently announced a combined 20,000 in job cuts, raising concerns over an AI labor crisis.
These sales increases and expense reductions help explain last month’s surge in the performance of these stocks:
- Alphabet-Google (GOOGL): +33.9%
- Amazon.com Inc. (AMZN): +27.3%
- Microsoft Corp. (MSFT): +10.2%
- Meta Platforms Inc. (META): +6.8%
AI Driving the IPO Pipeline The AI boom is also creating massive value in the private markets. High-profile expected IPOs – including Elon Musk’s xAI, OpenAI (makers of ChatGPT), and Anthropic – are expected to exceed a combined $2 trillion in valuation. The graphic below shows the gargantuan size of these expected IPOs.
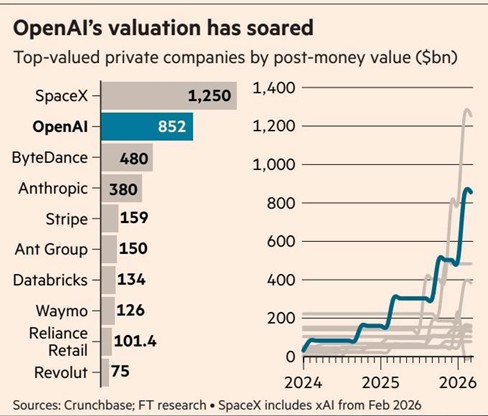
Source: Financial Times
The AI Train is Leaving the Station
AI is impacting every industry and every worker in some way, and this disruptive wave will undoubtedly displace some jobs. However, investors have the opportunity to jump on the train rather than be left behind.
As I noted in my recent article, The Saaspocalypse Has Arrived—or Has It?, if history repeats itself, the rollout of new technologies creates an influx of new industries and jobs that offset initial disruptions. If you work in an industry vulnerable to AI proliferation, taking advantage of the AI profit revolution can help offset potential financial disruption.
Of course, not everything is rainbows and unicorns. The Iranian conflict could still spiral out of control, which could quickly reverse recent stock market gains.
As I recapped for investors last month:
“History reminds us that while geopolitical shocks are terrifying in the moment, their impact on diversified portfolios is almost always temporary… In the world of investing, the best time to stay disciplined is exactly when everyone else is looking for the exit.”
Suffice it to say, geopolitics can and will impact short-term performance, but they rarely dictate long-term trends. When analyzing the market, it is crucial to remember a fundamental truth: When profits roar, stock prices often soar.
Wade W. Slome, CFA, CFP®
Plan. Invest. Prosper.
This article is an excerpt from a previously released Sidoxia Capital Management complimentary newsletter (May 1, 2026). Subscribe Here to view all monthly articles.
DISCLOSURE: Sidoxia Capital Management (SCM) and some of its clients hold positions in GOOGL, META, AMZN, MSFT, and certain exchange traded funds (ETFs), but at the time of publishing had no direct position in any other security referenced in this article. No information accessed through the Investing Caffeine (IC) website constitutes investment, financial, legal, tax or other advice nor is to be relied on in making an investment or other decision. Please read disclosure language on IC Contact page.
Head Fakes Surprise as Stocks Hit Highs

In a world of seven billion people and over 200 countries, guess what…there are a plethora of crises, masses of bad people, and plenty of lurking issues to lose sleep over.
The fear du jour may change, but as the late-great investor Sir John Templeton correctly stated:
“Bull markets are born on pessimism and they grow on skepticism, mature on optimism, and die on euphoria.”
And for the last decade since the 2008-2009 Financial Crisis, it’s clear to me that the stock market has climbed a lot of worry, pessimism, and skepticism. Over the last decade, here is a small sampling of wories:
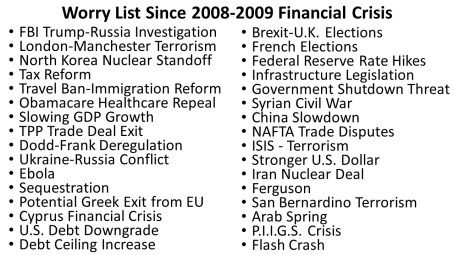
With over five billion cell phones spanning the globe, fear-inspiring news headlines travel from one end of the world to the other in a blink of an eye. Fortunately for investors, the endless laundry list of crises and concerns has not broken this significant, multi-year bull market. In fact, stock prices have more than tripled since early 2009. As famed hedge fund manager Leon Cooperman noted:
“Bull markets don’t die from old age, they die from excesses.”
On the contrary to excesses, corporations have been slow to hire and invest due to heightened risk aversion induced by the financial crisis. Consumers have saved more and lowered personal debt levels. The Federal Reserve took unprecedented measures to stimulate the economy, but these efforts have since been reversed. The Fed has even signaled its plan to reduce its balance sheet later this year. As the expansion has aged, corporations and consumer risk aversion has abated, but evidence of excesses remains paltry.
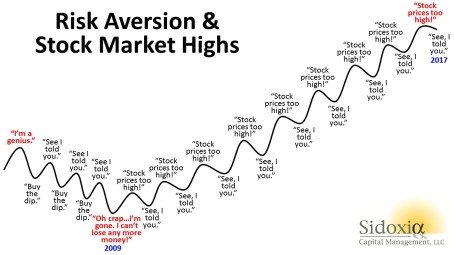
Investors may no longer be panicked, but they remain skeptical. With each subsequent new stock market high, screams of a market top and impending recession blanket headlines. As I pointed out in my March Madness article, stocks have made new highs every year for the last five years, but continually I get asked, “Wade, don’t you think the market is overheated and it’s time to sell?”
For years, I have documented the lack of stock buying evidenced by the continued weak fund flow sales. If I could summarize investor behavior in one picture, it would look something like this:
Corrections have happened, and will continue to occur, but a more significant decline will likely happen under specific circumstances. As I point out in Half Empty, Half Full?, the time to become more cautious will be when we see a combination of the following trends occur:
- Sharp increase in interest rates
- Signs of a significant decline in corporate profits
- Indications of an economic recession (e.g., an inverted yield curve)
- Spike in stock prices to a point where valuation (prices) are at extreme levels and skeptical investor sentiment becomes euphoric
Attempting to predict a market crash is a Fool’s Errand, but more important for investors is periodically reviewing your liquidity needs, time horizon, risk tolerance, and unique circumstances, so you can optimize your asset allocation. There will be plenty more head fake surprises, but if conditions remain the same, investors should not be surprised by new stock highs.

Wade W. Slome, CFA, CFP®
Plan. Invest. Prosper.
DISCLOSURE: Sidoxia Capital Management (SCM) and some of its clients own certain exchange traded funds, but at the time of publishing SCM had no direct position in any other security referenced in this article. No information accessed through the Investing Caffeine (IC) website constitutes investment, financial, legal, tax or other advice nor is to be relied on in making an investment or other decision. Please read disclosure language on IC “Contact” page.
Political Showers Bring Record May Stock Flowers

This article is an excerpt from a previously released Sidoxia Capital Management complimentary newsletter (June 1, 2017). Subscribe on the right side of the page for the complete text.
There has been a massive storm of political rain that has blanketed the media airwaves and internet last month, however, the stock market ignored the deluge of headlines and focused on more important factors, as prices once again pushed to new record highs. Over the eight-year bull market, the old adage to “sell in May, and go away,” once again was not a very successful strategy. Had investors heeded this advice, they would have missed out on a +1.2% gain in the S&P 500 index during May (up +7.7% for 2017) and a +2.5% surge in the technology-driven NASDAQ index (+15.1% in 2017).
Keeping track of the relentless political storm of new headlines and tweets almost requires a full-time staff person, but nevertheless we have summarized some of the political downpour here:
French Elections: In the wake of last year’s U.K. “Brexit”, fears of an imminent “Frexit” (French Exit) resurfaced ahead of the French presidential. Emmanuel Macron, a 39-year-old former investment banker, swept to a decisive victory over National Front candidate Marine Le Pen by a margin of 66% to 34%.
Firing of FBI Director: President Trump fired FBI Director James Comey based on the recommendation of deputy attorney general Rod Rosenstein, who cited Comey’s mishandling of Hillary Clinton’s private email server investigation. The president’s critics claim Trump was frustrated with the FBI’s investigation into the administration’s potential ties with Russian officials in relation to the 2016 presidential elections. Comey is expected to testify next week to Congress, where he will likely address reports that President Trump asked him to drop the FBI’s investigation into former National Security Advisor Michael Flynn during a February meeting.
Trump Classified Leak to Russians: Reports show that President Trump revealed classified information regarding the Islamic State (ISIS) to the Russian foreign minister during an Oval Office meeting. The ISIS related information emanating from Syria reportedly had been passed to the U.S. from Israel, with the provision that it not be shared.
Impeachment Talk and Appointment of Independent Special Prosecutor: Heightened reports of Russian intervention coupled with impeachment cries from the Democratic opposition coincided with Deputy Attorney General Rod Rosenstein’s announcement that former FBI director Robert Mueller III would take on the role as an independent special counsel in the investigation of Russian interference in the 2016 election. Rosenstein had the authority to make the appointment after Attorney General Jeff Sessions recused himself after admitting contacts with Russian officials. The White House, which has denied colluding with the Russians, issued a statement from President Donald Trump looking forward “to this matter concluding quickly.”
Kushner Under Back Channel Investigation: President Trump’s son-in-law and senior advisor, Jared Kushner, is under investigation over discussions to set up a back channel of communication with Russian officials. At the heart of the probe is a December meeting Kushner held with Sergey Gorkov, an associate of Russian President Vladimir Putin and the head of the state-owned Vnesheconombank, a Russian bank subject to sanctions imposed by President Obama. Back channels have been legally implemented by other administrations, but the timing and nature of the discussions could make the legal interpretation more difficult.
Trump’s First Foreign Trip: A whirlwind trip by President Trump through the Middle East and Europe, resulted in commitments to Middle East peace, multi-billion contract signings with the Saudis, pledges to fight Muslims extremism, calls for NATO members to pay their “fair share,” and demands for German President Angela Merkel to address the elevated trade deficit with the U.S.
Subpoenas Issued to Trump Advisors: The House Intelligence Committee issued subpoenas to ousted National Security Adviser Michael Flynn and President Trump’s personal attorney, Michael Cohen, as it relates to potential Russian interference in the presidential campaign. Flynn reportedly plans to invoke his Fifth Amendment rights in response to a separate subpoena issued by the Senate Intelligence Committee.
Repeal and Replace Healthcare: The Republican-controlled House of Representatives narrowly passed a vote to repeal and replace the Affordable Care Act after prior failed attempts. The bill, which allows states to apply for a waiver on certain aspects of coverage, including pre-existing conditions, received no Democratic votes. While the House passage represents a legislative victory for President Trump, Senate Republicans must now take up the legislation that addresses conclusions by the nonpartisan Congressional Budget Office (CBO). More specifically, the CBO found the revised House health care bill could leave 23 million more Americans uninsured while reducing the federal deficit by $119 billion in the next decade.
North Korea Missile Tests: If domestic political turmoil wasn’t enough, North Korea conducted an unprecedented number of medium-to-long-range missile tests in an effort to develop an intercontinental ballistic missile (ICBM) capable of hitting the mainland United States. Due to the rising tensions, the U.S. and South Korea have been planning nuclear carrier drills off the coast of the Korean peninsula.
Wow, that was a mouthful. While all these politics may be provocative and stimulating, long-time followers of mine understand my position…politics are meaningless (see Politics-Schmolitics). While a terrorist or military attack on U.S. soil would undoubtedly have an immediate and negative impact, 99% of daily politics should be ignored by investors. If you don’t believe me, just take a look at the stock market, which continues to make new record highs in the face of a hurricane of negative political headlines. What the stock market really cares most about are profits, interest rates, and valuations:
- Record Profits: Stock prices follow the direction of earnings over the long-run. As you can see below, profits vacillate year-to-year. However, profits are currently surging, and therefore, so are stock prices – despite the negative political headlines.

Source: Dr. Ed’s Blog
- Near Generationally Low Interest Rates: Generally speaking, most asset classes, including real estate, commodities, and stock prices are worth more when interest rates are low. When you could earn 15% on a bank CD in the early 1980s, stocks were much less attractive. Currently, bank CDs almost pay nothing, and as you can see from the chart below, interest rates are near a generational low – this makes stock prices more attractive.

- Attractive Valuations: The price you pay for an asset is always an important factor, and the same principle applies to your investments. If you can buy a $1.00 for $0.90, you want to take advantage of that opportunity. Unfortunately, the value of stocks is not measured by a simple explicit price, like you see at a grocery store. Rather, stock values are measured by a ratio (comparing an investment’s price relative to profits/cash flows generated). Even though the stock market has surged this year, stock values have gotten cheaper. How is that possible? Stock prices have risen about +8% in the first quarter, while profits have jumped +15%. When profits rise faster than prices appreciate, that means stocks have gotten cheaper. From a multi-year standpoint, I agree with Warren Buffett that prices remain attractive given the current interest rate environment. To read more about valuations, check out Ed Yardeni’s recent article on valuations.

Wade W. Slome, CFA, CFP®
Plan. Invest. Prosper.
DISCLOSURE: Sidoxia Capital Management (SCM) and some of its clients own certain exchange traded funds, but at the time of publishing SCM had no direct position in any other security referenced in this article. No information accessed through the Investing Caffeine (IC) website constitutes investment, financial, legal, tax or other advice nor is to be relied on in making an investment or other decision. Please read disclosure language on IC “Contact” page.
Ignoring Economics and Vital Signs

As stock prices sit near all-time record highs, and as we enter year nine of the current bull market, I remain amazed and amused at the brazen disregard for important basic economic concepts like supply & demand, interest rates, and rising profits.
If the stock market was a doctor’s patient, over the last decade, bloggers, pundits, talking heads, and pontificators have been ignoring the improving, healthy patient’s vital signs, while endlessly predicting the death of the resilient stock market.
However, let’s be clear – it has not been all hearts and flowers for stocks – there have been numerous -10%, -15%, and -20% corrections since the Financial Crisis nine years ago. Those corrections included the Flash Crash, debt downgrade, Arab Spring, sequestration, Taper Tantrum, Iranian Nuclear Threat, Ukrainian-Crimea annexation, Ebola, Paris/San Bernardino Terrorist Attacks, multiple European & Chinese slowdowns and more.
Despite the avalanche of headlines and volatility, we all know the net result of these events – a more than tripling of stock prices (+259%) from March 2009 to new all-time record highs. With the incessant stream of negative news, how could prices appreciate so dramatically?
Over the years, the explanations by outside observers have changed. First, the recovery was explained as a “dead cat bounce” or a short-term cyclical bull market within a long-term secular bear market. Then, when stock prices broke to new records, the focus shifted to Quantitative Easing (QE1, QE2, QE3, and Operation Twist). The QE narrative implied the bull advance was temporary due to the non-stop, artificial printing presses of the Fed. Now that the Fed has not only ended QE but reversed it (the Fed is actually contracting its balance sheet) and hiked interest rates (no longer cutting), outsiders are once again at a loss. Now, the bears are left clinging to the flawed CAPE metric I wrote about three years ago (see CAPE Smells Like BS), and using political headlines as a theory for record prices (i.e., record stock prices stem from inflated tax cut and infrastructure spending expectations).
It’s unfortunate for the bears that all the conspiracy theory headlines and F.U.D. (fear, uncertainty, and doubt) over the last 10 years have failed miserably as predictors for stock prices. The truth is that stock prices don’t care about headlines – stock prices care about economics. More specifically, stock prices care about profits, interest rates, and supply & demand.
Profits
It’s quite simple. Stock prices have more than tripled since early 2009 because profits have more than tripled since 2009. As you can see from the Macrotrends chart below, 2009 – 2016 profits for the S&P 500 index rose from $6.86 to $94.54, or +1,287%. It’s no surprise either that stock prices stalled for 18 months from 2015 to mid-2016 when profits slowed. After profits returned to growth, stock price appreciation also resumed.

Source: Macrotrends
Interest Rates
When you could earn a +16% on a guaranteed CD bank rate in the early 1980s, do you think stocks were a more or less attractive asset class? If you can sense the rhetorical nature of my question, then you can probably understand why stocks were about as attractive as rotten milk or moldy bread. Back then, stocks traded for about 8x’s earnings vs. the 18x-20x multiples today. The difference is, today interest rates are near generational lows (see chart below), and CDs pay near +0%, thereby making stocks much more attractive. If you think this type of talk is heresy, ignore me and listen to the greatest investor of all-time, Warren Buffett who recently stated:
“Measured against interest rates, stocks are actually on the cheap side.”

Source: Trading Economics
Supply & Demand
Another massively ignored area, as it relates to the health of stock prices, is the relationship of new stock supply entering the market (e.g., new dilutive shares via IPOs and follow-on offerings), versus stock exiting the market through corporate actions. While there has been some coverage placed on the corporate action of share buybacks – about a half trillion dollars of stock being sucked up like a vacuum cleaner by cash heavy companies like Apple Inc. (AAPL) – little attention has been paid to the trillions of dollars of stock vanishing from mergers and acquisition activities. Yes, Snap Inc. (SNAP) has garnered a disproportionate amount of attention for its $3 billion IPO (Initial Public Offering), this is a drop in the bucket compared to the exodus of stock from M&A activity. Consider the trivial amount of SNAP supply entering the market ($3 billion) vs. $100s of billions in major deals announced in 2016 – 2017:
- Time Warner Inc. merger offer by AT&T Inc. (T) for $85 billion
- Monsanto Co. merger offer by Bayer AG (BAYRY) for $66 billion
- Reynolds American Inc. merger offer by British American Tobacco (BTI) for $47 billion
- NXP Semiconductors merger offer by Qualcomm Inc. (QCOM) for $39 billion
- LinkedIn merger offer by Microsoft Corp. (MSFT) for $28 billion
- Jude Medical, Inc. merger offer by Abbott Laboratories (ABT) for $25 billion
- Mead Johnson Nutrition merger offer by Reckitt Benckiser Group for $18 billion
- Mobileye merger offer by Intel Corp. (INTC) for $15 billion
- Netsuite merger offer by Oracle Corp. (ORCL) for $9 billion
- Kate Spade & Co. merger offer by Coach Inc. (COH) for $2 billion
While these few handfuls of deals represent over $300 billion in disappearing stock, as long as corporate profits remain strong, interest rates low, and valuations reasonable, there will likely continue to be trillions of dollars in stocks being purchased by corporations. This continued vigorous M&A activity should provide further healthy support to stock prices.
Admittedly, there will come a time when profits will collapse, interest rates will spike, valuations will get stretched, sentiment will become euphoric, and/or supply of stock will flood the market (see Don’t be a Fool, Follow the Stool). When the balance of these factors turn negative, the risk profile for stock prices will obviously become less desirable. Until then, I will let the skeptics and bears ignore the healthy economic vital signs and call for the death of a healthy patient (stock market). In the meantime, I will continue focus on the basics of math and offer my economics textbook to the doubters.
Wade W. Slome, CFA, CFP®
Plan. Invest. Prosper.
DISCLOSURE: Sidoxia Capital Management (SCM) and some of its clients own AAPL, ABT, INTC, MSFT, T, and certain exchange traded funds, but at the time of publishing SCM had no direct position in SNAP, TWX, MON, KATE, N, MBLY, MJN, STJ, LNKD, NXPI, BAYRY, BTI, QCOM, ORCL, COH, RAI, Reckitt Benckiser Group, any other security referenced in this article. No information accessed through the Investing Caffeine (IC) website constitutes investment, financial, legal, tax or other advice nor is to be relied on in making an investment or other decision. Please read disclosure language on IC “Contact” page.
Searching for the Growth Stock Holy Grail

Remember Research in Motion (now Blackberry Limited – BBRY)? What about Krispy Kreme Doughnuts? How about Crocs (CROX)? Or maybe even Webvan, the online grocery delivery company that went bankrupt during the bursting of the dot-com bubble? These are all examples of once heralded growth companies that lost their mojo along their growth expansion ways.
Not every stock can grow to the $80+ billion market cap stratosphere like Apple Inc. (AAPL), Starbucks Corp. (SBUX), and Wal-Mart Stores (WMT), so finding companies with the right mixture of growth characteristics can be challenging. Objective stock market observers can disagree on the ingredients of a successful growth stock recipe, but generally speaking, the real explosive appreciation in stock prices come from those companies that can compound earnings growth over longer periods of time.
But how can one discover the Holy Grail of compounding earnings? At Sidoxia Capital Management, there are a handful of key factors we look for in successful growth companies. In the hyper-competitive global marketplace, these are crucial questions we want adequately answered before we invest our clients’ money:
- Does the company sell a product or service that cuts costs?
- Does the company offer a product or service with unique entertainment value?
- Does the company offer a superior product or service compared to its competitors?
Even if a target investment can affirmatively answer two or three of these questions, often the most important question is the following:
- Does the company have a sustainable competitive advantage in providing a product or service?
If the company does not have some type of durable competitive advantage, then some other company can just copy the product or service, and sell it at a lower price. This sadly leads to margin and P/E (Price-Earnings) multiple compression – both negative outcomes.
The aforementioned factors are not the end-all, be-all for successful growth stocks, but rather the minimum price of admission. Even if the previous criteria boxes are sufficiently checked off, the company being researched must still be fairly or attractively priced. For example, it doesn’t take a genius to figure out Apple is a successful company with unique advantages. More specifically, the company has $240 billion in cash, $50 billion in profits, and $215 billion in revenue. The real question becomes, is the stock fairly or attractively priced?
Although Apple appears attractively valued at current prices, in many other instances that is not the case. Often, great companies have been discovered by a large swath of investors, and therefore trade at significant premiums, which increases the risk profile or reduces the upside potential of the investment.
Sucking the Last Puff
If a company’s product or service isn’t superior, cut costs, or entertain at a reasonable/attractive valuation, then investing is like taking the last puff or drag out of a cigarette butt. Some value investors are good at this craft, but often these managers get caught into so-called “value traps” – ask Bill Ackman about Valeant Pharmaceuticals (VRX). Many value investors thought they found a bargain when they bought Valeant shares after it fell -80% in price. The stock subsequently has fallen another -50%…ouch!.
It’s worth noting that growth can come from many different areas. Even mature industries can produce periods of cyclical growth, however identifying cyclical winners is challenging. The art for the investment manager is determining whether growth in a target investment is sustainable. In many instances, companies temporarily benefit from a rising tide that lifts all boats, before the tide goes out and sinks fundamentals down to lower levels.
Growth investing can be a dangerous hobby for short-term traders because the price volatility stemming from ever-changing earnings growth expectations creates excessive trading, taxes, and transaction costs. However, for long-term investors, the great growth manager, T. Rowe Price, summed it up best here:
“The growth stock theory of investing requires patience, but is less stressful than trading, generally has less risk, and reduces brokerage commissions and income taxes.”
Growth investing is both a science and an art, but does not require a degree in rocket science. If you can focus on the important growth criteria, and combine it with a long-term disciplined valuation process, you will be well on your way to discovering the growth stock Holy Grail.
Wade W. Slome, CFA, CFP®
Plan. Invest. Prosper.
DISCLOSURE: Sidoxia Capital Management (SCM) and some of its clients hold positions in AAPL and certain exchange traded funds (ETFs), but at the time of publishing had no direct position in VRX, BBRY, SBUX, WMT, CROX, Krispy Kreme, Webvan, or any other security referenced in this article. No information accessed through the Investing Caffeine (IC) website constitutes investment, financial, legal, tax or other advice nor is to be relied on in making an investment or other decision. Please read disclosure language on IC Contact page.
EBITDA: Sniffing Out the Truth

Financial analysts are constantly seeking the Holy Grail when it comes to financial metrics, and to some financial number crunchers, EBITDA (Earnings Before Interest Taxes Depreciation and Amortization – pronounced “eebit-dah”) fits the bill. On the flip side, Warren Buffett’s right hand man Charlie Munger advises investors to replace EBITDA with the words “bullsh*t earnings” every time you encounter this earnings metric. We’ll explore the good, bad, and ugly attributes of this somewhat controversial financial metric.
The Genesis of EBITDA
The origin of the EBITDA measure can be traced back many years, and rose in popularity during the technology boom of the 1990s. “New Economy” companies were producing very little income, so investment bankers became creative in how they defined profits. Under the guise of comparability, a company with debt (Company X) that was paying high interest expenses could not be compared on an operational profit basis with a closely related company that operated with NO debt (Company Z). In other words, two identical companies could be selling the same number of widgets at the same prices and have the same cost structure and operating income, but the company with debt on their balance sheet would have a different (lower) net income. The investment banker and company X’s answer to this apparent conundrum was to simply compare the operating earnings or EBIT (Earnings Before Interest and Taxes) of each company (X and Z), rather than the disparate net incomes.
The Advantages of EBITDA
Although there is no silver bullet metric in financial statement analysis, nevertheless there are numerous benefits to using EBITDA. Here are a few:
- Operational Comparability: As implied above, EBITDA allows comparability across a wide swath of companies. Accounting standards provide leniency in the application of financial statements, therefore using EBITDA allows apples-to-apples comparisons and relieves accounting discrepancies on items such as depreciation, tax rates, and financing choice.
- Cash Flow Proxy:Since the income statement traditionally is the financial statement of choice, EBITDA can be easily derived from this statement and provides a simple proxy for cash generation in the absence of other data.
- Debt Coverage Ratios:In many lender contracts, certain debt provisions require specific levels of income cushion above the required interest expense payments. Evaluating EBITDA coverage ratios across companies assists analysts in determining which businesses are more likely to default on their debt obligations.
The Disadvantages of EBITDA
While EBITDA offers some benefits in comparing a broader set of companies across industries, the metric also carries some drawbacks.
- Overstates Income: To Charlie Munger’s point about the B.S. factor, EBITDA distorts reality by measuring income before a bunch of expenses. From an equity holder’s standpoint, in most instances, investors are most concerned about the level of income and cash flow available AFTERaccounting for all expenses, including interest expense, depreciation expense, and income tax expense.
- Neglects Working Capital Requirements: EBITDA may actually be a decent proxy for cash flows for many companies, however this profit measure does not account for the working capital needs of a business. For example, companies reporting high EBITDA figures may actually have dramatically lower cash flows once working capital requirements (i.e., inventories, receivables, payables) are tabulated.
- Poor for Valuation: Investment bankers push for more generous EBITDA valuation multiples because it serves the bankers’ and clients’ best interests. However, the fact of the matter is that companies with debt or aggressive depreciation schedules do deserve lower valuations compared to debt-free counterparts (assuming all else equal).
Wading through the treacherous waters of accounting metrics can be a dangerous game. Despite some of EBITDA’s comparability benefits, and as much as bankers and analysts would like to use this very forgiving income metric, beware of EBITDA’s shortcomings. Although most analysts are looking for the one-size-fits-all number, the reality of the situation is a variety of methods need to be used to gain a more accurate financial picture of a company. If EBITDA is the only calculation driving your analysis, I urge you to follow Charlie Munger’s advice and plug your nose.
Wade W. Slome, CFA, CFP®
Plan. Invest. Prosper.
DISCLOSURE: Sidoxia Capital Management (SCM) and some of its clients hold positions in certain exchange traded funds (ETFs), but at the time of publishing had no direct position in any other security referenced in this article. No information accessed through the Investing Caffeine (IC) website constitutes investment, financial, legal, tax or other advice nor is to be relied on in making an investment or other decision. Please read disclosure language on IC Contact page.
Brexit-Schmexit

Do you remember the panic-inducing headlines related to PIIGS, Crimea, Ebola, Cyprus, and the Flash Crash? Probably not. But if you do remember, these false alarms have likely been relegated to the financial memory graveyard, along with the many other sensationalist news events that have been killed off in the post-financial crisis era. Time will tell whether Brexit dies off or becomes a resurrected concern, like the repeating fears of a China slowdown or Greek collapse. Regardless, as the S&P 500 stock index reaches new all-time record highs, investors are currently shrug off the noise while muttering, “Brexit-Schmexit.”
Individuals have tried to use scary headlines as a timing tool to consistently time market corrections for all of recorded history. Unfortunately, emotional, knee-jerk reactions to alarming news stories rarely is the best strategy. Famed fund manager Peter Lynch said it best when he noted,
“Far more money has been lost by investors preparing for corrections, or trying to anticipate corrections, than has been lost in corrections themselves.”
Having invested for some 25 years, experience has taught me not only is conventional wisdom often wrong, but it also is frequently an accurate contrarian indicator. In other words, frightening news often should be an indicator to buy…not sell. Case in point is the U.K. European Union referendum. The Brexit referendum “Leave” vote caught virtually everyone by surprise, but the rebound in stock prices to new record highs may be even more surprising to most observers. However, for investors following the key factors of interest rates, profits, valuation, and sentiment (see also Don’t Be a Fool, Follow the Stool), may not be shocked by the positive price action.
- Interest Rates: For starters, you don’t have to be a genius to realize that stocks become more attractive when there is a scarcity of investment alternatives. When there are an estimated $13 trillion of negative interest rate bonds, a layman can quickly understand a 2%, 3%, or 4% dividend yield offered on certain stocks (and funds) can represent a much more attractive opportunity. With interest rates at record lows (see chart below), the overall dividend yield of stocks has provided a floor for stock prices and has limited the depth and duration of sell-offs and corrections.
Source: Calafia Beach Pundit
- Profits: Corporate profits are near record highs but have been sluggish due to several factors, including the negative impact of the strong dollar on multinational exports; the depressing effect of declining interest rates on the banking sector’s net interest profit margins; the general decline in oil and commodity prices; and general lethargic economic growth overall in international markets (emerging and developed economies). Encouragingly, a stabilization in the value of the U.S. dollar, along with a rebound in energy prices augurs well for a potential shift back to earnings growth in the coming quarters.
- Valuation: On a valuation basis, the Price/Earnings ratio of the stock market is about 10-15% above historical averages (see chart below). The average S&P 500 stock price trades around 19x’s the value of trailing twelve-month earnings. However, in the context of all-time record low-interest rates, a premium valuation is well deserved, especially for those companies paying a dividend and growing their bottom line.
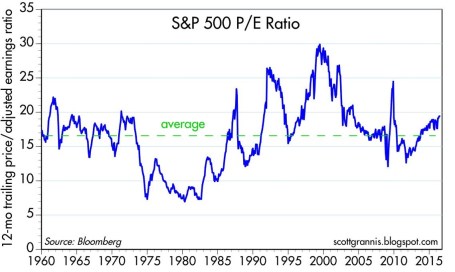
Source: Calafia Beach Pundit
- Sentiment: Since the Great Financial Crisis / Recession, there has been about $1.5 trillion in equity investments that have been pulled out of U.S. equity mutual funds. This statistic is a clear sign of the extreme risk aversion and pervasive pessimism. Despite money flowing out of equity funds, corporations have bolstered the upward trajectory in stock prices with hundreds of billions in corporate stock buybacks and trillions in mergers & acquisition transactions. With all the universal jitteriness, I like to remind investors of Warren Buffett’s credo, “Buy fear, and sell greed.”
Brexit-Schmexit NOT Brexit-Panic
Despite the risk aversion in the marketplace, stock prices in the U.S. continue to grind higher to record levels. The stock market is currently communicating interest rates, profits, valuation, and sentiment are more important factors to price direction than are Brexit and other geopolitical concerns.
The silver lining behind severe investor skepticism is the creation of additional investment opportunities. As famous investor Sir John Templeton stated regarding stock market cycles, “Bull markets are born on pessimism and they grow on skepticism, mature on optimism, and die on euphoria.” Even the most objective observers have difficulty pointing to a broad set of indicators signaling euphoria, and the recent Turkish military coup attempt and domestic gun violence incidents will not squash out the negativity. Until optimism and elation rule the day, there’s no need to worry-schworry.
Wade W. Slome, CFA, CFP®
Plan. Invest. Prosper.
DISCLOSURE: Sidoxia Capital Management (SCM) and some of its clients hold positions in certain exchange traded funds , but at the time of publishing had no direct position in any other security referenced in this article. No information accessed through the Investing Caffeine (IC) website constitutes investment, financial, legal, tax or other advice nor is to be relied on in making an investment or other decision. Please read disclosure language on IC Contact page.
Michael Jordan and Market Statistics

Basketball is in the air as the NBA playoffs are once again upon us. While growing up in high school, Michael Jordan was my basketball idol, and he dominated the sport globally at the highest level. I was a huge fanatic. Besides continually admiring my MJ poster-covered walls, I even customized my own limited edition Air Jordan basketball shoes by applying high school colors to them with model paint – I would not recommend this fashion experiment to others.
Eventually the laws of age, physics, and gravity took over, as Jordan slowly deteriorated physically into retirement. On an infinitesimally smaller level, I also experienced a similar effect during my 30s when playing in an old man’s recreational basketball league. Day-by-day, month-by-month, and year-by-year, I too got older and slower (tough to believe that’s possible) as I watched all the 20-somethings run circles around me – not to mention my playing time was slashed dramatically. Needless to say, I too was forced into retirement like Michael Jordan, but nobody retired my number, and I still have not been inducted into the Hall of Fame.

“Air Wade” Before Retirement: No Photoshop in 1988, just an optical illusion created by an 8-foot rim.
Financial markets are subject to similar laws of science (economics) too. The stock market and the economy get old and tired just like athletes, as evidenced by the cyclical nature of bear markets and recessions. Statistics are a beautiful thing when it comes to sports. Over the long run, numbers don’t lie about the performance of an athlete, just like statistics over the long run don’t lie about the financial markets. When points per game, shooting percentage, rebounds, assists, minutes played, and other measurements are all consistently moving south, then it’s safe to say fundamentals are weakening.
I’ve stated it many times in the past, and I’ll state it again, these are the most important factors to consider when contemplating the level and direction of the stock market (see also Don’t Be a Fool, Follow the Stool).
- Profits
- Interest Rates
- Valuations
- Sentiment
While the absolute levels of these indicators are important, the trend or direction of each factor is also very relevant. Let’s review these factors a little more closely.
- Profits: Profits and cash flows, generally speaking, are the lifeblood behind any investment and currently corporate profits are near record levels. When it comes to the S&P 500, the index is currently expected to generate a 2016 profit of $117.47. Considering a recent price closing of 2,092 on the index, this translates into a price-earnings ratio (P/E) of approximately 17.8x or a 5.6% earnings yield. This earnings yield can be compared to the 1.9% yield earned on the 10-Year Treasury Note, which is even lower than the 2.1% dividend yield on the S&P 500 (a rare historical occurrence). If history repeats itself, the 5.6% earnings yield on stocks should double to more than 10% over the next decade, however the yield on 10-year Treasuries stays flat at 1.9% over the next 10 years. The strong dollar and the implosion of the energy sector has put a lid on corporate profits over the last year, but emerging signs are beginning to show these trends reversing. Stabilizing profits near record levels should be a positive contributor to stocks, all else equal.
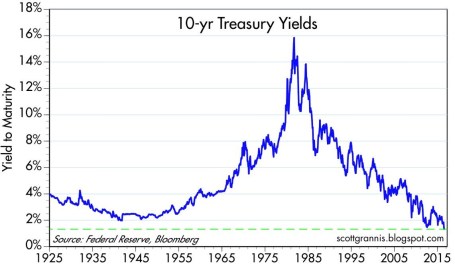
- Interest Rates: Pundits have been pointing to central banks as the sole reason for low/negative interest rates globally (see chart below). NEWS FLASH: Central banks have been increasing and decreasing interest rates for decades, but that hasn’t stopped the nearly unabated 36-year decline in interest rates and inflation (see chart below). As I described in previous articles (see Why 0% Rates?), technology, globalization, and the rise of emerging markets is having a much larger impact on interest rates/inflation than monetary policies. If central banks are so powerful, then why after eight years of loose global monetary policies hasn’t inflation accelerated yet? Regardless, all else equal, these historically low interest rates are horrible for savers, but wonderful for equity investors and borrowers.

Source: Calafia Beach Pundit
- Valuations: The price you pay for an investment is one of the, if not the, most important factors to consider. I touched upon valuations earlier when discussing profits, and based on history, there is plenty of evidence to support the position that valuations are near historic averages. Shiller CAPE bears have been erroneously screaming bloody murder over the last seven years as prices have tripled (see Shiller CAPE smells like BS). A more balanced consideration of valuation takes into account the record low interest rates/inflation (see The Rule of 20).
- Sentiment: There are an endless number of indicators measuring investor optimism vs. pessimism. Generally, most experienced investors understand these statistics operate as valuable contrarian indicators. In other words, as Warren Buffett says, it is best to “buy fear, and sell greed.” While I like to track anecdotal indicators of sentiment like magazine covers, I am a firm believer that actions speak louder than words. If you consider the post-crisis panic of dollars flowing into low yielding bonds – greater than $1 trillion more than stocks (see Chicken vs. Beef ) you will understand the fear and skepticism remaining in investors minds. The time to flee stocks is when everyone falls in love with them.
Readers of Michael Lewis’s book Moneyball understand the importance statistics can play in winning sports. Michael Jordan may not have been a statistician like Billy Beane, because he spent his professional career setting statistical records, not analyzing them. Unfortunately, my basketball career never led me to the NBA or Hall of Fame, but I still hope to continue winning in the financial markets by objectively following the all-important factors of profits, interest rates, valuations, and sentiment.
Wade W. Slome, CFA, CFP®
Plan. Invest. Prosper.
DISCLOSURE: Sidoxia Capital Management (SCM) and some of its clients hold positions in certain exchange traded funds (ETFs), but at the time of publishing had no direct position in any security referenced in this article. No information accessed through the Investing Caffeine (IC) website constitutes investment, financial, legal, tax or other advice nor is to be relied on in making an investment or other decision. Please read disclosure language on IC Contact page.
The Art of Catching Falling Knives

“In the middle of every difficulty lies an opportunity.” ~Albert Einstein
It was a painful week for bullish investors in the stock market as evidenced by the -1,018 point drop in the Dow Jones Industrial Average, equivalent to approximately a -6% decline. The S&P 500 index did not fare any better, and the loss for the tech-heavy NASDAQ index was down closer to -7% for the week.
The media is attributing much of the short-term weakness to a triple Chinese whammy of factors: 1) Currency devaluation of the Yuan; 2) Weaker Chinese manufacturing data registering in at the lowest level in over six years; and 3) A collapsing Chinese stock market.
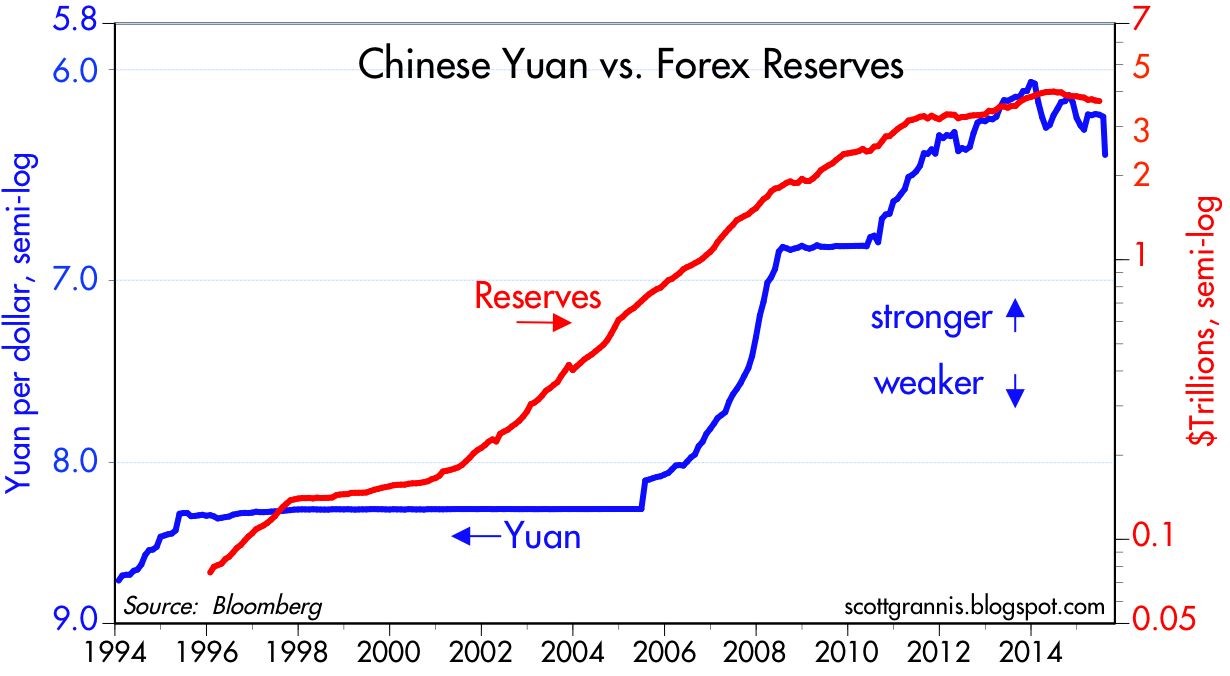
As the second largest economy on the planet, developments in China should not be ignored, however these dynamics should be put in the proper context. With respect to China’s currency devaluation, Scott Grannis at Calafia Beach Pundit puts the foreign exchange developments in proper perspective. If you consider the devaluation of the Yuan by -4%, this change only reverses a small fraction of the Chinese currency appreciation that has taken place over the last decade (see chart below). Grannis rightfully points out the -25% collapse in the value of the euro relative to the U.S. dollar is much more significant than the minor move in the Yuan. Moreover, although the move by the People’s Bank of China (PBOC) makes America’s exports to China less cost competitive, this move by Chinese bankers is designed to address exactly what investors are majorly concern about – slowing growth in Asia.
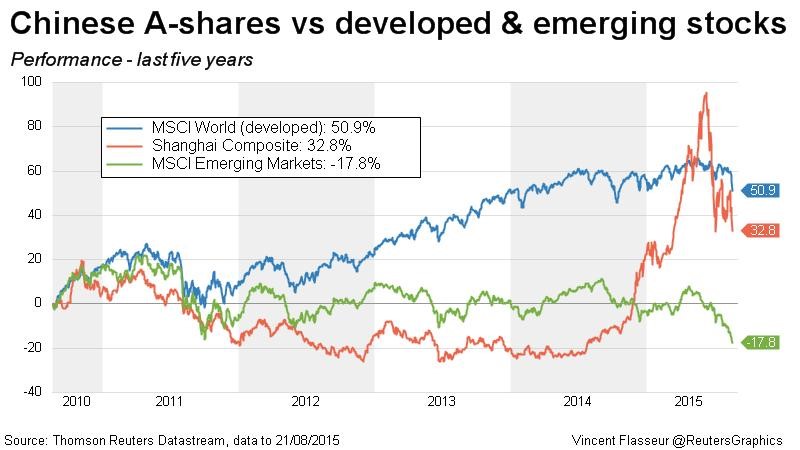
Although the weak Chinese manufacturing data is disconcerting, this data is nothing new – the same manufacturing data has been very choppy over the last four years. On the last China issue relating to its stock market, investors should be reminded that despite the massive decline in the Shanghai Composite, the index is still up by more than +50% versus a year ago (see chart below)
Fear the Falling Knife?
Given the fresh carnage in the U.S. and foreign markets, is now the time for investors to attempt to catch a falling knife? Catching knives for a living can be a dangerous profession, and many investors – professionals and amateurs alike – have lost financial fingers and blood by attempting to prematurely purchase plummeting securities. Rather than trying to time the market, which is nearly impossible to do consistently, it’s more important to have a disciplined, unemotional investing framework in place.
Hall of Fame investor Peter Lynch sarcastically highlighted the difficulty in timing the market, “I can’t recall ever once having seen the name of a market timer on Forbes‘ annual list of the richest people in the world. If it were truly possible to predict corrections, you’d think somebody would have made billions by doing it.”
Readers of my blog, Investing Caffeine understand I am a bottom-up investor when it comes to individual security selection with the help of our proprietary S.H.G.R. model, but those individual investment decisions are made within Sidoxia’s broader, four-pronged macro framework (see also Don’t be a Fool, Follow the Stool). As a reminder, driving our global views are the following four factors: a) Profits; b) Interest rates; c) Sentiment; and Valuations. Currently, two of the four indicators are flashing green (Interest rates and Sentiment), and the other two are neutral (Profits and Valuations).
- Profits (Neutral): Profits are at record highs, but a strong dollar, weak energy sector, and sluggish growth internationally have slowed the trajectory of earnings.
- Valuation (Neutral): At an overall P/E of about 18x’s profits for the S&P 500, current valuations are near historical averages. For CAPE investors who have missed the tripling in stock prices, you can reference prior discussions (see CAPE Smells Like BS). I could make the case that stocks are very attractive with a 6% earnings yield (inverse P/E ratio) compared to a 2% 10—Year Treasury bond, but I’ll take off my rose-colored glasses.
- Interest Rates (Positive): Rates are at unambiguously low levels, which, all else equal, is a clear-cut positive for all cash generating asset classes, including stocks. With an unmistakably “dovish” Federal Reserve in place, whether the 0.25% interest rate hike comes next month, or next year will have little bearing on the current shape of the yield curve. Chairman Yellen has made it clear the trajectory of rate increases will be very gradual, so it will take a major shift in economic trends to move this factor into Neutral or Negative territory.
- Sentiment (Positive): Following the investment herd can be very dangerous for your financial health. We saw that in spades during the late-1990s in the technology industry and also during the mid-2000s in the housing sector. As Warren Buffett says, it is best to “buy fear and sell greed” – last week we saw a lot of fear.
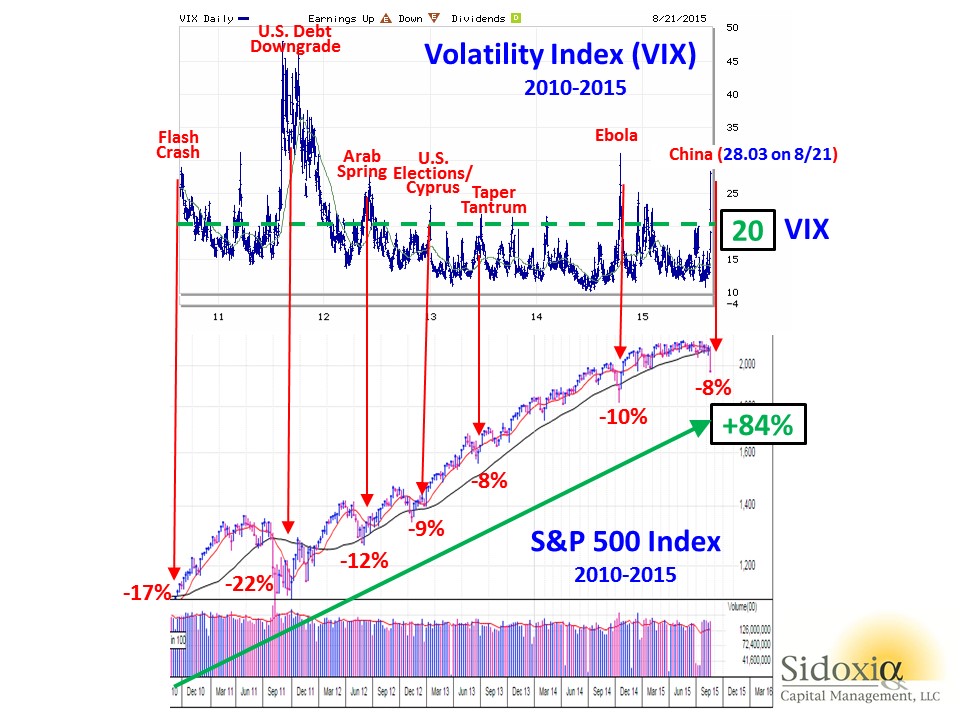
In addition to the immense outflows out of stock funds (see also Great Rotation) , panic was clearly evident in the market last week as shown by the Volatility Index (VIX), a.k.a., the “Fear Gauge.” In general, volatility over the last five years has been on a declining trend, however every 6-12 months, some macro concern inevitably rears its ugly head and volatility spikes higher. With the VIX exploding higher by an amazing +118% last week to a level of 28.03, it is proof positive how quickly sentiment can change in the stock market.
Not much in the investing world works exactly like science, but buying stocks during previous fear spikes, when the VIX level exceeds 20, has been a very lucrative strategy. As you can see from the chart below, there have been numerous occasions over the last five years when the over-20 level has been breached, which has coincided with temporary stock declines in the range of -8% to -22%. However, had you held onto stocks, without adding to them, you would have earned an +84% return (excluding dividends) in the S&P 500 index. Absent the 2011 period, when investors were simultaneously digesting a debt downgrade, deep European recession, and domestic political fireworks surrounding a debt ceiling, these periods of elevated volatility have been relatively short-lived.
Whether this will be the absolute best time to buy stocks is tough to say. Stocks are falling like knives, and in many instances prices have been sliced by more than -10%, -20%, or -30%. It’s time to compile your shopping list, because valuations in many areas are becoming more compelling and eventually gravity will run its full course. That’s when your strategy needs to shift from avoiding the falling knives to finding the bouncing tennis balls…excuse me while I grab my tennis racket.

Wade W. Slome, CFA, CFP®
Plan. Invest. Prosper.
DISCLOSURE: Sidoxia Capital Management (SCM) and some of its clients hold positions in certain exchange traded funds (ETFs) including emerging market/Chinese ETFs, but at the time of publishing, SCM had no direct position in any other security referenced in this article. No information accessed through the Investing Caffeine (IC) website constitutes investment, financial, legal, tax or other advice nor is to be relied on in making an investment or other decision. Please read disclosure language on IC Contact page.


