Posts tagged ‘P/E ratios’
You Can’t Kiss Every Pretty Girl (…or Handsome Boy)

There are a lot of pretty girls in the world, and there are a lot of sexy stocks in the stock market, but not even the most eligible bachelor (or bachelorettes) are able to kiss all the beautiful people in the world. The same principle applies to the stock market. The most successful investors have a disciplined process of waiting for the perfect mate to cross their path, rather than chasing every tempting mistress.
Happily married to my current portfolio, I continually bump into attractive candidates that try to seduce me into buying. For me, these sexy equities typically come in the shape of high P/E ratios (Price/Earnings) and rapid sales growth rates. It’s fun to date (or rent) these sexy stocks, but the novelty often wears off quickly and the euphoric sensation can disappear rapidly – just like real-world dating. Case in point is the reality dating shows, the Bachelor and Bachelorette. Over 27 combined seasons, of which I sheepishly admit seeing a few, only five of the couples remain together today. While it may be enjoyable to vicariously watch bevies of beautiful people hook-up, the harsh reality is that the success rate is abysmal, similar to the results in chasing darling stocks (see also Riding the Wave).
Well-known strategist and investor Barton Biggs once said, “A bull market is like sex. It feels best just before it ends.” The same goes with chasing pricey momentum stocks – what looks pretty in the short-run can turn ugly in a blink of the eye. For example, if you purchased the following basket of top 10 performing stocks of 2012 (+118% average return excluding dividends), you would have underperformed the market by -16% if you owned until today.

Warren Buffett understands hunting for short-term relationships may be thrilling, but this strategy often leads to tears and heartbreak. Buffett summarized the importance of selectivity here:
“I could improve your ultimate financial welfare by giving you a ticket with only twenty slots in it so that you had twenty punches – representing all the investments that you got to make in a lifetime. And once you’d punched through the card, you couldn’t make any more investments at all. Under those rules, you’d really think carefully about what you did, and you’d be forced to load up on what you’d really thought about. So you’d do so much better.”
Rather than hungering for the spiciest stocks, it’s best to find a beauty before she becomes Miss America, because at that point, everybody wants to date her and the price is usually way too expensive. If you stay selective and patient while realizing you can’t kiss every pretty girl, then you can prevent the stock market from breaking your heart.
Wade W. Slome, CFA, CFP®
Plan. Invest. Prosper.
DISCLOSURE: Sidoxia Capital Management (SCM) and some of its clients hold long positions in certain exchange traded funds (ETFs), but at the time of publishing SCM had no direct position in PHM, MHO, CVI, EXPE, HFS, DDS, LEN, MPC. TSO, GPS, BRKA/B, or any other security referenced in this article. No information accessed through the Investing Caffeine (IC) website constitutes investment, financial, legal, tax or other advice nor is to be relied on in making an investment or other decision. Please read disclosure language on IC Contact page.
Sports, Stocks, & the Magic Quadrants
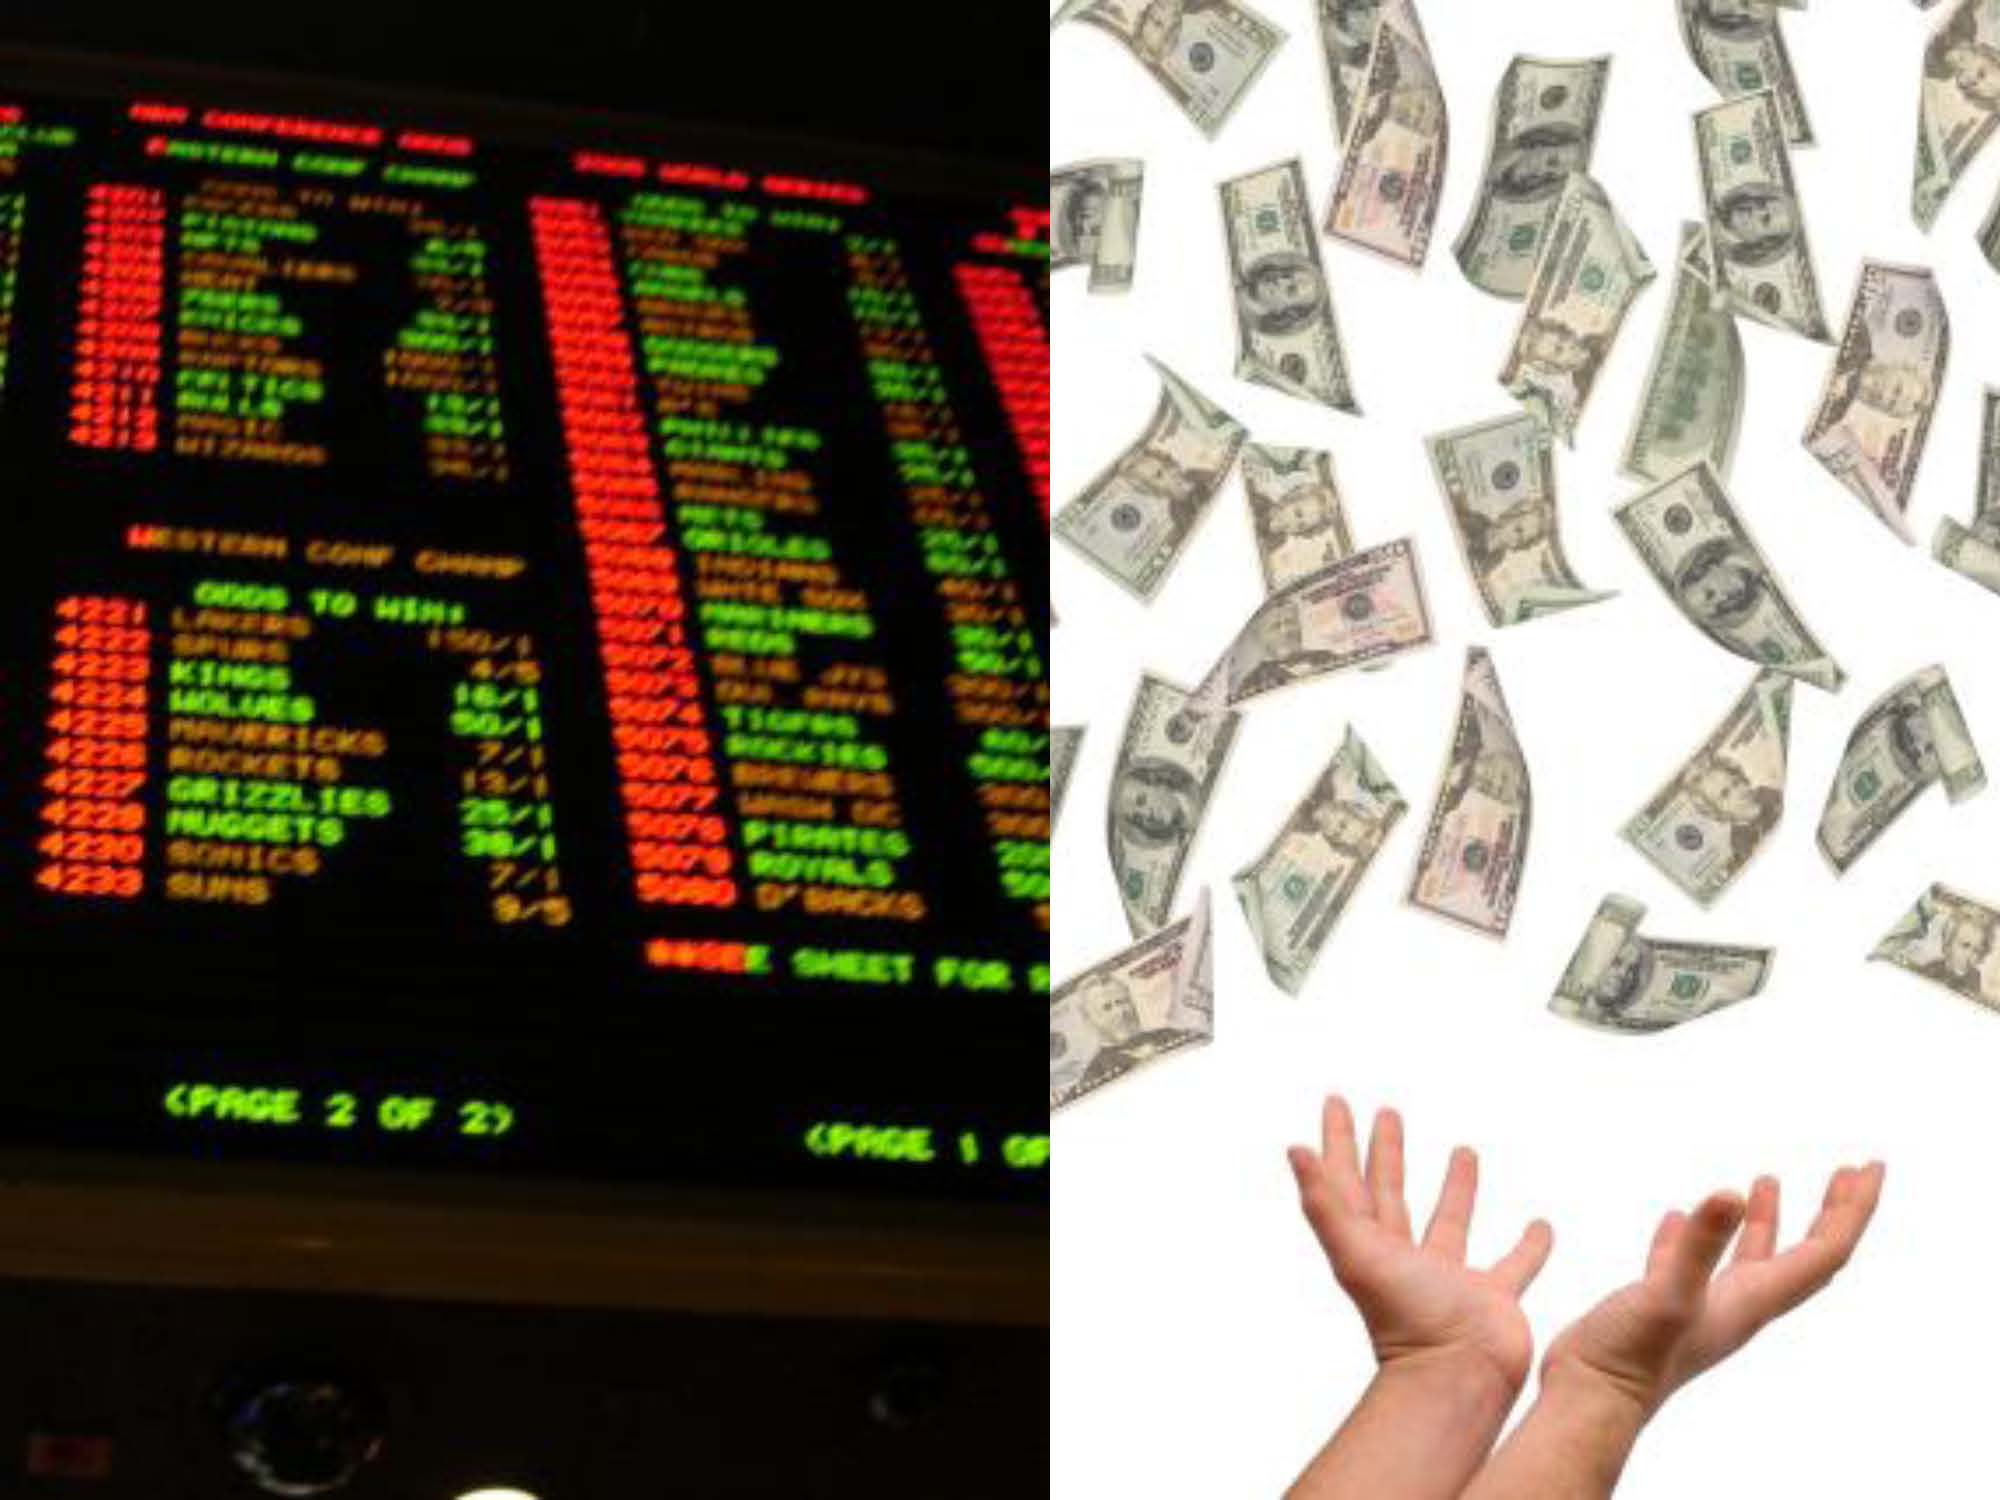
Picking stocks is a tricky game and so is sports betting. With the NFL and NCAA football seasons swinging into full gear, understanding the complexity of making money in the stock market can be explained in terms of professional sports-betting. Anybody who has traveled to Las Vegas and bet on a sporting event, understands that choosing a winner of a game simply is not enough…you also need to forecast how many points you think a certain team will win by (see also What Happens in Vegas, Stays on Wall Street). In the world of sports, winning/losing is measured by point spreads. In the world of stocks, winning/losing is measured by valuation (e.g., Price/Earnings ratios).
To make my point, here is a sports betting example from a handful years back:
Florida Gators vs. Charleston Southern Buccaneers (September 2009): Without knowing a lot about the powerhouse Southern Buccaneers squad from South Carolina, 99% of respondents, when asked before the game who would win, would unanimously select Florida – a consistently dominant, national franchise, powerhouse program. The question becomes a little trickier when participants are asked, “Will the Florida Gators win by more than 63 points?” Needless to say, although the Buccs kept it close in the first half, and only trailed by 42-3 at halftime, the Gators still managed to squeak by with a 62-3 victory. Worth noting, had you selected Florida, the overwhelming favorite, the 59 point margin of victory would have resulted in a losing wager (see picture below).

If investing and sports betting were easy, everybody would do it. The reason sports betting is so challenging is due to very intelligent statisticians and odds-makers that create very accurate point spreads. In the investing world, a broad swath of traders, market makers, speculators, investment bankers, and institutional/individual investors set equally efficient valuations.
The goal in investing is very similar to sports betting. Successful professionals in both industries are able to consistently identify inefficiencies and then exploit them. Inefficiencies occur for a bettor when point spreads are too high or low, while investors identify inefficient prices in the marketplace (undervalued or overvalued).
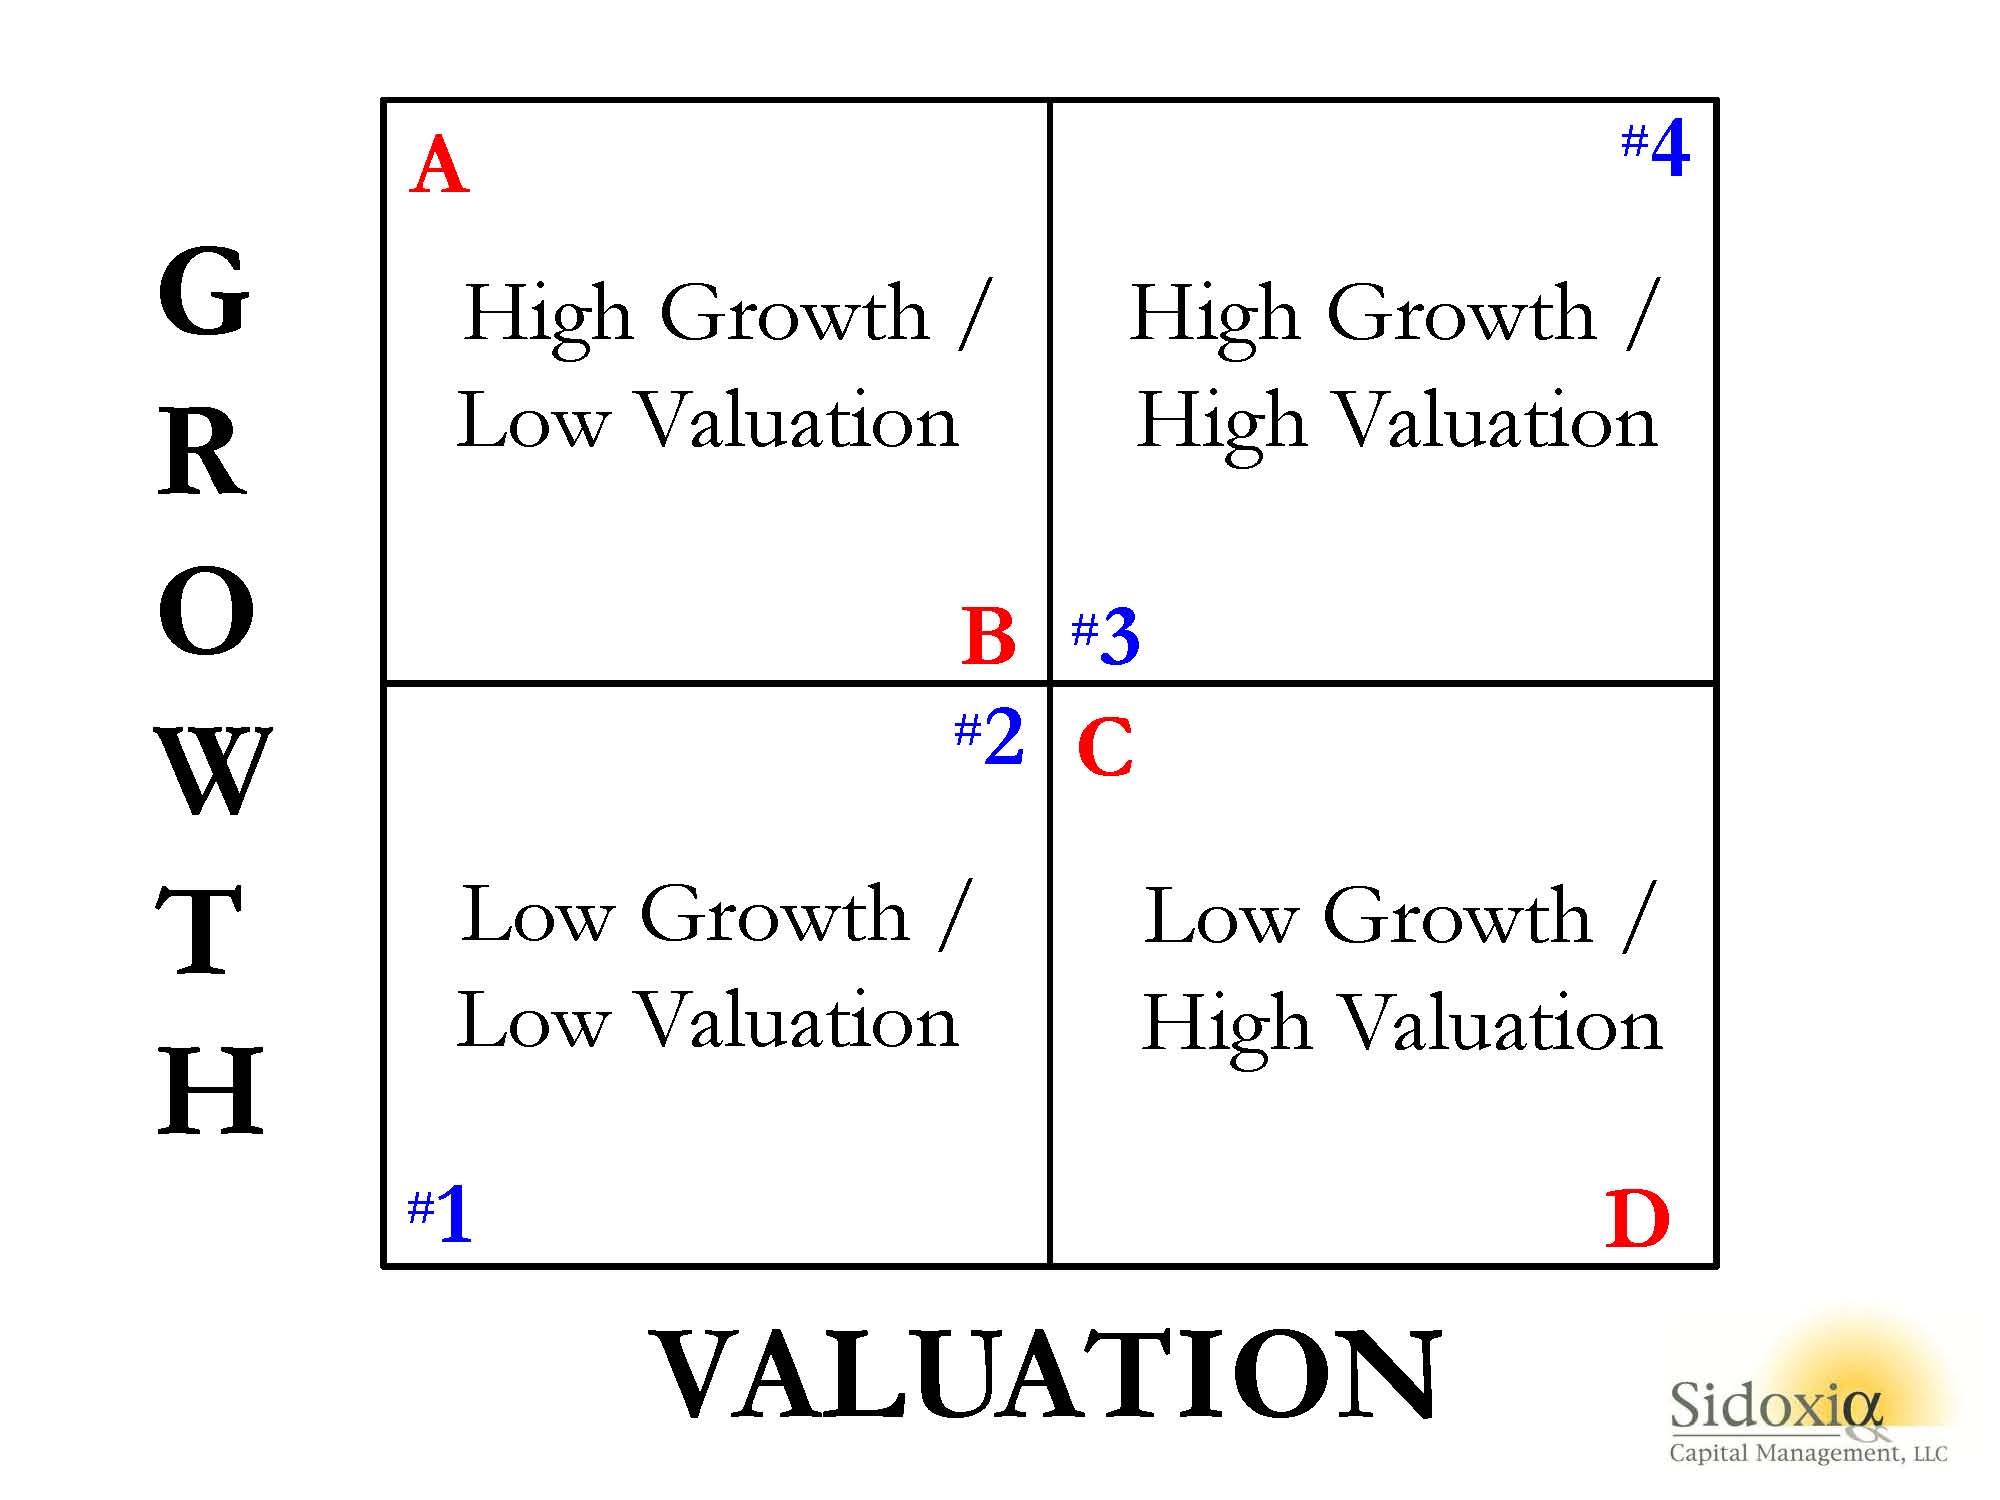
To illustrate my point, let’s take a look at Sidoxia’s “Magic Quadrant“:
 A-B-Cs & 1-2-3s
What Sidoxia’s “Magic Quadrant” demonstrates is a framework for evaluating stocks. By devoting a short period of time reviewing the quadrants, it becomes apparent fairly quickly that Stock A is preferred over Stock B, which is preferred over Stock C, which is preferred over Stock D. In each comparison, the former is preferred over the latter because the earlier letters all have higher growth, and lower (cheaper) valuations. The same relative attractive relationships cannot be applied to stocks #1, #2, #3, and #4. Each successive numbered stock has higher growth, but in order to obtain that higher growth, investors must pay a higher valuation. In other words, Stock #1 has an extremely low valuation with low growth, while Stock #4 has high growth, but an investor must pay an extremely high valuation to own it.
While debating the efficiency of the stock market can escalate into a religious argument, I would argue the majority of stocks fall in the camp of #1, #2, #3, or #4. Or stated differently, you get what you pay for. For example, investors are paying a much higher valuation (~100x 2014 P/E) for Tesla Motors, Inc (TSLA) for its rapid electric car growth vs. paying a much lower valuation (~10x 2014 P/E) for Pitney Bowes Inc (PBI) for its mature mail equipment business.
The real opportunities occur for those investors capable of identifying companies in the upper-left quadrant (i.e., Stock A) and lower-right quadrant (i.e., Stock D). If the analysis is done correctly, investors will load up on the undervalued Stock A and aggressively short the expensive Stock D. Sidoxia has its own proprietary valuation model (Sidoxia Holy Grail Ranking – SHGR or a.k.a. “SUGAR”) designed specifically to identify these profitable opportunities.
The professions of investing and sports betting are extremely challenging, however establishing a framework like Sidoxia’s “Magic Quadrants” can help guide you to find inefficient and profitable investment opportunities.
Wade W. Slome, CFA, CFP®
Plan. Invest. Prosper.
DISCLOSURE: Sidoxia Capital Management (SCM) and some of its clients hold positions in certain exchange traded funds (ETFs), but at the time of publishing, SCM had no direct position in TSLA, PBI, or any other security referenced in this article. No information accessed through the Investing Caffeine (IC) website constitutes investment, financial, legal, tax or other advice nor is the information to be relied on in making an investment or other decision. Please read disclosure language on IC Contact page.
Sleeping Through Bubbles and Decade Long Naps

We have lived through many investment bubbles in our history, and unfortunately most investors sleep through the early wealth-creating inflation stages. Typically, the average investor wakes up later to a hot idea once every man, woman, and child has identified the clear trend…right as the bubble is about burst. Sadly, the masses do a great job of identifying financial bubbles at the end of a cycle, but have a tougher time realizing the catastrophic consequences of exiting a tired winner. Or as strategist Jim Stack states, “Bubbles, for the most part, are invisible to those trapped inside the bubble.” The challenge of recognizing bubbles explains why they are more easily classified as bubbles after a colossal collapse occurs. For those speculators chasing a precise exit point on a bubblicious investment, they may be better served by waiting for the prick of the bubble, then take a decade long nap before revisiting the fallen angel investment idea.
Even for the minority of pundits and investors who are able to accurately identify these financial bubbles in advance, a much smaller number of these professionals are actually able to pinpoint when the bubble will burst. Take for example Alan Greenspan, the ex-Federal Reserve Chairman from 1987 to 2006. He managed to correctly identify the technology bubble in late-1996 when he delivered his infamous “irrational exuberance” speech, which questioned the high valuation of the frothy, tech-driven stock market. The only problem with Greenspan’s speech was his timing was massively off. Stated differently, Greenspan was three years premature in calling out the pricking of the bubble, as the NASDAQ index subsequently proceeded to more than triple from early 1997 to early 2000 (the index exploded from about 1,300 to over 5,000).
One of the reasons bubbles are so difficult to time during their later stages is because the deflation period occurs so quickly. As renowned value investor Howard Marks fittingly notes, “The air always goes out a lot faster than it went in.”
Bubbles, Bubbles, Everywhere
Financial bubbles do not occur every day, but thanks to the psychological forces of investor greed and fear, bubbles do occur more often than one might think. As a matter of fact, famed investor Jeremy Grantham claims to have identified 28 bubbles in various global markets since 1920. Definitions vary, but Webster’s Dictionary defines a financial bubble as the following:
A state of booming economic activity (as in a stock market) that often ends in a sudden collapse.
Although there is no numerical definition of what defines a bubble or collapse, the financial crisis of 2008 – 2009, which was fueled by a housing and real estate bubble, is the freshest example in most people minds. However, bubbles go back much further in time – here are a few memorable ones:
Dutch Tulip-Mania: Fear and greed have been ubiquitous since the dawn of mankind, and those emotions even translate over to the buying and selling of tulips. Believe it or not, some 400 years ago in the 1630s, individual Dutch tulip bulbs were selling for the same prices as homes ($61,700 on an inflation adjusted basis). This bubble ended like all bubbles, as you can see from the chart below.

Source: The Stock Market Crash.net
British Railroad Mania: In the mid-1840s, hundreds of companies applied to build railways in Britain. Like all bubbles, speculators entered the arena, and the majority of companies went under or got gobbled up by larger railway companies.
Roaring 20s: Here in the U.S., the Roaring 1920s eventually led to the great Wall Street Crash of 1929, which finally led to a nearly -90% plunge in the Dow Jones Industrial stock index over a relatively short timeframe. Leverage and speculation were contributors to this bust, which resulted in the Great Depression.
Nifty Fifty: The so-called Nifty Fifty stocks were a concentrated set of glamour stocks or “Blue Chips” that investors and traders piled into. The group of stocks included household names like Avon (AVP), McDonald’s (MCD), Polaroid, Xerox (XRX), IBM and Disney (DIS). At the time, the Nifty Fifty were considered “one-decision” stocks that investors could buy and hold forever. Regrettably, numerous of these hefty priced stocks (many above a 50 P/E) came crashing down about 90% during the1973-74 period.
Japan’s Nikkei: The Japanese Nikkei 225 index traded at an eye popping Price-Earnings (P/E) ratio of about 60x right before the eventual collapse. The value of the Nikkei index increased over 450% in the eight years leading up to the peak in 1989 (from 6,850 in October 1982 to a peak of 38,957 in December 1989).

Source: Thechartstore.com
The Tech Bubble: We all know how the technology bubble of the late 1990s ended, and it wasn’t pretty. PE ratios above 100 for tech stocks was the norm (see table below), as compared to an overall PE of the S&P 500 index today of about 14x.

Source: Wall Street Journal – March 14, 2000
The Next Bubble
What is/are the next investment bubble(s)? Nobody knows for sure, but readers of Investing Caffeine know that long-term bonds are one fertile area. Given the generational low in yields and rates, and the near doubling of long-term Treasury prices over the last twelve years, it can be difficult to justify heavy allocations of inflation losing bonds for long time-horizon investors. Gold, another asset class that has increased massively in price (over 6-fold rise since about 2000) and attracted swaths of speculators, is another target area. However, as we discussed earlier, timing bubble bursts is extremely challenging. Nevertheless, the great thing about long-term investing is that probabilities and valuations ultimately do matter, and therefore a diversified portfolio skewed away from extreme valuations and speculative sectors will pay handsome dividends over the long-run.
Many traders continue to daydream as they chase performance through speculative investment bubbles, looking to squeeze the last ounce of an easily identifiable trend. As the lead investment manager at Sidoxia Capital Management, I spend less time sucking the last puff out of a cigarette, and spend more time opportunistically devoting resources to less popular growth trends. As demonstrated with historical examples, following the trend du jour eventually leads to financial ruin and nightmares. Avoiding bubbles and pursuing fairly priced growth prospects is the way to achieve investment prosperity…and provide sweet dreams.
Wade W. Slome, CFA, CFP®
Plan. Invest. Prosper.
DISCLOSURE: Sidoxia Capital Management (SCM) and some of its clients hold positions in certain exchange traded funds (ETFs) and are short TLT, but at the time of publishing SCM had no direct positions in AVP, MCD, XRX, IBM, DIS, or any other security referenced in this article. No information accessed through the Investing Caffeine (IC) website constitutes investment, financial, legal, tax or other advice nor is to be relied on in making an investment or other decision. Please read disclosure language on IC Contact page.
Box Wine, Facebook and PEG Ratios

I’m no wine connoisseur, but I do know I would pay more for a bottle of Dom Pérignon champagne than I would pay for a container of Franzia box wine. In the world of stocks, the quality disparity is massive too. In order to navigate the virtually infinite number of stocks, we need to have an instrument in our toolbox that can assist us in accurately comparing stocks across the quality spectrum. Thank goodness we have the handy PEG ratio (Price/Earnings to Growth) that elegantly marries the price paid for a stock (as measured by the P/E ratio) with the relative quality of the stock (as measured by its future earnings growth rate).

Famed investor Peter Lynch (see Inside the Brain of an Investing Genius) understood the PEG concept all too well as he used this tool religiously in valuing and analyzing different companies. Given that Lynch earned a +29% annual return from 1977-1990, I’ll take his word for it that the PEG ratio is a useful tool. As highlighted by Lynch (and others), the key factor in using the PEG ratio is to identify companies that trade with a PEG ratio of less than 1. All else equal, the lower the ratio, the better potential for future price appreciation. Facebook Vs. Eastman Kodak
To illustrate the concept of how a PEG ratio can be used to compare stocks with two completely different profiles, let’s start by answering a few questions. Would a rational investor pay the same price (i.e., Price-Earnings [P/E] ratio) for a company with skyrocketing profits as they would for a company going into bankruptcy? Look no further than the lofty expected P/E multiple to be afforded to the shares of the widely anticipated Facebook (FB) initial public offering (IPO). That same rational investor is unlikely to pay the same P/E multiple for a money losing company like Eastman Kodak Co. (EKDKQ.PK) that faces product obsolescence. The contrasting values for these two companies are stark. Some pundits are projecting that Facebook shares could fetch upwards of a 100x P/E ratio, while not too long ago, Kodak was trading at a P/E ratio of 4x. Plenty of low priced stocks have outperformed expensive ones, but remember, just because a “value” stock may have a lower absolute P/E ratio in the recent past, does not mean it will be a better investment than a “growth” stock sporting a higher P/E ratio (see Fallacy of High P/Es).
Price, Earnings, and Dividends
As I’ve written in the past, a key determinant of future stock prices is future earnings growth (see It’s the Earnings Stupid). The higher the P/E multiple, the more important future earnings growth becomes. The lower the future growth, the more important valuation and dividends become.
We can look at various money-making scenarios that incorporate these factors. If my goal were to double my money in 5 years (i.e., earn a 100% return), there are numerous ways to skin the profit-making cat. Here are four examples:
1) Buy a non-dividend paying stock of a company that achieves earnings growth of 15%/year and maintains its current P/E ratio over time.
2) Buy a stock of a company that has a 5% dividend and achieves earnings growth of 11%/year and maintains its current P/E ratio over time.
3) Buy a value stock with a 5% dividend that achieves earnings growth of 5%/year and increase its P/E ratio by 10% each year.
4) Buy a non-dividend paying growth stock that achieves earnings growth of 20%/year and decreases its P/E ratio by about 5% each year.
I think you get the idea, but as you can see, in addition to earnings growth, dividends and valuation do play a significant role in how an investor can earn excess returns.
Lynch’s Adjusted PEG
Peter Lynch added a slight twist to the traditional PEG analysis by accounting for the role of dividends in the denominator of the PEG equation:
PEG (adjusted by Lynch) = PE Ratio/(Earnings Growth Rate + Dividend Yield)
This “adjusted PEG” ratio makes intuitive sense under various perspectives. For starters, if two different companies both had a PEG ratio of 0.8, but one of the two stocks paid a 3% dividend, Lynch’s adjusted PEG would register in at a more attractive level of 0.6 for the dividend paying stock.
Looked at under a different lens, let’s suppose there are two lemonade stands that IPO their stocks at the same time, and both companies use the exact same business model. Moreover, let us assume the following:
• Lemonade stand #1 has a P/E of 14x and growth rate of 15%.
• Lemonade stand #2 has a P/E of 12x and growth rate of 8%, but it also pays a dividend of 3%.
Given this information, which one of the two lemonade stands would you invest in? Many investors see the lower P/E of Lemonade stand #2, coupled with a nice dividend, as the more attractive opportunity of the two. But as we can see from Lynch’s “adjusted PEG” ratio, Lemonade stand #1 actually has the lower, more attractive value (.9 or 14/15 vs 1.1 or 12/(8+3)).
This analysis may be delving into the weeds a bit, but this framework is critical nonetheless. Valuation and earnings projections should be essential components of any investment decision, and with record low interest rates, dividend yields are playing a much more important role in the investment selection process. Regardless of your purchase decision thought process, whether deciding between Dom Perignon and box wine, or Facebook and Kodak shares, having the PEG ratio at your disposal should help you make wise and lucrative decisions.
Wade W. Slome, CFA, CFP®
Plan. Invest. Prosper.
DISCLOSURE: Sidoxia Capital Management (SCM) and some of its clients own certain exchange traded funds, but at the time of publishing SCM had no direct position in FB, EKDKQ.PK, or any other security referenced in this article. No information accessed through the Investing Caffeine (IC) website constitutes investment, financial, legal, tax or other advice nor is to be relied on in making an investment or other decision. Please read disclosure language on IC “Contact” page.
Stretching Rubber Band Creating More Value

Concerns over debt ceiling negotiations, European financial challenges, and overall economic malaise has reached a feverish pitch in the U.S., yet in the background, a valuation rubber band has quietly been stretching to ever more attractive levels. Regardless of whether seniors might not receive Social Security checks, troops not obtain ammunition, and investors not collect credit rating agency love, corporations keep churning profits out like they are going out of style (17%+ growth in 2011 estimated earnings). We have barely scratched the surface on earnings season, and I’m sure better than expected earnings from the likes of Google Inc. (GOOG), JPMorgan Chase & Co. (JPM), FedEx Corp. (FDX), Nike Inc. (NKE), and Bed Bath & Beyond Inc. (BBBY) will not sway the bears, but in the meantime profits keep chugging along. Although profits have more than doubled in the last 12 years, not to mention a halving in interest rates (10-year Treasury yield cut from 6% to about 3%), yet the S&P 500 is still down approximately -4% (June 1999 – June 2011).
What Gives?
Could the valuation stretching continue as earnings continue to grind higher? Absolutely. Just because prices have been chopped in half, doesn’t mean they can’t go lower. From 1966 – 1982 the Dow Jones Industrial index traded at around 800 and P/E multiples contracted to single digits. That rubber band eventually snapped and the index catapulted 17-fold from 800 to almost 14,000 in 25 years. Even though equities have struggled in the 21st century, a few things have changed from the low-point reached about 30 years ago. For starters, we have not hit an inflation rate of 15% or a Federal Funds rate of 20% (4% and 0% today, respectively), so we have a tad bit more headroom before the single digit P/E apocalypse descends upon us. If you listen to Peter Lynch, investor extraordinaire, his “Rule of 20” states a market equilibrium P/E ratio should equal 20 minus the inflation rate. This rule would imply an equilibrium P/E ratio of 16-17 when the current 2011 P/E multiple implies a value slightly above 13 times earnings. The bears may claim victory if the earnings denominator collapses, but if earnings, on the contrary, continue coming in better than expected, then the sun might break through the clouds in the form of significant price appreciation.
Another change that has occurred since the days of Cabbage Patch dolls has been the opening floodgates of globalization. The technology revolution has accelerated the flattening of the globe, which has created numerous new opportunities and threats. Creating a company like Facebook with about 750 million users and an estimated value of $80 billion to $100 billion couldn’t happen 30 years ago, but on the flip side, our country is also competing with billions of motivated brains lurking in the far reaches of the world with a singular focus of sucking away our jobs, resources, and dollars. Winners recognize this threat and are currently adapting. Losers blind to this trend remain busy digging their own graves.
Future is Uncertain
As famous Jedi Master Yoda aptly identified, “Always in motion is the future.” The future is always uncertain, and if it wasn’t, I would be on my private island drinking umbrella drinks all day. With undecided debt ceiling negotiations occurring over the next few weeks, political rhetoric will be blaring and traders will be hyperventilating with defibrillator paddles close at hand. If history is a guide, stupid decisions may be made, but the almighty financial markets (and maybe a few Molotov cocktails at a local protest rally) will eventually slap politicians in the face to wake up to reality. Perhaps you recall the attention the markets earned from legislators when the Dow fell 777 points in a single September 2008 trading session. Blood on the streets forced Congress to approve the Troubled Asset Relief Program hot potato four days after the initial vote failed. And if that wasn’t a gentle enough reminder for Democrats and Republicans, then a few lessons can be learned from the interest rate sledgehammer that capital markets vigilantes have slammed on the Greeks (10-year Greek yields are hovering above 17%+).
Down but Not Out
The stories of debt collapse, hyperinflation, double-dip recessions, plunging dollar, secular bear markets, and government shutdowns are all plausible but remote scenarios. As Winston Churchill so eloquently stated, “You can always count on Americans to do the right thing – after they’ve tried everything else.” Voter moods are so venomous that if fiscal irresponsibility is not changed, politicians will be voted straight out of office – even hardcore, extremist elected officials understand this self-serving point.
Suffice it to say, as the political noise reaches a deafening pitch in the coming weeks and months, a quiet rubber band in the background keeps stretching. When the political noise dies down, you may just hear a noise snapping stock prices higher.
Wade W. Slome, CFA, CFP®
Plan. Invest. Prosper.
DISCLOSURE: Performance data from Morningstar.com. Sidoxia Capital Management (SCM) and some of its clients own certain exchange traded funds, GOOG, and FDX, but at the time of publishing SCM had no direct position in JPM, NKE, BBBY, Facebook, or any other security referenced in this article. No information accessed through the Investing Caffeine (IC) website constitutes investment, financial, legal, tax or other advice nor is to be relied on in making an investment or other decision. Please read disclosure language on IC “Contact” page.
The Fallacy of High P/E’s

Would you pay a P/E ratio (Price-Earnings) of 1x’s future earnings for a dominant market share leading franchise that is revolutionizing the digital industry and growing earnings at an +83% compounded annual growth rate? Or how about shelling out 3x’s future profits for a company with ambitions of taking over the global internet advertising and commerce industries while expanding earnings at an explosive +51% clip? If you were capable of identifying Apple Inc. (AAPL) and Google Inc. (GOOG) as investment ideas in 2004, you would have made approximately +2,000% and +600%, respectively, over the following six years. I know looking out years into the future can be a lot to ask for in a world of high frequency traders and stock renters, but rather than focusing on daily jobless claims and natural gas inventory numbers, there are actual ways to accumulate massive gains on stocks without fixating on traditional trailing P/E ratios.
At the time in 2004, Apple and Google were trading at what seemed like very expensive mid-30s P/E ratios (currently the S&P 500 index is trading around 15x’s trailing profits) before these stocks made their explosive, multi-hundred-percent upward price moves. What seemingly appeared like expensive rip-offs back then – Apple traded at a 37x P/E ($15/$0.41) and Google 34x P/E ($85/$2.51) – were actually bargains of a lifetime. The fact that Apple’s share price appreciated from $15 to $347 and Google’s $85 to $538, hammers home the point that analyzing trailing P/E ratios alone can be hazardous to your stock-picking health.
Why P/Es Don’t Matter
In William O’Neil’s book, How to Make Money in Stocks he comes to the conclusion that analyzing P/E ratios is worthless:
“Our ongoing analysis of the most successful stocks from 1880 to the present show that, contrary to most investors beliefs, P/E ratios were not a relevant factor in price movement and have very little to do with whether a stock should be bought or sold. Much more crucial, we found, was the percentage increase in earnings per share.”
Here is what O’Neil’s data shows:
- From 1953 – 1985 the best performing stocks traded at a P/E ratio of 20x at the early stages of price appreciation versus an average P/E ratio of 15x for the Dow Jones Industrial Average over the same period. The largest winners saw their P/E multiples expand by 125% to 45x.
- From 1990 – 1995, the leading stocks saw their P/E ratios more than double from an average of 36 to the 80s. Once again, O’Neil explains why you need to pay a premium to play with the market leading stocks.
You Get What You Pay For
When something is dirt cheap, many times that’s because what you are buying is dirt. Or as William O’Neil says,
“You can’t buy a Mercedes for the price of a Chevrolet, and you can’t buy oceanfront property for the same price you’d pay for land a couple of miles inland. Everything sells for about what it’s worth at the time based on the law of supply and demand…The very best stocks, like the very best art, usually command a higher price.”
Any serious investor has “value trap” scars and horror stories to share about apparently cheap stocks that seemed like bargains, only to later plummet lower in price. O’Neil uses the example of when he purchased Northrop Grumman Corp (NOC) many years ago when it traded at 4x’s earnings, and subsequently watched it fall to a P/E ratio of 2x’s earnings.
Is Your Stock a Teen or a Senior?
A mistake people often make is valuing a teen-ager company like it’s an adult company (see also the Equity Life Cycle article). If you were offered the proposition to pay somebody else an upfront lump-sum payment in exchange for a stream of their lifetime earnings, how would you analyze this proposal? Would you make a higher lump-sum payment for a 21-year-old, Phi Beta Kappa graduate from Harvard University with a 4.0 GPA, or would you pay more for an 85 year old retiree generating a few thousand dollars in monthly Social Security income? As you can imagine, the vast majority of investors would pay more for the youngster’s income because the stream of income over 65-70 years would statistically be expected to be much larger than the stream from the octogenarian. This same net present value profit stream principle applies to stocks – you will pay a higher price or P/E for the investment opportunity that has the best growth prospects.
Price Follows Earnings
At the end of the day, stock prices follow the long-term growth of earnings and cash flows, whether a stock is considered a growth stock, a value stock, or a core stock. Too often investors are myopically focused on the price action of a stock rather than the earnings profile of a company. Or as investment guru Peter Lynch states:
”People may bet on hourly wiggles of the market but it’s the earnings that waggle the wiggle long term.”
“People Concentrate too much on the P (Price), but the E (Earnings) really makes the difference.”
Correctly determining how a company can grow earnings is a more crucial factor than a trailing P/E ratio when evaluating the attractiveness of a stock’s share price.
Valuations Matter
Even if you buy into the premise that trailing P/E ratios do not matter, valuation based on future earnings and cash flows is critical. When calculating the value of a company via a discounted cash flow or net present value analysis, one does not use historical numbers, but rather future earnings and cash flow figures. So when analyzing companies with apparently sky-high valuations based on trailing twelve month P/E ratios, do yourself a favor and take a deep breath before hyperventilating, because if you want to invest in unique growth stocks it will require implementing a unique approach to evaluating P/E ratios.
See also Evaluating Stocks Vegas Style
Wade W. Slome, CFA, CFP®
Plan. Invest. Prosper.
DISCLOSURE: Sidoxia Capital Management (SCM) and some of its clients own certain exchange traded funds, AAPL, and GOOG, but at the time of publishing SCM had no direct position in NOC, or any other security referenced in this article. No information accessed through the Investing Caffeine (IC) website constitutes investment, financial, legal, tax or other advice nor is to be relied on in making an investment or other decision. Please read disclosure language on IC “Contact” page.


