Posts tagged ‘corporate profits’
Will the Halloween Trick Turn into a Holiday Treat?

The interest rate boogeyman came out in October as fears of an overzealous Federal Reserve monetary policy paralyzed investors into thinking rising interest rates could murder the economy into recession. But other ghostly issues frightened the stock market last month as well, including mid-term elections, heightening trade war tensions, a weakening Chinese economy, a fragile European economy (especially Italy), rising oil prices, weakening emerging market economies, anti-Semitism, politically motivated bomb threats, and anxiety over a potential recession after an aged economic expansion embarks on its 10th consecutive year of gains.
This ghoulish short-term backdrop resulted in the Dow Jones Industrial Average suffering a -5.1% drop last month, and the technology-heavy NASDAQ index screamed even lower by -9.2%. The results for the full year 2018 look more constructive – the S&P 500 is up +1.4% and the NASDAQ has climbed +5.8%.
Should the dreadful October result be surprising? Historically speaking, seasonality in the stock market has been quite scary during the month of October, especially if you consider the spooky stock Market Crash of 1929 (-19.7%) , the 1987 Crash (-21.5%), and the bloody collapse during the October 2008 Financial Crisis (-16.8%). There is good news, however. Seasonally, the holiday months of November and December typically tend to treat investors more cheerfully during the so-called “Santa Claus Rally” period. Since 1950 through 2017, the average return for stocks during November has been +1.4% (45 up years and 23 down years). For December, the results are even better at +1.5% (51 up years and 17 down years).
| November (1950-2017) | December (1950-2017) | |||
| Up Years | Down Years | Up Years | Down Years | |
| 2017 2.40% | 2015 -0.02% | 2017 1.08% | 2015 -1.87% | |
| 2016 3.29% | 2011 -0.32% | 2016 1.76% | 2014 -0.33% | |
| 2014 2.45% | 2010 -0.44% | 2013 2.31% | 2007 -0.76% | |
| 2013 2.68% | 2008 -7.48% | 2012 0.70% | 2005 -0.10% | |
| 2012 0.28% | 2007 -4.18% | 2011 0.86% | 2002 -6.03% | |
| 2009 5.74% | 2000 -8.01% | 2010 5.99% | 1996 -2.15% | |
| 2006 1.66% | 1994 -3.93% | 2009 1.48% | 1986 -2.83% | |
| 2005 3.52% | 1993 -1.29% | 2008 1.65% | 1983 -0.87% | |
| 2004 3.86% | 1991 -4.39% | 2006 1.26% | 1981 -3.01% | |
| 2003 0.71% | 1988 -1.89% | 2004 3.25% | 1980 -3.39% | |
| 2002 5.71% | 1987 -8.51% | 2003 5.08% | 1975 -1.15% | |
| 2001 7.52% | 1984 -1.51% | 2001 0.76% | 1974 -1.78% | |
| 1999 1.92% | 1976 -0.78% | 2000 0.41% | 1969 -1.87% | |
| 1998 5.91% | 1974 -5.32% | 1999 5.78% | 1968 -4.16% | |
| 1997 4.46% | 1973 -11.39% | 1998 5.64% | 1966 -0.15% | |
| 1996 7.34% | 1971 -0.25% | 1997 1.57% | 1961 -0.32% | |
| 1995 4.10% | 1969 -3.41% | 1995 1.74% | 1957 -3.31% | |
| 1992 3.03% | 1965 -0.88% | 1994 1.26% | ||
| 1990 6.00% | 1964 -0.52% | 1993 0.98% | ||
| 1989 1.65% | 1963 -1.05% | 1992 1.01% | ||
| 1986 2.15% | 1956 -3.10% | 1991 11.19% | ||
| 1985 6.51% | 1951 -0.95% | 1990 2.48% | ||
| 1983 1.74% | 1950 -0.26% | 1989 2.14% | ||
| 1982 3.60% | 1988 1.48% | |||
| 1981 3.27% | 1987 7.28% | |||
| 1980 10.24% | 1985 4.51% | |||
| 1979 4.26% | 1984 2.24% | |||
| 1978 0.61% | 1982 1.50% | |||
| 1977 2.86% | 1979 1.68% | |||
| 1975 2.47% | 1978 1.16% | |||
| 1972 4.56% | 1977 0.28% | |||
| 1970 4.74% | 1976 5.25% | |||
| 1968 4.80% | 1973 1.79% | |||
| 1967 0.75% | 1972 1.18% | |||
| 1966 0.31% | 1971 8.62% | |||
| 1962 10.16% | 1970 5.68% | |||
| 1961 3.77% | 1967 2.63% | |||
| 1960 2.97% | 1965 0.90% | |||
| 1959 1.52% | 1964 0.39% | |||
| 1958 1.78% | 1963 2.44% | |||
| 1957 3.17% | 1962 1.35% | |||
| 1955 7.64% | 1960 5.08% | |||
| 1954 7.71% | 1959 2.03% | |||
| 1953 0.41% | 1958 4.78% | |||
| 1952 4.31% | 1956 1.50% | |||
| 1955 0.29% | ||||
| 1954 5.85% | ||||
| 1953 0.12% | ||||
| 1952 3.47% | ||||
| 1951 3.62% | ||||
| 1950 3.81% | ||||
While the last 31 days may have been distressing, at Sidoxia we understand that terrifying short-term volatility is a necessary requirement for long-term investors, if you desire the sweet appreciation of long-term gains. Fortunately at Sidoxia our long-term investors have benefited quite handsomely over the last 10 years from our half-glass-full perspective. The name Sidoxia actually is derived from the Greek word for “optimism” (aisiodoxia).
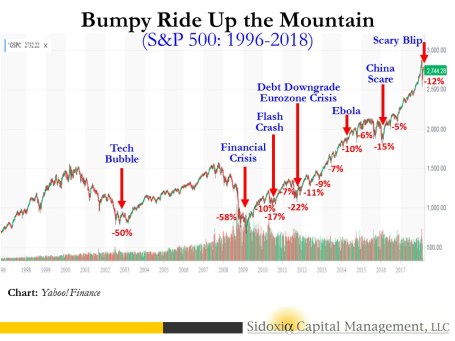
Performance has been fruitful in recent years, but the almost decade-long bull market has not been all smooth sailing (see Series of Unfortunate Events), as you can see from the undulating 10-year chart below (2008-2018). Do you remember the Flash Crash, Debt Ceiling, Greek Crisis, Arab Spring, Crimea, Ebola, Sequestration, and Taper Tantrum, among many other events? Similar to the volatility experienced in recent weeks, all these aforementioned events caused scary downdrafts as well.

The S&P 500 hit a low of 666 in March 2009, but even with the significant fall last month, the stock market has more than quadrupled in value to 2,711 today.
The compounding benefits of long-term investing are quite evident over the last decade when you consider the record profits of the stock market. Compounding benefits apply to individual stocks as well, and Sidoxia and its clients have experienced this first hand through ownership in positions in stocks like Amazon.com Inc. (+2,692% in 10 years), Apple Inc. (+1,324%), and Google (parent Alphabet) (+507%), and many other less-familiar growth companies have allowed our client portfolios and hedge fund to outperform their benchmarks over longer periods of time. Although we are proud of our long-term performance, we have definitely had periods of under performance, and there will come a time in which a more defensive stance will be required. However, panicking is very rarely the best course of action when you are talking about your long-term investment strategy. Staying the course is paramount.
During periods of heightened volatility, like we experienced in October, the importance of owning a broadly diversified portfolio across asset classes (including stocks, bonds, real estate, commodities, emerging markets, growth, value, etc.) is worth noting. Of course an asset allocation should be followed according to a risk tolerance appropriate for your unique circumstances. As financial markets and interest rates gyrate, investors should get in the practice of rebalancing portfolios. For example, at Sidoxia, we are consistently harvesting our gains and opportunistically redeploying those proceeds into unloved areas in which we see better long-term appreciation opportunities. This whole investment process is designed for reducing risk and maximizing returns.
As in some famously scary stock market periods in the past, October turned out to be another frightening month for investors. The good news is that we have seen this scary movie many times in the past, and we have lived to tell the tale. The economy remains strong, corporate profits are at record levels and still rising, consumer and business confidence levels are near all-time highs, and interest rates remain historically low despite the Fed’s gradual interest rate hiking policy. While Halloween has definitely worried many investors, history tells us that previous tricks may turn into holiday treats!

Wade W. Slome, CFA, CFP®
Plan. Invest. Prosper.
This article is an excerpt from a previously released Sidoxia Capital Management complimentary newsletter (November 1, 2018). Subscribe on the right side of the page for the complete text.
DISCLOSURE: Sidoxia Capital Management (SCM) and some of its clients hold positions in AAPL, AMZN, GOOGL, and certain exchange traded funds (ETFs), but at the time of publishing had no direct position in any other security referenced in this article. No information accessed through the Investing Caffeine (IC) website constitutes investment, financial, legal, tax or other advice nor is to be relied on in making an investment or other decision. Please read disclosure language on IC Contact page.
The Dirty Little Stock Market Secret

Shhhh…don’t tell anyone, I have a dirty little secret. Are you ready? Are you sure? The world is not going to end…really.
Despite lingering trade concerns (see Trump Hits China with Tariffs on $200 Billion in Goods), Elon Musk being sued by the Securities and Exchange Commission (SEC) for tweeting his controversial intentions to take Tesla Inc. (TSLA) private, and Supreme Court nominee, Brett Kavanaugh, facing scandalous sexual assault allegations when he was in high school, life goes on. In the face of these heated headlines, stocks still managed to rise to another record in September (see Another Month, Another Record). For the month, the Dow Jones Industrial Average climbed +1.9% (+7.0% for 2018), the S&P 500 notched a +0.4% gain (+9.0% for 2018), while the hot, tech-laden NASDAQ index cooled modestly by -0.8% after a scorching +17.5% gain for the year.
If the world were indeed in the process of ending and we were looking down into the abyss of another severe recession, we most likely would not see the following tangible and objective facts occurring in our economy.
- New Revamped NAFTA (North American Free Trade Agreement) 2.0 trade deal between the U.S., Mexico, and Canada was finalized (new deal is called United States-Mexico-Canada Agreement).
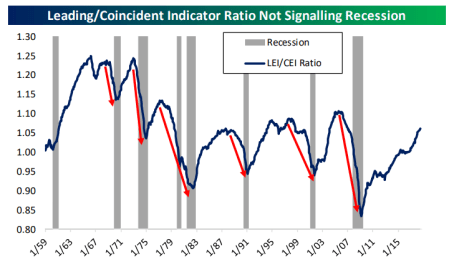
- Leading Economic Indicators are at a record high (a predictive statistic that historically falls before recessionary periods – in gray)
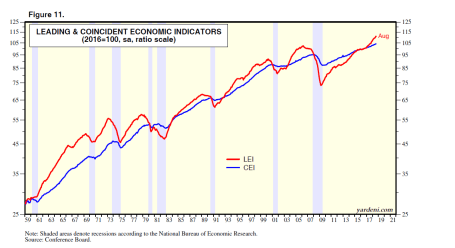
Source: Yardeni.com
- Unemployment Rate of 3.9% is near a record low
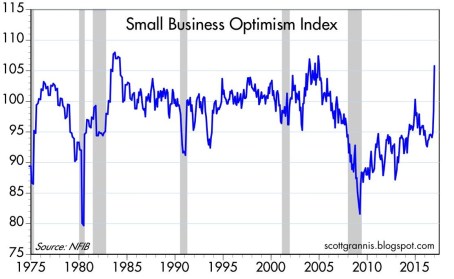
- Small Business Optimism is near record highs
- Consumer Confidence is near record highs
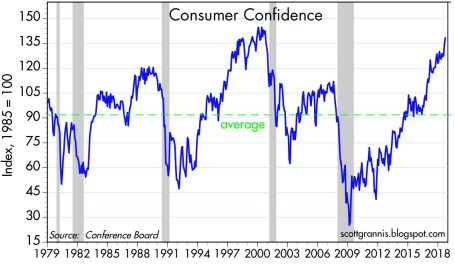
Source: Scott Grannis
- Corporate Profits are at record highs
- Interest Rates remain at historically low levels despite the Federal Reserve’s actions to slowly migrate their interest rate target higher
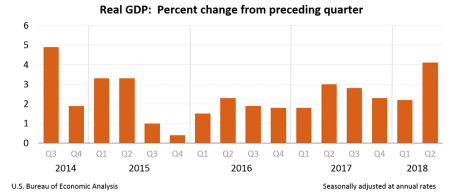
- Economic Growth (GDP) accelerating to +4.2% growth rate in the recent quarter
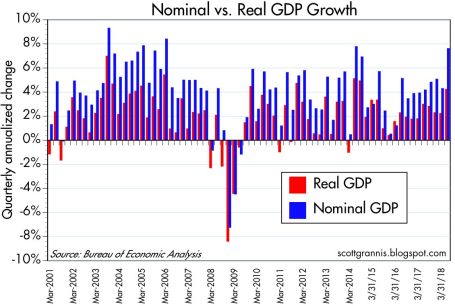
Source: Scott Grannis
Are we closer to a recession with the stock market potentially falling 20-30% in value? As I have written on numerous occasions, so-called pundits have been falsely forecasting recessions over the last decade, for as long as this bull market has been alive (see Professional Double-Dip Guesses are “Probably” Wrong).
Why so much investor angst as stock prices continue to chug along to record levels? One reason is investors are used to historically experiencing a recession approximately twice a decade on average, and we have yet to suffer one since the Great Recession around 10 years ago. While the mantra “we are due” for a recession might be a true statement, the fact also remains that this economic recovery has been the slowest since World War II, which logically could argue for a longer expansionary period.
What also holds true is that corporate profits already experienced a significant “profit recession” during this economic cycle, post the 2008-2009 financial crisis. More specifically, S&P 500 operating profits declined for seven consecutive quarters from December 2014 through June 2016. The largest contributors to the 2014-2016 profit recession were collapsing oil and commodity prices, coupled with a rapid appreciation in the value of the U.S. dollar, which made our exports more expensive and squeezed multinational corporation profits. The stock market eventually digested these profit-crimping headwinds and resumed its ascent to record levels, but not before the S&P 500 remained flat to down for about a year and a half (2014-2016).
Doom-and-gloom, in conjunction with toxic politics, continue to reign supreme over the airwaves. If you want in on a beneficial dirty little secret, you and your investments would be best served by ignoring all of the media noise and realizing the world is not going to end any time soon.
Wade W. Slome, CFA, CFP®
Plan. Invest. Prosper.
This article is an excerpt from a previously released Sidoxia Capital Management complimentary newsletter (October 1, 2018). Subscribe on the right side of the page for the complete text.
DISCLOSURE: Sidoxia Capital Management (SCM) and some of its clients hold positions in certain exchange traded funds (ETFs), but at the time of publishing had no direct position in TSLA or any other security referenced in this article. No information accessed through the Investing Caffeine (IC) website constitutes investment, financial, legal, tax or other advice nor is to be relied on in making an investment or other decision. Please read disclosure language on IC Contact page.
Another Month, Another Record

The S&P 500 eclipsed the 2,900 level and the NASDAQ jumped over 8,000 this month – both all-new record highs. The Dow Jones Industrial average also temporarily catapulted above 26,000 in August, but remains 2% shy of the January 2018 record highs. For the year, here are what the gains look like thus far:
- S&P 500: +5.3% (2,902)
- NASDAQ: +17.5% (8,110)
- Dow Jones Industrial: +5.0% (25,965)
For months, and even years, I have written how investors have underestimated the strength of this bull market, which has been driven by an incredible earnings growth, low interest rates, reasonable valuations, and a skeptical mass market of investors. As I pointed out in the article, Why the Masses Missed the 10-Year Bull Market, stock ownership has gone down during this massive quadrupling in the bull market. And many investors have missed the fruits of the bull market due to an over-focus on uncertain politics and scary headlines.
Nothing lasts forever, however, so another correction will likely be in the cards, just as we experienced this February when the S&P 500 index temporarily fell -18% from the January peak. But as I have highlighted previously, attempting to forecast or predict a correction is a Fool’s Errand. At Sidoxia we implement a disciplined, systematic process to identify attractive investments through our proprietary S.H.G.R. model (see also Holy Grail) and the four legs of our macroeconomic framework (earnings, interest rates, valuation, and investor sentiment – see Follow the Stool). With stock prices bouncing around near record highs, it is surprising to some that anxiety still remains elevated, primarily due to polarizing politics and an unfounded fear of an imminent recession.
Despite all the hand wringing going on over political headlines, the fact remains the economic tailwinds have “trumped” any political concerns. After a strong Q2 GDP reading of +4.2%, according to numerous economists, Q3 is tracking for another healthy +3% gain. As the Leading & Coincident Indicator chart shows below, there currently is no sign of an imminent recession.
And jobs remain plentiful in part because of Small Business Optimism (see chart below). It’s common knowledge that small businesses generate the vast majority of new jobs, so these optimism levels hovering near 35-year highs augur well for future hiring, job growth, and investment.
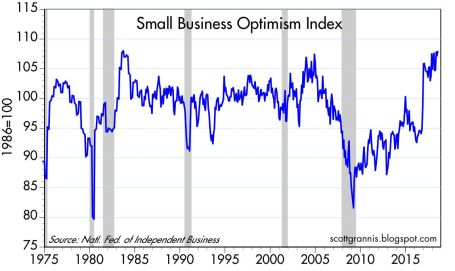
The real economy, as measured by the shipment of goods, is trucking along as well (see the truck tonnage chart below).
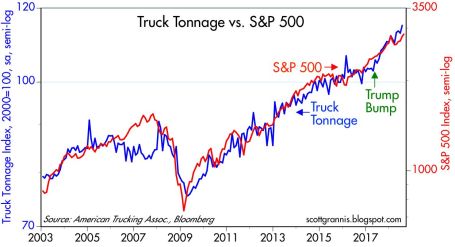
Source: Scott Grannis
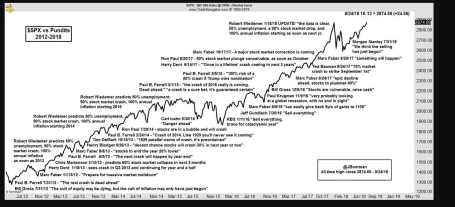
While all the positives above have been highlighted already, in the forefront has been an endless string of doomsday forecasts. Scott Grannis captured this sentiment in a six-year chart created by TradeNavigator.com (click here).
As we enter the tenth year of this bull stock market, politics remain polarizing and skepticism reigns supreme. However, until the storm clouds come rolling in, the economy keeps expanding and prices keep moving higher. If the trend continues, as has been the case in recent years, next month’s title could be the same, “Another Month, Another Record.”
Wade W. Slome, CFA, CFP®
Plan. Invest. Prosper.
This article is an excerpt from a previously released Sidoxia Capital Management complimentary newsletter (September 4, 2018). Subscribe on the right side of the page for the complete text.
DISCLOSURE: Sidoxia Capital Management (SCM) and some of its clients hold positions in certain exchange traded funds (ETFs), but at the time of publishing had no direct position in any other security referenced in this article. No information accessed through the Investing Caffeine (IC) website constitutes investment, financial, legal, tax or other advice nor is to be relied on in making an investment or other decision. Please read disclosure language on IC Contact page.
Arm Wrestling the Economy & Tariffs

Financial markets have been battling back and forth like a championship arm-wrestling match as economic and political forces continue to collide. Despite these clashing dynamics, capitalism won the arm wrestling match this month as investors saw the winning results of the Dow Jones Industrial Average adding +4.7% and the S&P 500 index advancing +3.6%.
Fueling the strength this month was U.S. economic activity, which registered robust 2nd quarter growth of +4.1% – the highest rate of growth achieved in four years (see below).
The job market is on fire too with U.S. jobless claims hitting their lowest level in 48 years (see chart below). This chart shows the lowest number of people in a generation are waiting in line to collect unemployment checks.
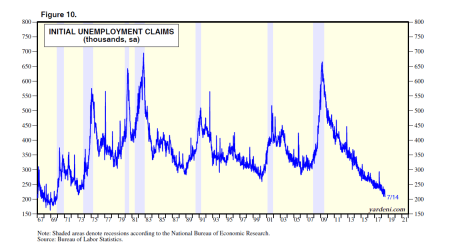
Source: Dr. Ed’s Blog
If that isn’t enough, so far, the record corporate profits being reported for Q2 are up a jaw-dropping +23.5% from a year ago. What can possibly be wrong?
Excess Supply of Concern
While the economic backdrop is largely positive, there is never a shortage of things to worry about – even during decade-long bull market of appreciation. More specifically, investors have witnessed the S&P 500 index more than quadruple from a March 2009 low of 666 to 2,816 today (+322%). Despite the massive gains achieved over the last decade, there have been plenty of volatility and geopolitics to worry about. Have you already forgotten about the Flash Crash, Arab Spring, Occupy Wall Street, Government Shutdowns, Sequestration, Taper Tantrum, Ebola, Iranian nuclear threat, plunging oil prices, skyrocketing oil prices, Brexit, China scares, Elections, and now tariffs, trade, and the Federal Reserve monetary policy?
Today, tariffs, trade, Federal Reserve monetary policy, and inflation are top-of-mind investor concerns, but history insures there will be new issues to worry about tomorrow. Ever since the bull market began a decade ago, there have been numerous perma-bears incorrectly calling for a deathly market collapse, and I have written a substantial amount about these prognosticators’ foggy crystal balls (see Emperor Schiff Has No Clothes [2009] & Clashing Views with Dr. Roubin [2009]. While these doomsdayers get a lot less attention today, similar bears like John Hussman, who like a broken record, has erroneously called for a market crash every year for the last seven years (click chart link).
Although many investment accounts are up over the last 10 years, many people quickly forget it has not been all rainbows and unicorns. While the stock market has more than quadrupled in value since 2009, we have lived through about a dozen alarming corrections, including the worrisome -12% pullback we experienced in February. If we encounter another -5 -10% correction this year, this is perfectly healthy, normal, and should not be surprising. More often than not, these temporary drops provide opportunistic openings to scoop up valued bargains.
Longtime readers and followers of Sidoxia’s investment philosophy and Investing Caffeine understand the majority of these economic predictions and political headlines are useless noise. Social media, addiction to smart phones, and the 24/7 news cycle create imaginary, scary mountains out of harmless molehills. As I have preached for years, the stock market does not care about politics and opinions – the stock market cares about 1) corporate profits (at record levels) – see chart below; 2) interest rates (rising, but still near historically low levels); 3) the price of the stock market/valuation (which is getting cheaper as profits soar from tax cuts); and 4) sentiment (a favorable contrarian indicator until euphoria kicks in).
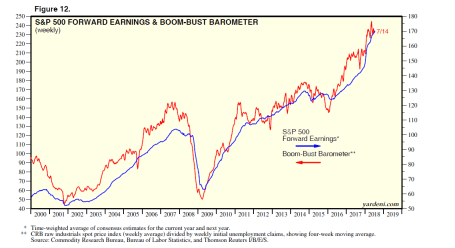
Source: Dr. Ed’s Blog
Famed investor manager, Peter Lynch, who earned +29% annually from 1977-1990 also urged investors to ignore attempts of predicting the direction of the economy. Lynch stated, “I’ve always said if you spend 13 minutes a year on economics, you’ve wasted 10 minutes.”
I pay more attention to successful long-term investors, like Warren Buffett (the greatest investor of all-time), who remains optimistic about the stock market. As I’ve noted before, although we remain constructive on the markets over the intermediate to long-term periods, nobody has been able to consistently prophesize about the short-term direction of financial markets.
At Sidoxia, rather than hopelessly try to predict every twist and turn in the market, or react to every meaningless molehill, we objectively analyze the available data without getting emotional, and then take advantage of the opportunities presented to us in the marketplace. Certain asset classes, stocks, and bonds, will constantly move in and out of favor, which allows us to continually find new opportunities. A contentious arm wrestling struggle between uncertain tariffs/rising interest rates and stimulative tax cuts/strong economy is presently transpiring. As always, we will continually monitor the evolving data, but for the time being, the economy is flexing its muscle and winning the battle.
Wade W. Slome, CFA, CFP®
Plan. Invest. Prosper.
This article is an excerpt from a previously released Sidoxia Capital Management complimentary newsletter (August 1, 2018). Subscribe on the right side of the page for the complete text.
DISCLOSURE: Sidoxia Capital Management (SCM) and some of its clients hold positions in certain exchange traded funds (ETFs), but at the time of publishing had no direct position in any other security referenced in this article. No information accessed through the Investing Caffeine (IC) website constitutes investment, financial, legal, tax or other advice nor is to be relied on in making an investment or other decision. Please read disclosure language on IC Contact page.
Why the Masses Missed the 10-Year Bull Market

The investing masses generally are notoriously short-termed focused. Although the overall stock market notched another gain this month, stock values are still down roughly -8% from the January peak, which has caused some investor angst. Despite this nervousness, stock prices have quadrupled and the bull market has entered its 10th year after the March 2009 low (S&P 500: 666). Given this remarkable accomplishment, we can now look back and ask, “Did investors take advantage of this massive advance?” The short answer is “No.” For the most part, the fearful masses missed the decade-long, U.S. bull market. We know this dynamic to be true because data regarding stock ownership has gone down significantly, and hundreds of billions of dollars have been pulled from U.S. equity funds over the duration. For instance, Gallup, the survey and analytics company, annually polls the average percentage of Americans who own stocks and they found ownership has dropped from 62% of Americans in 2008 to 54% in 2017 (see chart below).

Much of the negativity that has dominated investor behavior over the last decade can be explained by important behavioral biases. As I describe in Controlling the Investment Lizard Brain, evolution created an almond-sized tissue in the prefrontal cortex of the brain (amygdala), which controls reasoning. Originally, the amygdala triggered the instinctual survival flight response for lizards to avoid hungry hawks and humans to flee ferocious lions. In today’s modern society, the probability of getting eaten by a lion is infinitesimal, so rather than fretting over a potential lion slaughtering, humans now worry about their finances getting eaten by financial crises, Federal Reserve interest rate hikes, and/or geopolitical risks.
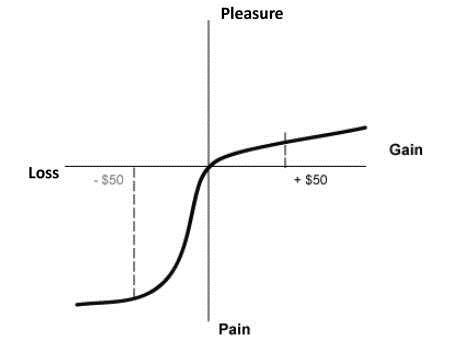
Even with the spectacular +300% appreciation in stock values from early 2009, academic research can help us understand how pessimism can outweigh optimism, even in the wake of a raging bull market. Consider the important risk aversion research conducted by Nobel Prize winner Daniel Kahneman and his partner Amos Tversky (see Pleasure/Pain Principle). Their research pointed out the pain of losses can be twice as painful as the pleasure experienced through gains (see diagram below).
Given this backdrop, how can these gargantuan gains be maintained (or improved upon) when investors are continually draining money out of riskier stocks and pouring cash into more conservative bonds? (see Fund Flows Paradox). There are several major factors that can explain the colossal gains in the face of a stock investor exodus:
- Share Buybacks: While investors might not be buying loads of stocks, corporations have purchased trillions of dollars in stocks since the financial crisis. As you can see from the chart below, the table is set for 2018 to be a record year in share buybacks ($842 billion estimate), thanks to record profits and tax legislation that is making it cheaper for corporations to bring back foreign profits abroad.
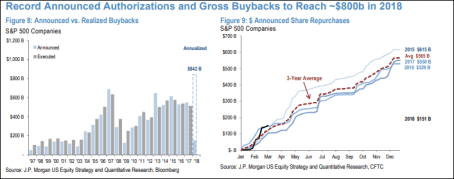
Source: Marketwatch
- Mergers & Acquisitions (M&A): Record profits, low interest rates, and high cash levels have led to trillions of dollars in U.S. M&A activity (almost $2 trillion in 2017) – see chart below. Not all of this was funded with cash and debt, but suffice it to say, enormous amounts of equity have been removed from the stock market.
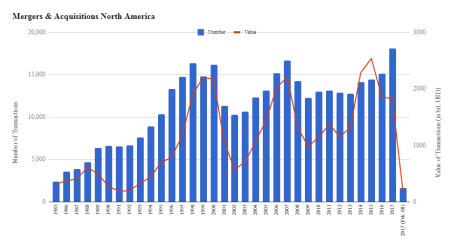
Source: IMAA Institute
- Limited IPOs: Certainly, we have seen a few high-profile, stock deals hit the market in the form of initial public offerings (IPOs) over the last year. Some prominent IPOs over the last year, include Dropbox Inc. (DBX), Spotify Technology (SPOT), and Snap Inc. (SNAP), however this limited supply of new deals is a drop in the bucket. As you can see from the chart below, the number of IPOs is significantly below the 1999-2000 peak and the recent added supply pales in comparison to the latest supply-sucking share buybacks and acquisitions.

Source: Statista
Just as important as these supply related issues are to the stock market, demand related issues are important as well. While individual U.S. investors have been scarred by the 2008-2009 financial crisis, ultimately, over the long run, money does not care about behavioral biases. Money goes where it is treated best. Theoretically, the best treatment could be in U.S. stocks or U.S. bonds, or it could be in pork bellies or the Thai baht currency, among many other asset classes (e.g., real estate, commodities, venture capital, Bitcoin, etc.). Much like a trip to the grocery store, global money flows search for the best deals. If beef prices spike by +30% and chicken prices drop by -20%, guess what? Shoppers will now buy more chicken and less beef. Similarly, when Japanese 10-year bonds are yielding 0.04%, German 10-year bonds 0.56%, and U.K. 10-year bonds 1.42%, then U.S. 10-year Treasuries with a 2.96% yield don’t look so bad.
More importantly, as it relates to stock prices, there has been a mass divergence between the interest rate yields earned on Treasuries and the earnings yield (E/P or the inverse P/E ratio) since this 10-year bull market began (Ed Yardeni has a great chart of this Fed Valuation chart). Stocks, as they are valued today, are effectively providing double the yield of bonds (roughly a 6% yield vs 3% yield, respectively). As long as this phenomenon remains intact over the medium term, stocks could continue to significantly outperform bonds. Eventually a spike in stock prices and/or an earnings decline caused by a recession will lower the earnings yield on stocks, but until then, nervous investors will likely continue to underperform.
What the almost 10-year bull market teaches us is that our behavioral shortcomings can be a drag on performance and stock values, but the economic laws of supply and demand can play an even more significant role in the direction of the stock market. Learning how to control your lizard brain (amygdala), and understand how the pain of losses (risk aversion) can distort decision making processes can help you more clearly see how record profits (see chart below), share buybacks, M&A activity, and limited stock issuance (i.e. IPOs) will impact stock prices. Understanding these lessons will better prepare the masses in navigating through future bull and bear markets.
Source: FACTSET
Wade W. Slome, CFA, CFP®
Plan. Invest. Prosper.
This article is an excerpt from a previously released Sidoxia Capital Management complimentary newsletter (May 1, 2018). Subscribe on the right side of the page for the complete text.
DISCLOSURE: Sidoxia Capital Management (SCM) and some of its clients hold positions in certain exchange traded funds (ETFs), but at the time of publishing had no direct position in DBX, SPOT, SNAP, or any other security referenced in this article. No information accessed through the Investing Caffeine (IC) website constitutes investment, financial, legal, tax or other advice nor is to be relied on in making an investment or other decision. Please read disclosure language on IC Contact page.
The Scary Blip

I hated it when my mom reminded me when I was a younger, but now that I’ve survived into middle-aged adulthood, I will give you the same medicine she gave me:
“I told you so.”
As I cautioned in last month’s newsletter, “It’s important for investors to remember this pace of gains cannot be sustainable forever.” I added that there were a whole bunch of scenarios for stock prices to go down or “stock prices could simply go down due to profit-taking.”
And that is exactly what we saw. From the peak achieved in late January, stock prices quickly dropped by -12% at the low in early February, with little-to-no explanation other than a vague blame-game on rising interest rates – the 2018 yield on the 10-Year Treasury Note rose from 2.4% to 2.9%. This explanation holds little water if you take into account interest rates on the 10-Year increased from roughly 1.5% to 3.0% in 2013 (“Taper Tantrum”), yet stock prices still rose +20%. The good news, at least for now, is the stock correction has been contained or mitigated. A significant chunk of the latest double-digit loss has been recovered, resulting in stock prices declining by a more manageable -3.9% for the month. Despite the monthly loss, the subsequent rebound in late February has still left investors with a gain of 1.5% for 2018. Not too shabby, especially considering this modest return comes on the heels of a heroic +19.4% gain in 2017.
As you can see at from the 22-year stock market chart below for the S&P 500, the brief but painful drop was merely a scary blip in the long-term scheme of things.
Whenever the market drops significantly over a short period of time, as it did this month, conspiracy theories usually come out of the woodwork in an attempt to explain the unexplainable. When human behavior is involved, rationalizing a true root cause can be very challenging, to say the least. It is certainly possible that technical factors contributed to the pace and scale of the recent decline, as has been the case in the past. Currently no smoking gun or fat finger has been discovered, however some pundits are arguing the popular usage of leveraged ETFs (Exchange Traded Funds) has contributed to the accelerated downdraft last month. Leveraged ETFs are special, extra-volatile trading funds that will move at amplified degrees – you can think of them as speculative trading vehicles on steroids. The low-cost nature, diversification benefits, and ability for traders to speculate on market swings and sector movements have led to an explosion in ETF assets to an estimated $4.6 trillion.
Regardless of the cause for the market drop, long-term investors have experienced these types of crashes in the past. Do you remember the 2010 Flash Crash (down -17%) or the October 1987 Crash (-23% one-day drop in the Dow Jones Industrial Average index)? Technology, or the lack thereof (circuit breakers), helped contribute to these past crashes. Since 1987, the networking and trading technologies have definitely become much more sophisticated, but so have the traders and their strategies.
Another risk I highlighted last month, which remains true today, is the potential for the new Federal Reserve chief, Jerome Powell, to institute a too aggressive monetary policy. During his recent testimony and answers to Congress, Powell dismissed the risks of an imminent recession. He blamed past recessions on previous Fed Chairmen who over enthusiastically increased interest rate targets too quickly. Powell’s comments should provide comfort to nervous investors. Regardless of short-term inflation fears, common sense dictates Powell will not want to crater the economy and his legacy by slamming the economic brakes via excessive rate hikes early during his Fed chief tenure.
Tax Cuts = Profit Gains
Despite the heightened volatility experienced in February, I remain fairly constructive on the equity investment outlook overall. The recently passed tax legislation (Tax Cuts and Job Act of 2017) has had an undeniably positive impact on corporate profits (see chart below of record profit forecasts – blue line). More specifically, approximately 75% of corporations (S&P 500 companies) have reported better-than-expected results for the past quarter ending December 31st. On an aggregate basis, quarterly profits have also risen an impressive +15% compared to last year. When you marry these stellar earnings results with the latest correction in stock prices, historically this combination of factors has proven to be a positive omen for investors.
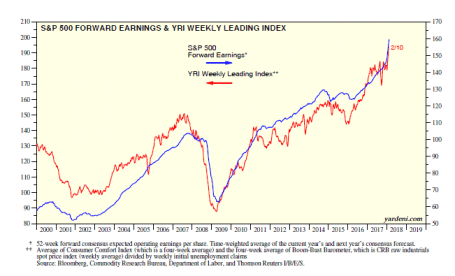
Source: Dr. Ed’s Blog
Despite the rosy profit projections and recent economic strength, there is always an endless debate regarding the future direction of the economy and interest rates. This economic cycle is no different. When fundamentals are strong, stories of spiking inflation and overly aggressive interest rate hikes by the Fed rule the media airwaves. On the other hand, when fundamentals deteriorate or slow down, fears of a 2008-2009 financial crisis enter the zeitgeist. The same tug-of-war fundamental debate exists today. The stimulative impacts of tax cuts on corporate profits are undeniable, but investors remain anxious that the negative inflationary side-effects from a potential overheating economy could outweigh the positive economic momentum of a near full-employment economy gaining steam.
Rather than playing Goldilocks with your investment portfolio by trying to figure out whether the short-term stock market is too hot or too cold, you would be better served by focusing on your long-term asset allocation, and low-cost, tax-efficient investment strategy. If you don’t believe me, you should listen to the wealthiest, most successful investor of all-time, Warren Buffett (The Oracle of Omaha), who just published his annual shareholder letter. In his widely followed letter, Buffett stated, “Performance comes, performance goes. Fees never falter.” To emphasize his point, Buffett made a 10-year, $1 million bet for charity with a high-fee hedge fund manager (Protégé Partners). As part of the bet, Buffett claimed an investment in a low-fee S&P 500 index fund would outperform a selection of high-fee, hot-shot hedge fund managers. Unsurprisingly, the low-cost index fund trounced the hedge fund managers. From 2008-2017, Buffett’s index fund averaged +8.5% per year vs. +3.0% for the hedge fund managers.
During scary blips like the one experienced recently, lessons can be learned from successful, long-term billionaire investors like Warren Buffett, but lessons can also be learned from my mother. Do yourself a favor by getting your investment portfolio in order, so my mother won’t have to say, “I told you so.”
Wade W. Slome, CFA, CFP®
Plan. Invest. Prosper.
This article is an excerpt from a previously released Sidoxia Capital Management complimentary newsletter (March 1, 2018). Subscribe on the right side of the page for the complete text.
DISCLOSURE: Sidoxia Capital Management (SCM) and some of its clients hold positions in certain exchange traded funds (ETFs), but at the time of publishing had no direct position in any other security referenced in this article. No information accessed through the Investing Caffeine (IC) website constitutes investment, financial, legal, tax or other advice nor is to be relied on in making an investment or other decision. Please read disclosure language on IC Contact page.
Glass Moving from Half-Empty to Half-Full

This article is an excerpt from a previously released Sidoxia Capital Management complimentary newsletter (February 1, 2018). Subscribe on the right side of the page for the complete text.
Economic growth accelerated in 2017, the unemployment rate is sitting at a 17-year low, housing prices are up significantly, Consumer Confidence is near the highs of 2000, corporations are doing cartwheels thanks to tax cut legislation, and the stock market has recently set new records. Not a bad start to the year, eh?
Fat Wallets & Stuffed Purses
The strength of the economy, coupled with the optimism of business and consumers, has resulted in a financial boon for Americans, as shown in the chart below. Not only have financial assets and real estate gone up significantly since the 2008-2009 Financial Crisis, but household debt has also remained relatively stable. The combination of these factors have American households sitting on almost $1 trillion in household value, a new record.
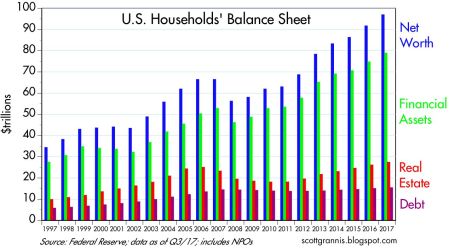
Source: Calafia Beach Pundit
As we move ahead through the first month of 2018, the +5.8% gain in the Dow Jones Industrial Average, and the +5.6% advance in the S&P 500 index have further fattened wallets and stuffed the purses of equity investors. On an annual basis, the results only look even better, with the Dow up +32% and the S&P +24%. Given the sharp appreciation in value, casual observers might expect a flood of new investors to pile into stocks and equity mutual funds…not true. Actually, this buying phenomenon has yet to occur. However, it is true investor sentiment has begun shifting to a “glass half-full” perspective due to the vast number of positive economic headlines. Nevertheless, it’s important for investors to remember this pace of gains cannot be sustainable forever.
There is no theoretical limit on the number of potential market moving events. The stock market could temporarily get rattled by another North Korean nuclear test, a terrorist attack, a geopolitical standoff, an inflammatory tweet, an infinite number of other unforeseen events, or stock prices could simply go down due to profit-taking (i.e., investors sell to lock-in gains). Regardless, the economic momentum is palpable and the president did not waste any time at the recent State of the Union address to remind Americans.
Currently, there are limited signs of euphoric stock buying, but there will be a point in time, as in all economic cycles, when investment excesses will overwhelm demand and will therefore lead to a recession. Let’s not forget, an overzealous monetary policy (i.e., too many rate increases), led by a new Federal Reserve chief (Jerome Powell), is another scenario which could slam the breaks on an overheated economy.
Follow the Money
In attempting to read the tea leaves about the future direction of the stock market, we are inspired by the famous quote from the 1976 film All the President’s Men, “Follow the money.” Actions speak louder than words in our book, which is why at Sidoxia Capital Management (www.Sidoxia.com), we track the money buying and selling actions of investors. There is never a shortage of information, and the professionals at the ICI (Investment Company Institute) are kind enough to publish the Weekly Fund Flows data (see chart below), which details the amount of dollars funneling in and out of stock and bond funds. Despite the stock market more than tripling in value, and contrary to common belief, more than -$200 billion has poured out of domestic stock funds and ETFs (Exchange Traded Funds) from 2015 through early 2018.
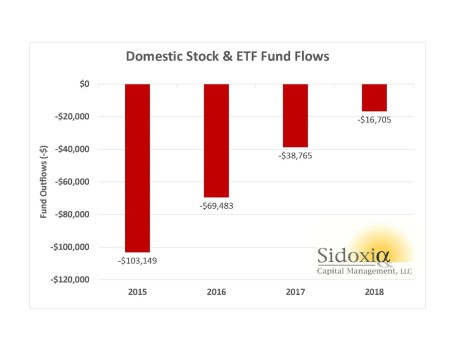
Source: ICI through 1-17-18
How can this counterintuitive money exodus transpire during a bull market? Quite simply, corporations have been using record piles of cash to buy trillions of dollars in stock through “stock buybacks” and “mergers & acquisitions” activity. All this corporate stock purchase activity has offset the money flowing out of funds, which has helped catapult stock prices higher. History tells us, that before this long-term bull market that started in 2009 ends, flows into U.S. stock mutual funds and ETFs will turn significantly positive after years of hemorrhaging.
Many speculators and traders waste time on a plethora of unreliable sentiment surveys and indicators (e.g., CBOE Volatility Index, AAII Sentiment Survey, Put-Call Ratio, etc), but my 25+ years of investment experience tells me the fund flows data works much better as a longer-term contrarian indicator. To put “contrarian” investing in English, famed billionaire investor, Warren Buffett, summed it up best when he said, “Be fearful when others are greedy and greedy when others are fearful.”
Sharing the Wealth
Speaking of greed, corporations have been greedy capitalists as they have watched profits surge to record levels. Yet many of these greedy corporations have decided to share some of the spoils garnered from the recent tax legislation with rank and file employees. For instance, consider the small sampling of the following large corporations that have decided to pay their employees bonuses:

Overall, even though trillions of savings remain in cash and money is still flowing out of US stock funds, the investment glass is shifting from a glass half-empty perception to a glass half-full impression. A time will come when the masses will believe the glass half-full will turn to a glass over-flowing. I don’t think anyone can predict with any certainty when that time will arrive, but I will continue doing my best to drink as much water as possible before it spills.
Wade W. Slome, CFA, CFP®
Plan. Invest. Prosper.
DISCLOSURE: Sidoxia Capital Management (SCM) and some of its clients hold positions in T, CMCSA, DIS, and certain exchange traded funds (ETFs), but at the time of publishing had no direct position in AAL, BAC, JBLU, LUV, USB, or any other security referenced in this article. No information accessed through the Investing Caffeine (IC) website constitutes investment, financial, legal, tax or other advice nor is to be relied on in making an investment or other decision. Please read disclosure language on IC Contact page.
Glass Half Full or Half Empty?

This article is an excerpt from a previously released Sidoxia Capital Management complimentary newsletter (May 1, 2017). Subscribe on the right side of the page for the complete text.
We live in a time of confusing dichotomies, which makes deciphering the flood of daily data quite challenging. In that context, determining whether the current economic fundamentals should be viewed from a glass half empty of glass half full perspective can be daunting.
More specifically, stock markets have again recently hit new all-time record highs, yet if you read the newspaper headlines, you might think we’re in the midst of Armageddon. Last month, the Dow Jones Industrial Average stock index eclipsed 21,000 and the technology-heavy NASDAQ index surpassed the psychologically important 6,000 threshold. In spite of the records, here’s a sampling of the steady stream of gloomy feature stories jamming the airwaves:
- French Elections – Danger of European Union Breakup
- Heightened Saber Rattling by U.S. Towards North Korea
- Threat of U.S. Government Shutdown
- First 100 Days – Obamacare repeal failure, tax reform delays, no significant legislation
- NAFTA Trade Disputes
- Russian Faceoff Over Syrian Civil War & Terrorism
- Federal Reserve Interest Rate Hikes Could Derail Stock Market
- Slowing GDP / Economic Data
Given all this doom, how is it then that stock markets continue to defy gravity and continually set new record highs? Followers of my writings understand the crucial, driving dynamics of financial markets are not newspaper, television, magazine, and internet headlines. The most important factors are corporate profits, interest rates, valuations, and investor sentiment. All four of these elements will bounce around, month-to-month, and quarter-to-quarter, but for the time being, these elements remain constructive on balance, despite the barrage of negative, gut-wrenching headlines.
Countering the perpetual flow of gloomy, cringe-worthy headlines, we have seen a number of positive developments:
- Record Breaking Corporate Profits: Profits are the chief propellant for higher stock prices, and so far, for the 1st quarter, S&P 500 company profits are estimated to have risen +12.4% – the highest rate since 2011, according to Thomson Reuters I/B/E/S. As I like to remind my readers, stock prices follow profits over the long-run, which is evidenced by the chart below.
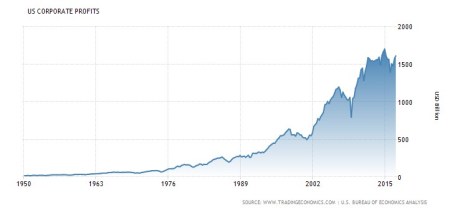
Source: Trading Economics
- Interest Rates Low: With interest rate levels still near generational lows (10-Year Treasury @ 2.28%), and inflation relatively stable around 2%, this augurs well for most asset prices. For U.S. consumers there are many stimulative effects to lower interest rates, whether you are buying a house, purchasing a car, paying off a school loan, and/or reducing credit card debt. Lower rates equal lower payments.
- Potential Tax Reform: There are numerous stimulative components to the largest planned tax-cut in history. First of all, cutting the tax rate from 35% to 15% for corporations and small businesses (i.e. pass-through entities like LLCs and S-Corps) would place a lot of dollars back in the pockets of taxpayers and should stimulate economic growth. Other components of the White House proposal include the termination of the estate tax, the elimination of the AMT (Alternative Minimum Tax) targeted at wealthier households, and the doubling of the standard deduction to help middle-income families. All of this sounds great on paper, but not a lot of details have been provided yet on how these benefits will be paid for – removing state tax deductions alone is unlikely to fully offset revenue declines. The chart below highlights how high U.S. corporate income tax rates are relative to other foreign counterparts.
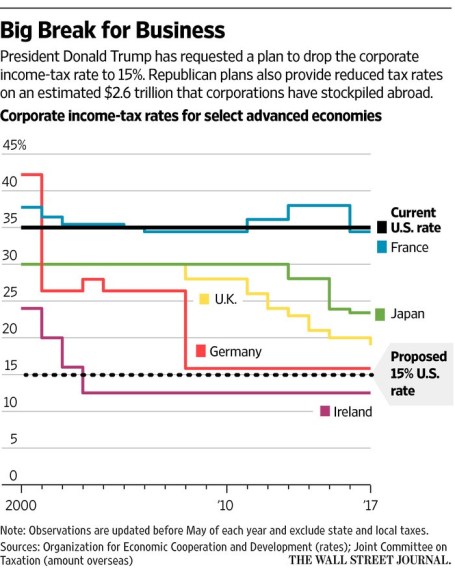
Source: The Wall Street Journal
- Business Spending & Confidence on the Rise: Ever since the 2008-09 Great Recession, the U.S. has been a better house in a bad neighborhood relative to other global developed economies. However, the recovery has been gradual and muted due to tight-fisted companies being slow to hire and invest. Although recent Q1 GDP economic data came in at a sluggish +0.7% growth rate, the bright spot embedded in the data was a +12% annualized increase in private fixed investment. This is consistent with the spike we’ve seen in recent business and consumer confidence surveys (see chart below). Although this confidence has yet to translate into an acceleration in broader economic data, the ramp in capital spending and positive business sentiment could be a leading indicator for faster economic growth to come. Stimulative legislation enacted by Congress (i.e., tax reform, infrastructure spending, foreign repatriation, etc.) could add further fuel to the economic growth engine.

Source: Trading Economics
- Economy Keeps Chugging Along: As the wealthiest country on the planet, we Americans can become a little spoiled with success, which helps explain the media’s insatiable appetite for growth. Nevertheless, the broader economic data show a continuing trend of improvement. Simply consider the trend occurring in these major areas of the economy:
- Unemployment – The jobless rate has been chopped by more than half from a 10.0% cycle peak to 4.5% today.
- Housing – The number of annual existing home sales has increased by more than +60% from the cycle low to 5.7 million units, which still leaves plenty of headroom for growth before 2006 peak sales levels are reached.
- Consumer Spending – This segment accounts for roughly 70% of our country’s economic activity. Although we experienced a soft patch in Q1 of 2017, as you can see from the chart below, we Americans have had no problem spending more to keep our economy functioning.
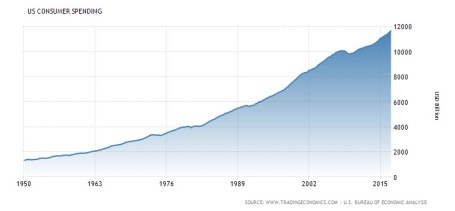
Source: Trading Economics
While key economic statistics remain broadly constructive, there will come a time when prudence will dictate the pursuit of a more defensive investment strategy. When will that be? In short, the time to become more cautious will be when we see a combination of the following occur:
- Sharp increase in interest rates
- Signs of a significant decline in corporate profits
- Indications of an economic recession (e.g., an inverted yield curve)
- Spike in stock prices to a point where valuation (prices) are at extreme levels and skeptical investor sentiment becomes euphoric
To date, there is no objective evidence indicating these dynamics are in place, so until then, I will remain thirsty and grab my half glass full of water.
Wade W. Slome, CFA, CFP®
Plan. Invest. Prosper.
DISCLOSURE: Sidoxia Capital Management (SCM) and some of its clients own certain exchange traded funds, but at the time of publishing SCM had no direct position in any other security referenced in this article. No information accessed through the Investing Caffeine (IC) website constitutes investment, financial, legal, tax or other advice nor is to be relied on in making an investment or other decision. Please read disclosure language on IC “Contact” page.
No April Fool’s Joke – Another Record

This article is an excerpt from a previously released Sidoxia Capital Management complimentary newsletter (April 3, 2017). Subscribe on the right side of the page for the complete text.
Having children is great, but a disadvantage to having younger kids are the April Fool’s jokes they like to play on parents. Fortunately, this year was fairly benign as I only suffered a nail-polish covered bar of soap in the shower. However, what has not been a joke has been the serious series of new record highs achieved in the stock market. While it is true the S&P 500 index finished roughly flat for the month (-0.0%) after hitting new highs earlier in March, the technology-laden NASDAQ index continued its dominating run, advancing +1.5% in March contributing to the impressive +10% jump in the first quarter. For 2017, the NASDAQ supremacy has been aided by the stalwart gains realized by leaders like Apple Inc. (up +24%), Facebook Inc. (up +23%), and Amazon.com Inc. (up +18%). The surprising fact to many is that these records have come in the face of immense political turmoil – most recently President Trump’s failure to deliver on a campaign promise to repeal and replace the Obamacare healthcare system.
Like a broken record, I’ve repeated there are much more important factors impacting investment portfolios and the stock market other than politics (see also Politics Schmolitics). In fact, many casual observers of the stock market don’t realize we have been in the midst of a synchronized, global economic expansion, helped in part by the stabilization in the value of the U.S. dollar over the last couple of years.
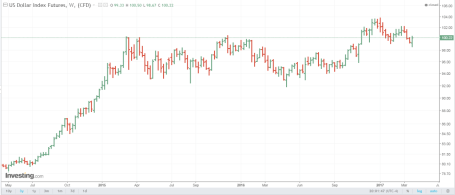
Source: Investing.com
As you can see above, there was an approximate +25% appreciation in the value of the dollar in late-2014, early-2015. This spike in the value of the dollar suddenly made U.S. goods sold abroad +25% more expensive, resulting in U.S. multinational companies experiencing a dramatic profitability squeeze over a short period of time. The good news is that over the last two years the dollar has stabilized around an index value of 100. What does this mean? In short, this has provided U.S. multinational companies time to adjust operations, thereby neutralizing the currency headwinds and allowing the companies to return to profitability growth.
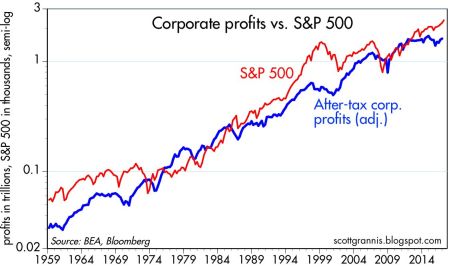
Source: Calafia Beach Pundit
And profits are back on the rise indeed. The six decade long chart above shows there is a significant correlation between the stock market (red line – S&P 500) and corporate profits (blue line). The skeptics and naysayers have been out in full force ever since the 2008-2009 financial crisis – I profiled these so-called “sideliners” in Get out of Stocks!.
As the stock market continues to hit new record highs, the doubters continue to scream danger. There will always be volatility, but when the richest investor of all-time, Warren Buffett, continues to say that stocks are still attractively priced, given the current interest rate environment, that goes a long way to assuage investor concerns.
Politically, a lot could still go wrong as it relates to healthcare, tax reform, and infrastructure spending, to name a few issues. However, it’s still early, and it’s possible positive surprises could also occur. More importantly, as I’ve noted before, corporate profits, interest rates, valuations, and investor sentiment are much more important factors than politics, and on balance these factors are on the favorable side of the ledger. These factors will have a larger impact on the long-term direction of stock prices.
With approval ratings of Congress and the President at low levels, investors have had trouble finding humor in politics, even on April Fool’s Day. Another significant factor more important than politics is the issue of retirement savings by Americans, which is no joke. As you finalize your tax returns in the coming weeks, it behooves you to revisit your retirement plan and investment portfolio. Inefficiently investing your money or outliving your savings is no laughing matter. I’ll continue with my disciplined financial plan and leave the laughing to my kids, as they enjoy planning their next April Fool’s Day prank.
Wade W. Slome, CFA, CFP®
Plan. Invest. Prosper.
DISCLOSURE: Sidoxia Capital Management (SCM) and some of its clients hold positions in AAPL, FB, AMZN, and certain exchange traded funds (ETFs), but at the time of publishing had no direct position in any other security referenced in this article. No information accessed through the Investing Caffeine (IC) website constitutes investment, financial, legal, tax or other advice nor is to be relied on in making an investment or other decision. Please read disclosure language on IC Contact page.
Double Dip Expansion?

Ever since the 2008-2009 financial crisis, every time the stock market has experienced a -5%, -10%, or -15% correction, industry pundits and media talking heads have repeatedly sounded the “Double Dip Recession” alarm bells. As you know, we have yet to experience a technical recession (two reported quarters of negative GDP growth), and stock prices have almost quadrupled from a 2009 low on the S&P 500 of 666 to 2,378 today (up approximately +257%).
Over the last nine years, so-called experts have been warning of an imminent stock market collapse from the likes of PIIGS (Portugal/Italy/Ireland/Greece/Spain), Cyprus, China, Fed interest rate hikes, Brexit, ISIS, U.S. elections, North Korea, French elections, and other fears. While there have been plenty of “Double Dip Recession” references, what you have not heard are calls for a “Double Dip Expansion.”
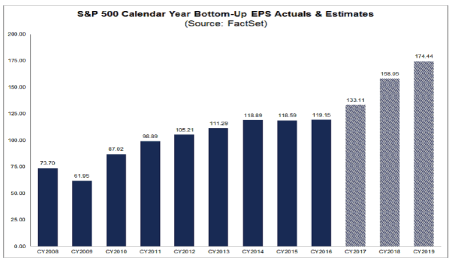
Is it possible that after the initial 2010-2014 economic expansionary rebound, and subsequent 2015-2016 earnings recession caused by sluggish global growth and a spike in the value of the U.S. dollar, we could possibly be in the midst of a “Double Dip Expansion?” (see earnings chart below)
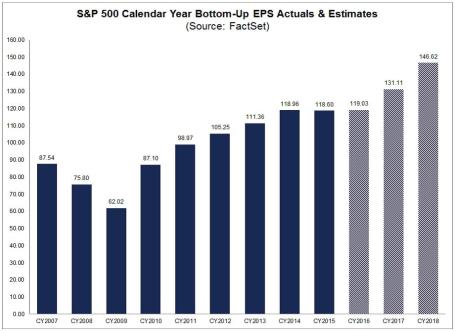
Source: FactSet
Whether you agree or disagree with the new political administration’s politics, the economy was already on the comeback trail before the November 2016 elections, and the momentum appears to be continuing. Not only has the pace of job growth been fairly consistent (+235,000 new jobs in February, 4.7% unemployment rate), but industrial production has been picking up globally, along with a key global trade index that accelerated to 4-5% growth in the back half of 2016 (see chart below).

Source: Calafia Beach Pundit
This continued, or improved, economic growth has arisen despite the lack of legislation from the new U.S. administration. Optimists hope for an improved healthcare system, income tax reform, foreign profit repatriation, and infrastructure spending as some of the initiatives to drive financial markets higher.
Pessimists, on the other hand, believe all these proposed initiatives will fail, and cause financial markets to fall into a tailspin. Regardless, at least for the period following the elections, investors and companies have perceived the pro-business rhetoric, executive orders, and regulatory relief proposals as positive developments. It’s widely understood that small businesses supply the largest portion of our nation’s jobs, and the upward spike in Small Business Optimism early in 2017 is a welcome sign (see chart below).
Source: Calafia Beach Pundit
Yes, it is true our new president could send out a rogue tweet; start a trade war due to a tariff slapped on a critical trading partner; or make a hawkish military remark that isolates our country from an ally. These events, along with other potential failed campaign promises, are all possibilities that could pause the trajectory of the current bull market. However, more importantly, as long as corporate profits, the mother’s milk of stock price appreciation, continue to march higher, then the stock market fun can continue. If that’s the case, there will likely be less talk of “Double Dip Recessions,” and more discussions of a “Double Dip Expansion.”
Wade W. Slome, CFA, CFP®
Plan. Invest. Prosper.
DISCLOSURE: Sidoxia Capital Management (SCM) and some of its clients hold positions in certain exchange traded funds (ETFs), but at the time of publishing had no direct position in any other security referenced in this article. No information accessed through the Investing Caffeine (IC) website constitutes investment, financial, legal, tax or other advice nor is to be relied on in making an investment or other decision. Please read disclosure language on IC Contact page.


