Posts tagged ‘corporate profits’
Big Debt and Massive AI Bet Not Yet a Threat

Government debt levels have reached stratospheric heights, and hundreds of billions in corporate borrowing are piling up to finance a gargantuan AI data center infrastructure buildout.
How have stock and bond investors responded to this unprecedented debt binge?
With a collective shrug.
For the month, the major stock indexes continued their march higher:
· S&P 500: +2.6%
· NASDAQ: +3.9%
· Dow Jones Industrial Average: +1.3%
Meanwhile, the bond market largely shrugged off hawkish rhetoric surrounding potential interest rate hikes from Federal Reserve Chairman Kevin Warsh following his speech at the closely watched Jackson Hole annual symposium.
More specifically, fixed-income performance held steady:
· U.S. Aggregate Bond (AGG): +0.0%
· 10-Year Treasury Note Yield: +0.3%(4.76%) Although interest rates have risen significantly from their post-pandemic lows, yields remain near historically manageable levels (see chart below) – especially when framed against the backdrop of robust corporate profit growth and broader economic resilience.
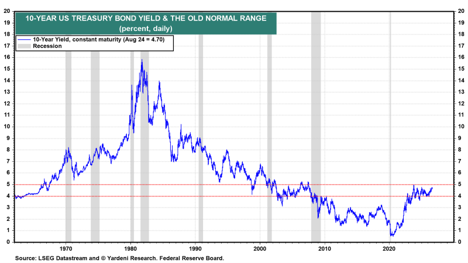
Source: Ed Yardeni
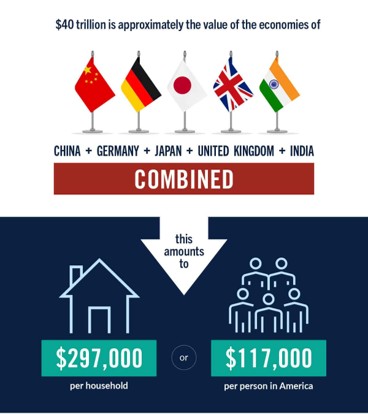
$40 Trillion Mountain of Debt As highlighted by the Peter G. Peterson Foundation, gross U.S. federal debt has officially breached the $40 trillion mark. To put that figure into perspective, here are a few insightful graphics (below).
Source: Peter G. Peterson Foundation
$40 trillion roughly equals the combined gross domestic product (GDP) of China, Germany, Japan, the UK, and India. It also translates to approximately $297,000 per U.S. household or $117,000 per person.
Source: Peter G. Peterson Foundation
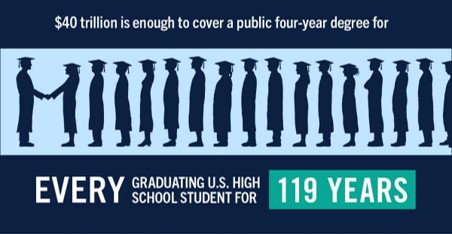
Expressed another way, $40 trillion could cover four-year college tuition for every graduating high school senior in America for the next 119 years.
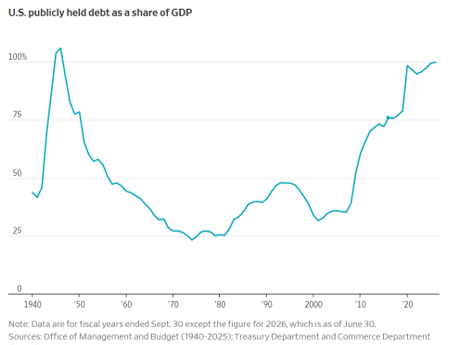
$40 Trillion in a Historical Perspective
Source: The Wall Street Journal
Measuring raw dollar debt over long spans of time can be misleading due to compound inflation. A far more accurate economic yardstick is calculating debt as a percentage of GDP (Gross Domestic Product). As shown above, national debt-to-GDP levels haven’t reached these heights in a generation – not since the massive fiscal spending surge needed to finance World War II.
Hand-wringing over national debt is hardly new. Over four decades ago, the front page of The New York Times (Sept 15, 1985) declared: “A $2 Trillion National Debt: Not Just Another Milestone.” The warnings then sounded identical to the alarms sounding today: “The $2 trillion figure reflects serious problems for government taxation and spending, as well as new strains on the economy.”
Just as in prior historical cycles, elevated debt ratios can eventually be brought back into balance. However, the longer policymakers kick the fiscal can down the road, the more difficult it will be to reverse the damaging trend. Mathematically, the remedy remains unchanged: the federal government must curb expenditures (Social Security, Medicare, and defense spending) and/or raise revenues (increase taxes).
How Can Stocks Prices Be at Record Highs?
Against a headline backdrop dominated by exploding federal debt, ongoing geopolitical conflict in the Middle East, Fed rate uncertainty, and AI data center backlash, how do equity markets keep hitting record highs?
It boils down to two fundamental drivers:
1) Surging Corporate Profitability
A solid underlying economy, anchored by healthy employment metrics (4.1% unemployment in July) is receiving a direct shot of adrenaline from the colossal capital investment flowing into artificial intelligence (see The Multi-Trillion AI Tsunami). Beyond reducing software coding overhead and customer support overhead via automated software agents, AI implementations are accelerating go-to-market timelines and driving faster top-line growth. The end result is an expanding waterfall of corporate profits, reflected in robust forward consensus estimates for +36% S&P 500 earnings growth (see chart below).
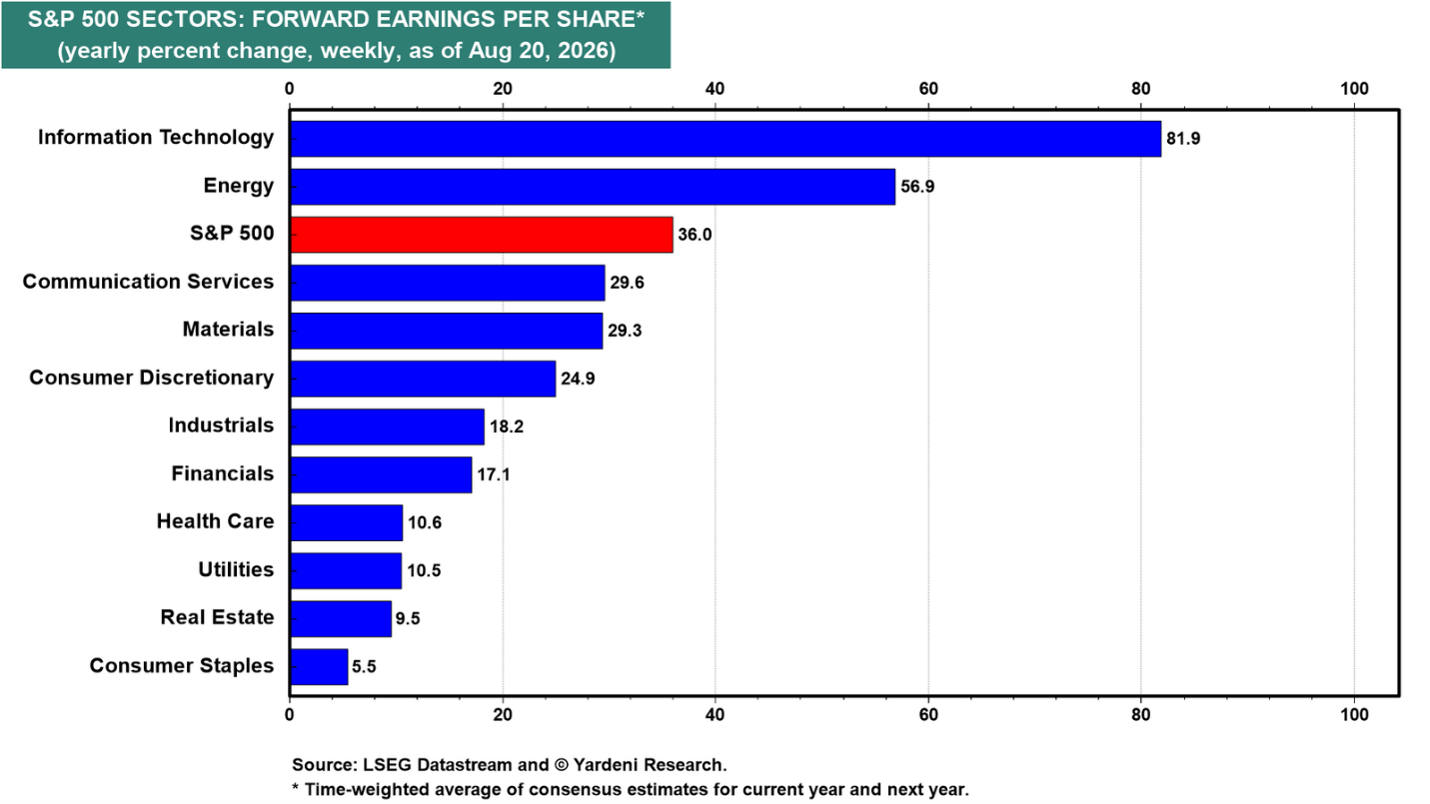
Source: Ed Yardeni
2) Mammoth AI Capex Converting to Revenues:
We remain in the early stages of the AI buildout, yet hyper-scalers and chipmakers are generating extraordinary top- and bottom-line expansion.
Consider NVIDIA Corp. (NVDA), sitting at the epicenter of the hardware buildout with a market valuation topping $5 trillion. The company recently posted nearly $100 billion in quarterly revenue while clearing over $50 billion in quarterly profit. Meanwhile, AI juggernaut Anthropic (founded just five years ago vs. NVIDIA 33 years ago), reported a $6.5 billion annual revenue run-rate in July, with internal projections pointing toward $190 billion to $200 billion by 2028. Reports indicate Anthropic is targeting a valuation as high as $2 trillion ahead of an anticipated public listing.
Airbnb: A Real-World AI Case Study
For skeptics questioning whether end-user enterprises are seeing concrete returns on their AI investments, look no further than the cloud computing divisions of major tech providers. Alphabet (GOOG), Amazon (AMZN), and Microsoft (MSFT) are collectively spending an estimated $615 billion in capital expenditures this year, which is backed by an impressive $1.4 trillion in combined remaining performance obligations (RPO) commitments from enterprise customers. The cloud divisions of the hyperscalers have achieved these whopping results with very minimal headcount growth (see AI Genie Out of the Bottle).
For the AI doubters, I would also direct you to the recent Q2 Shareholder report of Airbnb Inc. (ABNB), a Sidoxia Capital Management and personal investment. In the company’s Q2 Shareholder Letter, Co-Founder and CEO Brian Chesky detailed how fundamental integration of AI is translating into operational productivity.
“We’ve rebuilt Airbnb from the ground up to be an AI-native company, and it’s showing up in our results… On key initiatives, we’ve reduced the time from concept to delivery by as much as 60%. And compared to the same period last year, we’ve increased the number of features and improvements we’ve shipped this year by nearly 80%… The acceleration from AI allowed us to make hundreds of improvements across Airbnb for hosts and guests.”
These platform enhancements include:
- Hotel Stays: Seamless integration of thousands of new boutiques and independent hotels to the platform.
- Grocery Delivery: Partnered with grocer-delivery leader, Instacart (another Sidoxia investment).
- Car Rentals: Integrated rental car bookings with major fleets (including Hertz, Avis, Budget, and Enterprise).
- Airport Pickups: Feature added to increase convenience for travelers.
- Luggage Storage: Logistic benefit provided to customers arriving before check-in times (CEO called this a “sleeper hit”).

Source: Airbnb
It’s not difficult to imagine a day, in the not-too-distant future, when a query to Airbnb asking to organize my trip to Italy can result in the app automatically coordinating my entire customized itinerary in seconds.
Beyond improving the customer experience, AI is simultaneously reshaping Airbnb’s unit economics. Their AI customer support assistant now operates in 50 countries, resolving nearly 45% of incoming support inquiries autonomously without human agent intervention and has been rated the best AI support assistant in travel. This automation has driven a -16% reduction in its cost-per-booking translating into huge savings for the company.
Skeptics should take note of the next leg of AI expansion. The next major phase will be driven by all the companies/industries racing to learn and implement AI, so businesses can experience similar benefits accomplished by Airbnb.
The Net-Net
There is never a shortage of macroeconomic worries, including $40 trillion in national debt, central bank shifts, or geopolitical friction. Yet over multi-year horizons, stock prices track earnings and innovation. Right now, accelerating corporate productivity and the massive early-stage deployment of AI infrastructure remain the primary engines pushing equity markets to new all-time record highs.
Wade W. Slome, CFA, CFP®
Plan. Invest. Prosper.
This article is an excerpt from a previously released Sidoxia Capital Management complimentary newsletter (September 1, 2026). Subscribe Here to view all monthly articles.
Sidoxia Capital Management (SCM) and some of its clients hold positions in NVDA, GOOGL, AMZN, MSFT, ABNB and certain exchange traded funds (ETFs), but at the time of publishing had no direct position in any other security referenced in this article.
DISCLOSURE: No information accessed through the Investing Caffeine (IC) website constitutes investment, financial, legal, tax or other advice nor is to be relied on in making an investment or other decision. Each investor’s situation is unique so please work with a professional financial adviser, tax accountant or legal representative, as applicable, to develop an individualized plan or address any questions you may have. Investing involves risk including the possibility of loss of one’s investment.
No Market Misgiving on This Thanksgiving

We’ll see if there is any gravy left for investors during the last month of the year, but so far 2024 has been a satiating feast that has stuffed investors. There has been a cornucopia of items to be thankful for, including the Federal Reserve, which is expected to provide some dessert this month in the form of its third interest rate cut this year.
Investors certainly can also be grateful for the performance of the stock market, which has had a phenomenal year thus far (see chart below):
• S&P 500: +26.5%
• Dow Jones Industrial Average:+19.2%
• NASDAQ: +28.0%

On a two-year basis, the S&P 500 results look even tastier: +57.1%
Why is there such a large appetite for stocks? For starters, we are coming off a fresh election last month, and the majority of Americans decided to vote for the new administration that has promised additional stimulative tax cuts, and deregulation. If these promises come to fruition, these changes could augur well for corporate profits and a rising stock market. Regardless of whether your candidate won or lost the election, investors can agree there is less uncertainty with an uncontested election, which is welcomed by all. In addition, the two Fed rate cuts that started in September have also buoyed enthusiasm.
What is less clear are the effects of President-elect Donald Trump’s tariff policy threats, which if enacted run the risk of increasing inflation, stifling global trade, and jeopardizing future Fed rate cuts. Combined, these negative side effects have the potential of significantly dampening economic growth. On the other hand, if the tariffs are only used as a negotiating tool with our larger trading partners (including China, Mexico, Canada, and Europe), the tariff discussion will likely have more bark than bite. Time will tell.
Dissecting Stock Performance & Valuations
A lot of pundits are pointing to an overheated market, but on a 3-year basis, returns are looking more normalized (+8.2% per year) because of the -20% hit on stocks during 2022. As you may recall, much of the 2022 decline was caused by the Fed slamming on the economic breaks with its fastest rate-hiking cycle in four decades (raising rates from 0.0% to 5.5%).
Objectively, stock values, as measured by the Price-Earnings (P/E) ratio of the S&P 500, are at elevated levels – registering in at approximately 22-times next year’s forecasted profits. As you can see from the chart below, the stock market is priced at levels not seen since 2001 and valuations are roughly double what they were at the lows of the 2008 Financial Crisis.

Source: Yardeni.com
A major reason for escalated valuations has been the concentration of performance in the largest seven companies, or the so-called Magnificent 7 stocks, which include, Apple, Microsoft, Alphabet, Amazon.com, Nvidia, Meta Platforms and Tesla. In fact, the index concentration is the highest it has been in more than a half century – even higher than at the peak of the 2000 Tech Bubble when Cisco Systems, Microsoft, GE, Intel, and Exxon Mobil were the five largest companies by market capitalization (see chart below).

The good news is the other 493 companies in the S&P 500 (I call them the “Absentee 493”) are priced much more reasonably. This bifurcated dynamic between the largest seven companies versus everything else, highlights the plethora of opportunities available to be harvested in Value stocks, Small-cap stocks, and Mid-cap stocks.
As is evident in the chart below, the S&P 500 index (red-line), which is skewed by the Magnificent 7, is about 30% more expensive than Small-cap and Mid-cap stocks, which are hovering near historically attractive valuation levels.

Source: Yardeni.com
Value stocks (blue-line) in the market look equally attractive (about 30% cheaper than the S&P 500), as can be seen in the chart below.

Source: Yardeni.com
As always, the future is uncertain, and risks abound for next year. But 2024 has been a blockbuster year and there has been plenty to be thankful for, especially the performance of the U.S. stock market.
Wade W. Slome, CFA, CFP®
Plan. Invest. Prosper.
This article is an excerpt from a previously released Sidoxia Capital Management complimentary newsletter (December 2, 2024). Subscribe Here to view all monthly articles.
DISCLOSURE: Sidoxia Capital Management (SCM) and some of its clients hold positions in AAPL, AMZN, MSFT, GOOGL, META, TSLA, NVDA, and certain exchange traded funds (ETFs), but at the time of publishing had no direct position in CSCO, GE, XOM, INTC or any other security referenced in this article. No information accessed through the Investing Caffeine (IC) website constitutes investment, financial, legal, tax or other advice nor is to be relied on in making an investment or other decision. Please read disclosure language on IC Contact page.
Past Elections Status Quo Means No Need for Woe

Scarier than Halloween, the current presidential election is causing people on both sides of the political aisle to be frightened by the idea of their candidate potentially losing. Uncertainty is generally petrifying to investors, resulting in downward pressure on stock prices, but with less than a week until election day, the stock market is providing more treats than tricks. Sweetness has come in the form of a stock market up +20% in 2024 (up 8 out of 10 months this year), and only off -3% from its record high reached a few weeks ago. For the month, investors experienced modest declines as they braced for the election results. The S&P 500 dropped -1.0%, the Dow Jones Industrial Average -1.3%, and NASDAQ -0.5%.
Regardless of whether the red team or blue team wins the presidential election, the good news is history reminds us the end result has little effect on the long-term results of the stock market. As you can see from the chart below, over the last century, stock prices have gone up under both Republican and Democrat presidents. As Mark Twain famously stated, “History doesn’t repeat itself, but it often rhymes.” If that’s the case, past elections teach us, there is no need to fear the status quo of a Republican or Democrat president.

Source: Yardeni Research (Yardeni.com)
More recently, over the last 26 years, the stock market has been up significantly under each president, regardless of political party. Here are the results of the S&P 500 under the last three presidents:
- President Barack Obama(November 4, 2008 – November 8, 2016 – Democrat): +137%
- President Donald Trump(November 8, 2016 – November 3, 2020 – Republican): +51%
- President Joe Biden (November 3, 2020 – Present – Democrat): +63%
No matter who wins the White House, they will be inheriting a relatively strong economy. Consider the following tailwinds benefitting the new president:
- Strong Economy: The broadest measurement of economic activity, Gross Domestic Product (GDP), registered a healthy +2.8% growth rate for Q3
- Resilient Jobs Market: The just-reported unemployment rate of 4.1% today is representative of a strong but slowing job market. The unemployment rate has climbed modestly since troughing in 2023, but unemployment is still relatively low compared to historic levels much higher.
- Declining Inflation: As I pointed out last month (see Rate Cut Adrenaline) inflation has been on a fairly consistent downward trajectory over the last two years, which has allowed the Federal Reserve to cut interest rates by 0.50% in September. Moreover, based on the current economic environment, the Fed has signaled more stimulative interest rate cuts are likely ahead – economic strategists and pundits are predicting another 0.25% cut at the next Federal Reserve meeting that occurs over the two days following the elections.
- Record Corporate Profits (see chart below): The United States economy is the envy of the world, and the reason why is evident by the 65-year chart below showing record corporate profits and GDP. If you were an entrepreneur, where would you choose to start your company? China? Japan? UK? Russia? There’s plenty of room for improvements in our country’s policies, but there’s a reason the U.S. dominates in creating the largest and most profitable multi-trillion companies in the world.

Source: Calafia Beach Pundit
One area for improvement in the U.S. revolves around our fiscal debt and deficits. Our government simply spends too much money and doesn’t collect enough (tax receipts) to cover those expenses (see chart below). Another lesson to learn from our government’s excessive spending over the last four decades is that the glut of expenditures can’t be blamed on any one political party – the slope of spending is consistently up and to the right for all serving politicians.

Source: Calafia Beach Pundit
As I have mentioned in the past, stocks do not perpetually move up forever. However, regardless of the election outcome, we know from history that up-markets (bull markets) occur about 85% of the time, if we look at the last 100 years (see chart below). Analysis by Dimensional Fund Advisors shows that from 1926 – 2023, bull markets have lasted 994 months versus much shorter bear markets of 177 months.

Source: Dimensional Fund Advisors
It is very possible that stock prices may take a breather or correct under various election outcomes, but if we follow the historic status quo, there will be no long-term reason for woe.
Wade W. Slome, CFA, CFP®
Plan. Invest. Prosper.
This article is an excerpt from a previously released Sidoxia Capital Management complimentary newsletter (November 1, 2024). Subscribe Here to view all monthly articles.
DISCLOSURE: Sidoxia Capital Management (SCM) and some of its clients hold positions in individual stocks , certain exchange traded funds (ETFs), but at the time of publishing had no direct position in any other security referenced in this article. No information accessed through the Investing Caffeine (IC) website constitutes investment, financial, legal, tax or other advice nor is to be relied on in making an investment or other decision. Please read disclosure language on IC Contact page.
Another Hot Month, Another Fresh Record

Summer is coming to a close, but the weather is not the only thing that remains hot. The stock market has been scorching hot as well. Both the S&P 500 and Dow Jones Industrial Average blazed to all-time record highs last month. In fact, both of these indexes have risen seven out of eight months this year, including gains in the last four consecutive months. More specifically, the S&P 500 was up +2.8% last month and +18.4% this year, while the Dow Jones has advanced +1.8% for the month and +10.3% for the year.
How can this surging bull market be in existence while undergoing a war between Russia and Ukraine; military conflict in Gaza; a nasty Japanese Yen Carry Trade unwind; a highly divisive upcoming presidential election; a weakening economy; and rising unemployment (see chart below)?

Source: Calafia Beach Pundit
For all investors and traders, there is never a shortage of issues to worry about, even when times are good. However, despite the long laundry list of concerns, there are plenty of opposing tailwinds supporting the upswell in stock prices, starting with growing record corporate profits with strength forecasted through 2026 (see chart below).

Source: Yardeni.com (Yardeni Research)
Another factor underpinning the strength of stocks has been the decline in the inflation rate. The latest headline inflation rate (CPI – Consumer Price Index) fell to 2.9% in July, and if you exclude shelter costs, inflation has fallen below the Federal Reserve’s 2% target rate.

Source: Calafia Beach Pundit
Conversely, the story was quite different in 2022 when the Federal Reserve began its crusade against out-of-control inflation (see chart below) by starting its first of 11 interest rate hikes that spanned from January 2022 through July of 2023. The net result was a stock market that tanked -19% in 2022. More recently, the Fed has clearly signaled that inflation is more under control with traders predicting a 100% probability of a -0.25% or -0.50% cut in the targeted Federal Funds interest rate on September 18th. The Federal Reserve Chairman Jerome Powell gave a dovish speech at the annual policy meeting in Jackson Hole, Wyoming strongly portending September action – the first cut in four years since the pandemic.

AI Arms Race on Spending
Another dynamic contributing to new stock market record highs is the boom in AI (Artificial Intelligence) spending by the technology behemoths like Amazon.com Inc. (AMZN), Microsoft Corporation (MSFT), Meta Platforms Inc. (META), and Google – Alphabet Inc. (GOOGL). As I have been talking and writing about for some time (see World of AI), there is an arms race in spending to create the next, latest-greatest large language model (LLM) like ChatGPT. The goal is to bring more efficiency and accuracy to businesses and provide consumers more pleasure and time savings at both work and home. As you can see from the chart below, the four colossal technology companies previously mentioned are currently on a run-rate of spending more than a mind-boggling $200 billion annually, much of that going to the king of AI GPU (Graphics Processing Unit) manufacturing, NVIDIA Corporation (NVDA).
Why are companies spending so much on AI? Because they agree with NVIDIA CEO, Jensen Huang, who last week stated, “Generative AI will revolutionize every industry.” Despite all the spoils migrating to NVIDIA, traders were still looking for warts on the AI supermodel when they reported 2nd quarter results last week. Nonetheless, NVIDIA still delivered its 5th consecutive quarter of greater than 100% revenue growth, while generating revenues of almost $100 billion over the last 12 months – not too shabby. Although greedy investors wanted more, the stock was still up +2% for the month and +141% so far this year.

Source: Sherwood News
While economic, political and geopolitical concerns have been boiling over around the world, the stock market continues to sizzle higher. Declining inflation and interest rates, escalating business profits, and spiking artificial intelligence expenditures across corporate America have kept stocks cooking to record highs. It’s been a sweltering summer but not yet too hot for investors to get roasted out of the stock market kitchen.
Wade W. Slome, CFA, CFP®
Plan. Invest. Prosper.
This article is an excerpt from a previously released Sidoxia Capital Management complimentary newsletter (September 3, 2024). Subscribe Here to view all monthly articles.
DISCLOSURE: Sidoxia Capital Management (SCM) and some of its clients hold positions in individual stocks , certain exchange traded funds (ETFs), including AMZN, MSFT, META, GOOGL, NVDA, but at the time of publishing had no direct position in any other security referenced in this article. No information accessed through the Investing Caffeine (IC) website constitutes investment, financial, legal, tax or other advice nor is to be relied on in making an investment or other decision. Please read disclosure language on IC Contact page.
A Tale of Two Years: Happy & Not-So-Happy

Happy New Year! If you look at the stock market, 2019 was indeed a happy one. The S&P 500 index rose +29% and the Dow Jones Industrial Average was up +22%. Spectacular, right? More specifically, for the S&P 500, 2019 was the best year since 2013, while the Dow had its finest 12-month period since 2017. Worth noting, although 2019 made investors very happy, 2018 stock returns were not-so-happy (S&P 500 dropped -6%).
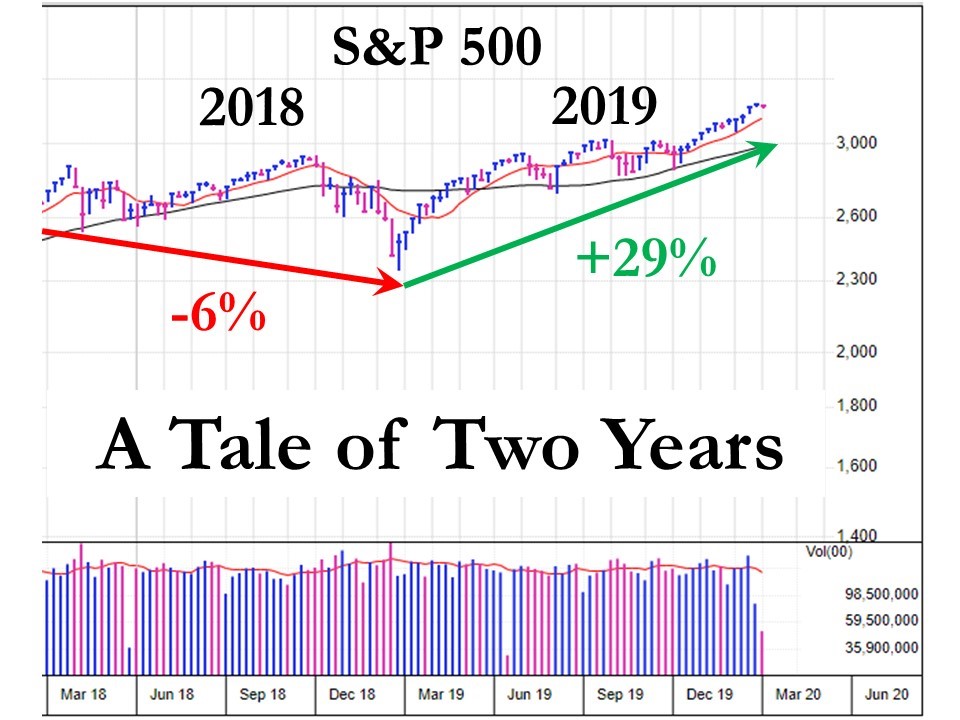
Source: Investor’s Business Daily
As measured against almost any year, the 2019 results are unreasonably magnificent. This has many prognosticators worrying that these gains are unsustainable going into 2020, and many pundits are predicting death and destruction are awaiting investors just around the corner. However, if the 2019 achievements are combined with the lackluster results of 2018, then the two-year average return (2018-2019) of +10% looks more reasonable and sustainable. Moreover, if history is a guide, 2020 could very well be another up year. According to Barron’s, stocks have finished higher two-thirds of the time in years following a +25% or higher gain.
With the yield on the 10-Year Treasury Note declining from 2.7% to 1.9% in 2019, it should come as no surprise that bonds underwent a reversal of fortune as well. All else equal, both existing bond and stock prices generally benefit from declining interest rates. The U.S. Aggregate Bond Index climbed +5.5% in 2019, a very respectable outcome for this more conservative asset class, after the index experienced a modest decline in 2018.
Happy Highlights
What contributed to the stellar financial market results in 2019? There are numerous contributing factors, but here are a few explanations:
 Source: Dr. Ed’s Blog
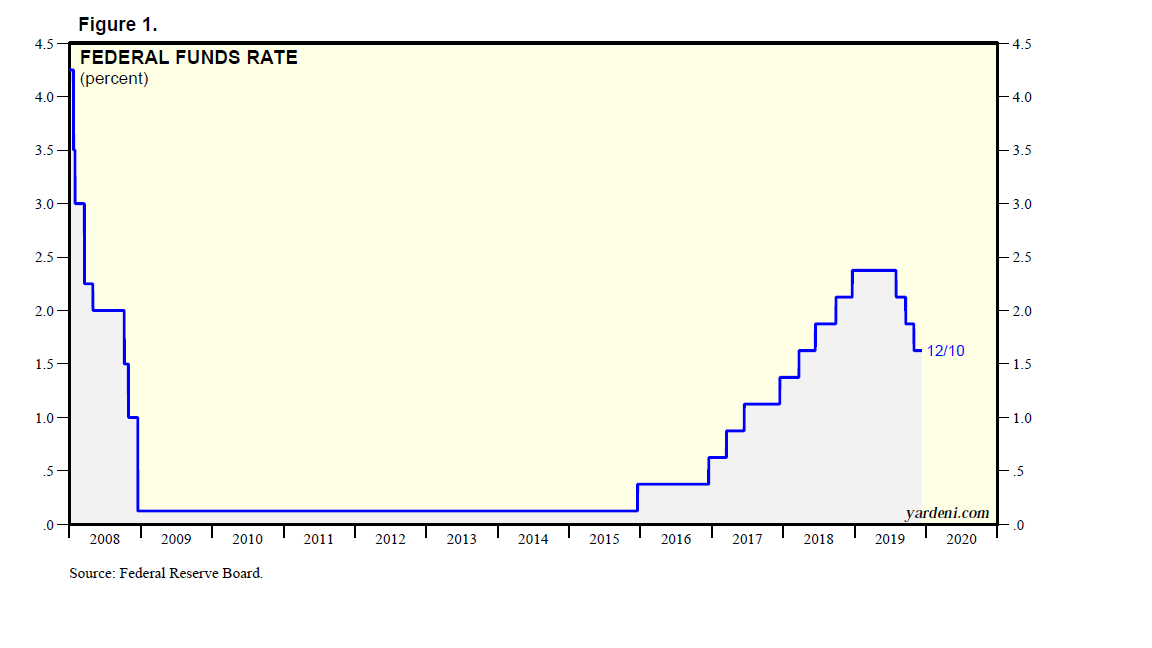
- Federal Reserve Cuts Interest Rates: After slamming on the brakes in 2018 by hiking interest rates four times, the central bank added stimulus to the economy by cutting interest rates three times in 2019 (see chart above).
- Phase I Trade Deal with China: Washington and Beijing reached an initial trade agreement that will reduce tariffs and force China to purchase larger volumes of U.S. farm products.
- Healthy Economy: 2019 economic growth (Gross Domestic Product) is estimated to come in around +2.3%, while the most recent unemployment rate of 3.5% remains near a 50-year low.
- Government Shutdown Averted: Congress approved $1.4 trillion in spending packages to avoid a government shutdown. The spending boosts both the military and domestic programs and the signed bills also get rid of key taxes to fund the Affordable Care Act and raises the U.S. tobacco buying age to 21.
- Brexit Delayed: The October 31, 2019 Brexit date was delayed, and now the U.K. is scheduled to leave the European Union on January 31, 2020. EU officials are signaling more time may be necessary to prevent a hard Brexit.
- Sluggish Global Growth Expected to Rise in 2020: Global growth rates are expected to increase in 2020 with little chance of recessions in major economies. The Financial Times writes, “The outlook from the models shows global growth rates rising next year, returning roughly to trend rates. Recession risks are deemed to be low, currently standing about 5 per cent for the US and 15 per cent for the eurozone.”
- Potential Bipartisan Infrastructure Spend: In addition to the $1.4 trillion in aforementioned spending, Nancy Pelosi, the Speaker of the Democratic-controlled House of Representatives, said she is willing to work with the Republicans and the White House on a stimulative infrastructure spending bill.
2018-2019 Lesson Learned
One of the lessons learned over the last two years is that listening to the self-proclaimed professionals, economists, strategists, and analysts on TV, or over the blogosphere, is dangerous and usually a waste of your time. For stock market participants, listening to experienced and long-term successful investors is a better strategy to follow.
Conventional wisdom at the beginning of 2018 was that a strong economy, coupled with the Tax Reform Act that dramatically reduced tax rates, would catapult corporate profits and the stock market higher. While many of the talking heads were correct about the trajectory of S&P 500 profits, which propelled upwards by an astonishing +24%, stock prices still sank -6% in 2018 (as mentioned earlier). If you fast forward to the start of 2019, after a -20% correction in stock prices at the end of 2018, conventional wisdom stated the economy was heading into a recession, therefore stock prices should decline further. Wrong!
As is typical, the forecasters turned out to be completely incorrect again. Although profit growth for 2019 was roughly flat (0%), stock prices, as previously referenced, unexpectedly skyrocketed. The moral of the story is profits are very important to the direction of future stock prices, but using profits alone as a timing mechanism to predict the direction of the stock market is nearly impossible.
So, there you have it, 2018 and 2019 were the tale of two years. Although 2018 was an unhappy year for investors in the stock market, 2019’s performance made investors happier than average. When you combine the two years, stock investors should be in a reasonably good mood heading into 2020 with the achievement of a +10% average annual return. While this multi-year result should keep you happy, listening to noisy pundits will make you and your investment portfolio unhappy over the long-run. Rather, if you are going to heed the advice of others, it’s better to pay attention to seasoned, successful investors…that will put a happy smile on your face.

Wade W. Slome, CFA, CFP®
Plan. Invest. Prosper.
This article is an excerpt from a previously released Sidoxia Capital Management complimentary newsletter (January 2, 2019). Subscribe on the right side of the page for the complete text.
DISCLOSURE: Sidoxia Capital Management (SCM) and some of its clients hold positions and certain exchange traded funds (ETFs), but at the time of publishing had no direct position in any other security referenced in this article. No information accessed through the Investing Caffeine (IC) website constitutes investment, financial, legal, tax or other advice nor is to be relied on in making an investment or other decision. Please read disclosure language on IC Contact page.
March Madness Leads to Gladness

As usual, there was plenty of “madness” in March, and this year did not disappoint. Just as is the case with the annual NCAA basketball tournament, certain investors suffered the agony of defeat in the financial markets, but overall, the thrill of victory triumphed in March. So much so that the S&P 500 index posted its largest first-quarter gain in more than 20 years. Not only did the major indexes post gains for the month, but the winning record looks even better for the year-to-date results. For 2019, the S&P 500 index is up +13.1%; the Dow Jones Industrial Average +11.2%; and the tech-heavy NASDAQ index +16.5% for the year. The monthly gains in the major indexes were more muted, ranging from 0% for the Dow to +2.6% for the NASDAQ.
Busy? Listen to Wade discuss this article and other topics each week on the Weekly Grind podcast:
While 2018 ended with a painful injury (S&P 500 -6.2% in Q4), on fears of a deteriorating China trade deal and a potentially overly aggressive Federal Reserve hiking interest rates, the stock market ultimately recovered in 2019 on changing perceptions. Jerome Powell, the Federal Reserve Chairman, indicated the Fed would be more “patient” going forward in increasing interest rates, and President Trump’s tweet-storm on balance has been optimistic regarding the chances of hammering out a successful trade deal with China.
With the new cautious Fed perspective on interest rates, the yield on the 10-Year Treasury Note fell by -0.28% for the quarter from 2.69% to 2.41%. In fact, investors are currently betting there is a greater than 50% probability the Fed will cut interest rates before year-end. Moreover, in testimony before Congress, Powell signaled the economic dampening policy of reducing the Fed’s balance sheet was almost complete. All else equal, the shift from a perceived rate-hiking Fed to a potentially rate-cutting Fed has effectively turned an apparent headwind into tailwind. Consumers are benefiting from this trend in the housing market, as evidenced by lower 30-year fixed mortgage rates, which in some cases have dropped below 4%.
Economy: No Slam Dunk
However, not everything is a slam dunk in the financial markets. Much of the change in stance by the Fed can be attributed to slowing economic growth seen both here domestically and abroad, internationally.
Here in the U.S., the widely followed monthly jobs number last month only showed a gain of 20,000 jobs, well below estimates of 180,000 jobs. This negative jobs surprise was the biggest miss in more than 10 years. Furthermore, the overall measure for our nation’s economic activity, growth in Gross Domestic Product (GDP), was revised downward to +2.2% in Q4, below a previous estimate of +2.6%. The so-called “inverted yield curve” (i.e., short-term interest rates are higher than long-term interest rates), historically a precursor to a recession, is consistent with slowing growth expectations. This inversion temporarily caused investors some heartburn last month.
If you combine slowing domestic economic growth figures with decelerating manufacturing growth in Europe and China (e.g. contracting Purchasing Managers’ Index), then suddenly you end up with a slowing global growth picture. In recent months, the U.S. economy’s strength was perceived as decoupling from the rest of the world, however recent data could be changing that view.
Fortunately, the ECB (European Central Bank) and China have not been sitting on their hands. ECB President Mario Draghi announced three measures last month that could cumulatively add up to some modest economic stimulus. First, it “expects the key ECB interest rates to remain at their present levels at least through the end of 2019.” Second, it committed to reinvesting all maturing bond principal payments in new debt “for an extended period of time.” And third, the ECB announced a new batch of “Targeted Long-Term Refinancing Operations” starting in September. Also, Chinese Premier Li Keqiang announced the government will reduce taxes, primarily Value Added Taxes (VAT) and social security taxes (SST). Based on the rally in equities, it appears investors are optimistic these stimulus efforts will eventually succeed in reigniting growth.
Volume of Political Noise Ratcheted Higher
While I continually try to remind investors to ignore politics when it comes to their investment portfolios, the deafening noise was especially difficult to overlook considering the following:
- Mueller Report Completed: Robert Mueller’s Special Counsel investigation into potential collusion as it relates Russian election interference and alleged obstruction of justice concluded.
- Michael Cohen Testifies: Former President Trump lawyer, Michael Cohen, testified in closed sessions before the House and Senate intelligence committees, and in public to the House Oversight Committee. In the open session, Cohen, admitted to paying hush money to two women during the election. Cohen called President Trump a racist, a conman, and a cheat but Cohen is the one heading to jail after being sentenced for lying to Congress among other charges.
- Manafort Sentenced: Former Trump Campaign Chairman Paul Manafort was sentenced to prison on bank and tax fraud charges.
- North Korea No Nuke Deal: In geopolitics,President Trump flew 21 hours to Vietnam to meet for a second time with North Korean leader Kim Jong Un on denuclearization of the Korean peninsula. The U.S. president ended up leaving early, empty handed, without signing an agreement, after talks broke down over sanction differences.
- Brexit Drama Continues: The House of Commons in the lower house of the U.K. Parliament continued to stifle Prime Minister Theresa May’s plan to exit the European Union with repeated votes rejecting her proposals. Brexit outcomes remain in flux, however the European Union did approve an extension to May 22 to work out kinks, if the House can approve May’s plan.
Positive Signals Remain
March Madness reminds us that a big lead can be lost quickly, however a few good adjustments can also swiftly shift momentum in the positive direction. Although growth appears to be slowing both here and internationally, corporate profits are not falling off a cliff, and earnings remain near record highs (see chart below).
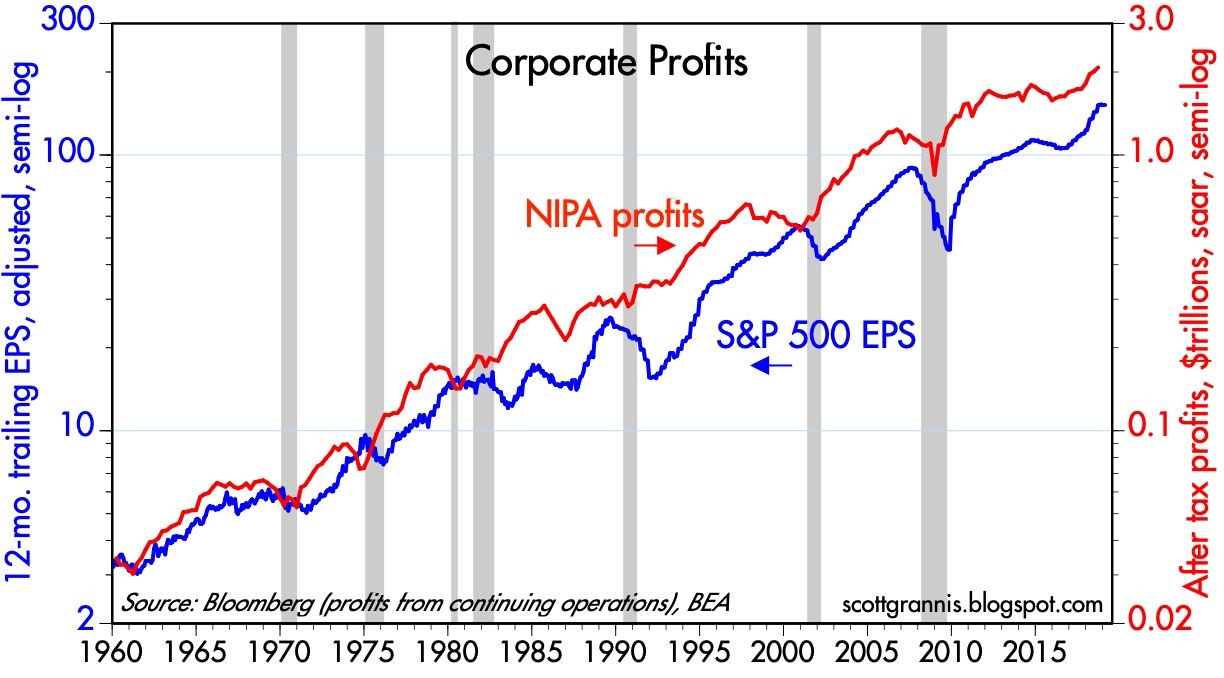
Source: Calafia Beach Pundit
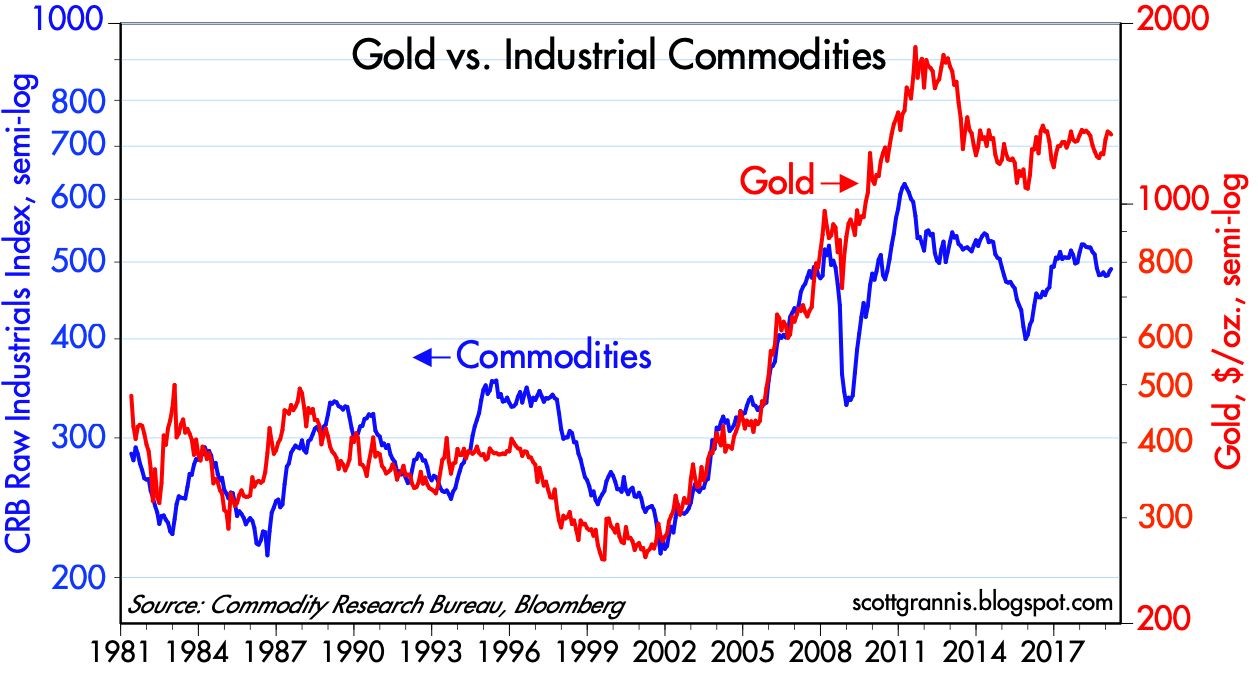
Similar to the stock market, commodities can be a good general barometer of current and future economic activity. As you can see from the chart below, not only have commodity prices remained stable in the face of slowing economic data, but gold prices have not spiked as they did during the last financial crisis.
Source: Calafia Beach Pundit
After 2018 brought record growth in corporate profits and negative returns, 2019 is producing a reverse mirror image – slow profit growth and record returns. The volatile ending to 2018 and triumphant beginning to 2019 is a reminder that “March Madness” does not need to bring sadness…it can bring gladness.

Wade W. Slome, CFA, CFP®
Plan. Invest. Prosper.
This article is an excerpt from a previously released Sidoxia Capital Management complimentary newsletter (April 1, 2019). Subscribe on the right side of the page for the complete text.
DISCLOSURE: Sidoxia Capital Management (SCM) and some of its clients hold positions and certain exchange traded funds (ETFs), but at the time of publishing had no direct position in any other security referenced in this article. No information accessed through the Investing Caffeine (IC) website constitutes investment, financial, legal, tax or other advice nor is to be relied on in making an investment or other decision. Please read disclosure language on IC Contact page.
Podcast 3/3/19: Week in Review and Share Buybacks

The Investing Caffeine podcast is designed to wake up your investment brain with weekly overviews of financial markets and other economic-related topics.
Episode 2
Market Review, Stock Ideas, and The Weekly Rant: Share Buybacks
Don’t miss out! Follow us on either SoundCloud or PodBean to get a new episode each week. Or follow our InvestingCaffeine.com blog and watch for new podcast updates each week.
SoundCloud: soundcloud.com/sidoxia
PodBean: sidoxia.podbean.com

From Gloom to Boom

Gloomy clouds rolled in late last year in the form of a government shutdown; U.S. – China trade war tensions; hawkish Federal Reserve interest rate policies; a continued special counsel investigation by Robert Mueller into potential Russian election interference; a change in the Congressional balance of power; Brexit deal uncertainty; and U.S. recession concerns, among other worries. These fear factors contributed to a thundering collapse in stock prices during the September to December time frame of approximately -20% in the S&P 500 index (from the September 21st peak until the December 24th trough).
However, the dark storm clouds quickly lifted once Santa Claus delivered post-Christmas stock price gains that have continued through February. More specifically, since Christmas Eve, U.S. stocks have rebounded a whopping +18%. On a shorter term basis, the S&P 500 index and the Dow Jones Industrial Average have both jumped +11.1% in 2019. January showed spectacular gains, but last month was impressive as well with the Dow climbing +3.7% and the S&P +3.0%.
The rapid rise and reversal in negative sentiment over the last few months have been aided by a few positive developments.
- Strong Earnings Growth: For starters, 2018 earnings growth finished strong with an increase of roughly +13% in Q4-2018, thereby bringing the full year profit surge of roughly +20%. All else equal, over the long run, stock prices generally follow the path of earnings growth (more on that later).
- Solid Economic Growth: If you shift the analysis from the operations of companies to the overall performance of the economy, the results in Q4 – 2018 also came in better than anticipated (see chart below). For the last three months of the year, the U.S. economy grew at a pace of +2.6% (higher than the +2.2% GDP [Gross Domestic Product] growth forecast), despite headwinds introduced by the temporary U.S. federal government shutdown and the lingering Chinese trade spat. For the full-year, GDP growth came in very respectably at +2.9%, but critics are dissecting this rate because it was a hair below the coveted 3%+ target of the White House.

Source: The Wall Street Journal
- A More Accommodative Federal Reserve: As mentioned earlier, a major contributing factor to the late-2018 declines was driven by a stubborn Federal Reserve that was consistently raising their interest rate target (an economic-slowing program that is generally bad for stocks and bonds), which started back in late 2015 when the Federal Funds interest rate target was effectively 0%. Over the last three years, the Fed has raised its target rate range from 0% to 2.50% (see chart below), while also bleeding off assets from its multi-trillion dollar balance sheet (primarily U.S. Treasury and mortgage-backed securities). The combination of these anti-stimulative policies, coupled with slowing growth in major economic regions like China and Europe, stoked fears of an impending recession here in the U.S. Fortunately for investors, however, the Federal Reserve Chairman, Jerome Powell, came to the rescue by essentially implementing a more “patient” approach with interest rate increases (i.e., no rate increases expected in the foreseeable future), while simultaneously signaling a more flexible approach to ending the balance sheet runoff (take the program off “autopilot).

Source: Dr. Ed’s Blog
The Stock Market Tailwinds
For those of you loyal followers of my newsletter articles and blog articles over the last 10+ years, you understand that my generally positive stance on stocks has been driven in large part by a couple of large tailwinds (see also Don’t Be a Fool, Follow the Stool):
#1) Low Interest Rates – Yes, it’s true that interest rates have inched higher from “massively low” levels to “really low” levels, but nevertheless interest rates act as the cost of holding money. Therefore, when inflation is this low, and interest rates are this low, stocks look very attractive. If you don’t believe me, then perhaps you should just listen to the smartest investor of all-time, Warren Buffett. Just this week the sage billionaire reiterated his positive views regarding the stock market during a two hour television interview, when he once again echoed his bullish stance on stocks. Buffett noted, “If you tell me that 3% long bonds will prevail over the next 30 years, stocks are incredibly cheap… if I had a choice today for a ten-year purchase of a ten-year bond at whatever it is or ten years, or– or buying the S&P 500 and holding it for ten years, I’d buy the S&P in a second.”
#2) Rising Profits – In the short-run, the direction of profits (orange line) and stock prices (blue line) may not be correlated (see chart below), but over the long-run, the correlation is amazingly high. For example, you can see this as the S&P 500 has risen from 666 in 2009 to 2,784 today (+318%). More recently, profits rose about +20% during 2018, yet stock prices declined. Moreover, profits at the beginning of 2019 (Q1) are forecasted to be flat/down, yet stock prices are up +11% in the first two months of the year. In other words, the short-term stock market is schizophrenic, so focus on the key long-term trends when planning for your investments.

Source: Macrotrends
Although 2018 ended with a gloomy storm, history tells us that sunny conditions have a way of eventually returning unexpectedly with a boom. Rather than knee-jerk reacting to volatile financial market conditions after-the-fact, do yourself a favor and create a more versatile plan that deals with many different weather conditions.
Wade W. Slome, CFA, CFP®
Plan. Invest. Prosper.
This article is an excerpt from a previously released Sidoxia Capital Management complimentary newsletter (March 1, 2018). Subscribe on the right side of the page for the complete text.
DISCLOSURE: Sidoxia Capital Management (SCM) and some of its clients hold positions and certain exchange traded funds (ETFs), but at the time of publishing had no direct position in any other security referenced in this article. No information accessed through the Investing Caffeine (IC) website constitutes investment, financial, legal, tax or other advice nor is to be relied on in making an investment or other decision. Please read disclosure language on IC Contact page.
P.S.
Wade’s Investing Caffeine Podcast Has Arrived!

Wade Slome, founder of Sidoxia Capital Management, author of How I Managed $20 Billion Dollars by Age 32, and lead editor of the Investing Caffeine blog has launched the Caffeine Corner investment podcast.
The Investing Caffeine podcast is designed to wake up your investment brain with weekly overviews of financial markets and other economic-related topics.
Don’t miss out! Follow us on either SoundCloud or PodBean to get a new episode each week. Or follow our InvestingCaffeine.com blog and watch for new podcast updates each week.


January a Ball After Year-End Fall

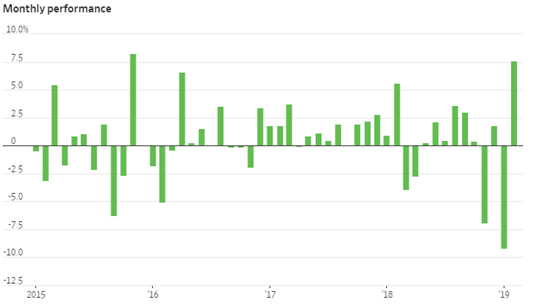
Investors were cheerfully dancing last month after the stock market posted its best January in 30 years and the best monthly performance since October 2015 (see chart below). More specifically, the S&P 500 index started the year by catapulting +7.9% higher (the best January since 1987), and the Dow Jones Industrial Average climbed 1,672 points to 25,000, or +7.2%. But over the last few months there has been plenty of heartburn and volatility. The December so-called Santa Claus rally did not occur until a large pre-Christmas pullback. From the September record high, stocks temporarily fell about -20% before the recent jolly +15% post-Christmas rebound.
Source: FactSet via The Wall Street Journal
Although investors have been gleefully boogying on the short-run financial dance floor, there have been plenty of issues causing uncomfortable blisters. At the top of the list is China-U.S. trade. The world is eagerly watching the two largest global economic powerhouses as they continue to delicately dance through trade negotiations. Even though neither country has slipped or fallen since the 90-day trade truce, which began on December 1 in Buenos Aires, the stakes remain high. If an agreement is not reached by March 2, tariffs on imported Chinese goods would increase to 25% from 10% on $200 billion worth of Chinese goods, thereby raising prices for U.S. consumers and potentially leading to further retaliatory responses from Beijing.
When it comes to the subjects of intellectual property protection and forced technology transfers of American companies doing business in China, President Xi Jinping has been uncomfortably stepping on President Donald Trump’s toes. Nothing has been formally finalized, however Chinese officials have signaled they are willing to make some structural reforms relating to these thorny issues and have also expressed a willingness to narrow the trade deficit with our country by purchasing more of our exports. Besides procuring more American energy goods, the Chinese have also committed to buy 5,000,000 tons of our country’s soybeans to feed China’s hungry population of 1.4 billion people.
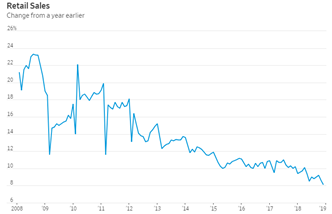
Reaching a trade settlement is important for both countries, especially in light of the slowing Chinese economy (see chart below) and the dissipating stimulus benefits of the 2018 U.S. tax cuts. Slowing growth in China has implications beyond our borders as witnessed by slowing growth in Europe as evidenced by protests we have seen in France and the contraction of German manufacturing (the first time in over four years). Failed Brexit talks of the U.K. potentially leaving the European Union could add fuel to the global slowdown fire if an agreement cannot be reached by the March 29th deadline in a couple months.
Source: Wind via The Wall Street Journal
While the temporary halt to the longest partial federal government shutdown in history (35 days) has brought some short-term relief to the 800,000 government workers/contractors who did not receive pay, the political standoff over border security may last longer than expected, which may further dampen U.S. economic activity and growth. Whether the hot-button issue of border wall funding is resolved by February 15th will determine if another shutdown is in the cards.
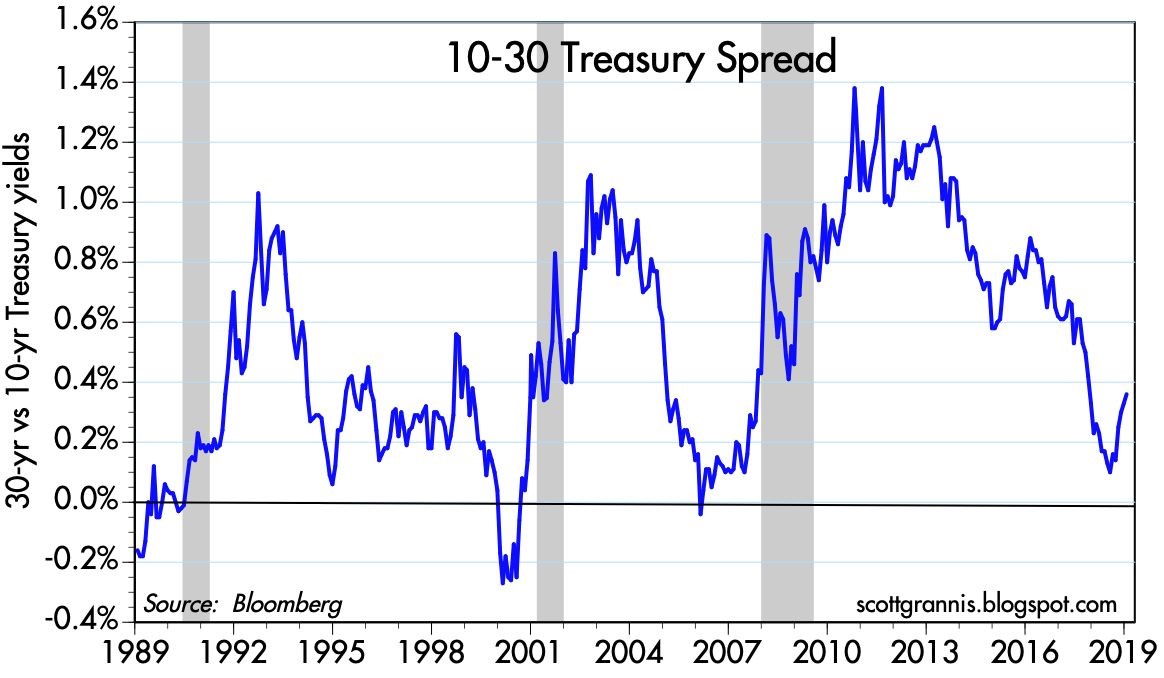
Despite China trade negotiations and the government shutdown deadlock placing a cloud over financial markets, brighter skies have begun to emerge in other areas. First and foremost has been the positive shift in positioning by the Federal Reserve as it relates to monetary policy. Not only has Jay Powell (Fed Chairman) communicated a clear signal of being “patient” on future interest rate target increases, but he has also taken the Fed off of “autopilot” as it relates to shrinking the Fed’s balance sheet – a process that can hinder economic growth. Combined, these shifts in strategy by the Fed have been enthusiastically received by investors, which has been a large contributor to the +15% rebound in stock prices since the December lows. Thanks to this change in stance, the inverted yield curve bogeyman that typically precedes post-World War II recessions has been held at bay as evidenced by the steepening yield curve (see chart below).
Source: Calafia Beach Pundit
Other areas of strength include the recent employment data, which showed 304,000 jobs added in January, the 100th consecutive month of increased employment. Fears of an imminent recession that penetrated psyches in the fourth quarter have abated significantly in January in part because of the notable strength seen in 4th quarter corporate profits, which so far have increased by +12% from last year, according to FactSet. The strength and rebound in overall commodity prices, including oil, seem to indicate any potential looming recession is likely further out in time than emotionally feared.
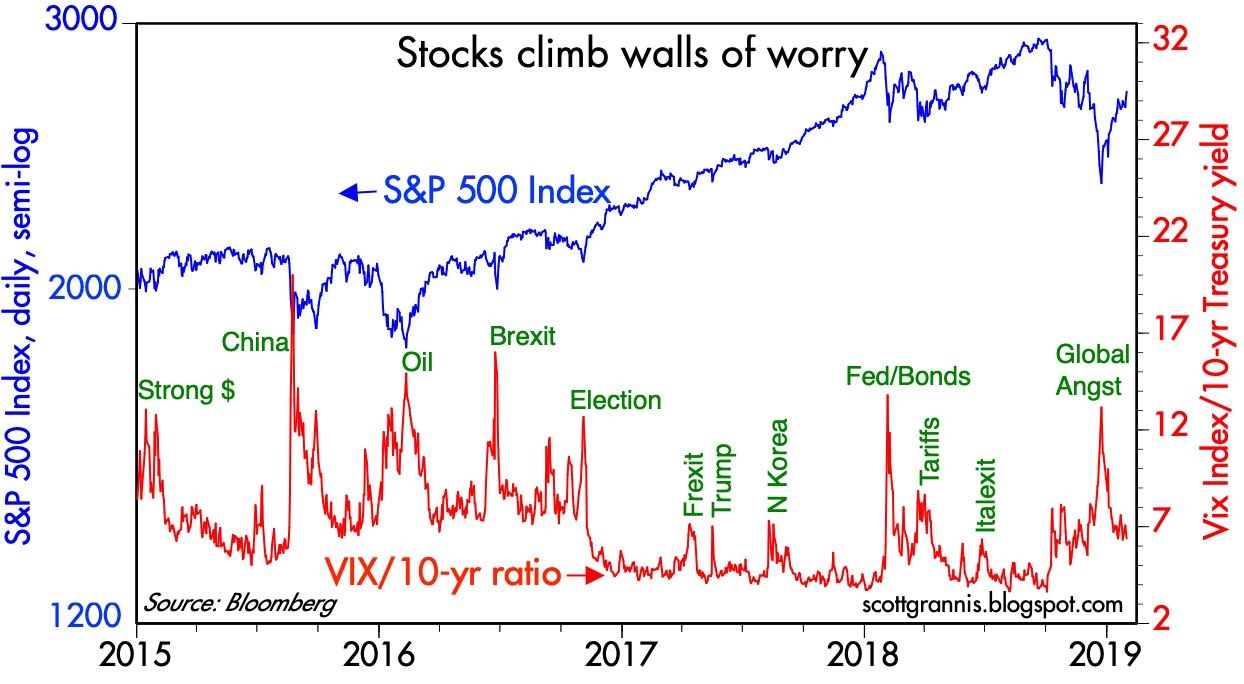
Source: Calafia Beach Pundit
As the chart above shows, over the last four years, spikes in fear (red line) have represented beneficial buying opportunities of stocks (blue line). The pace of gains in January is just as unsustainable as the pace of fourth-quarter losses were in stock prices. Uncertainties may remain on trade, shutdowns, geopolitics, and other issues but don’t throw away your investing dance shoes quite yet…the ball and music experienced last month could continue for a longer than expected period of time.
Wade W. Slome, CFA, CFP®
Plan. Invest. Prosper.
This article is an excerpt from a previously released Sidoxia Capital Management complimentary newsletter (February 1, 2018). Subscribe on the right side of the page for the complete text.
DISCLOSURE: Sidoxia Capital Management (SCM) and some of its clients hold positions and certain exchange traded funds (ETFs), but at the time of publishing had no direct position in any other security referenced in this article. No information accessed through the Investing Caffeine (IC) website constitutes investment, financial, legal, tax or other advice nor is to be relied on in making an investment or other decision. Please read disclosure language on IC Contact page.
The Rollercoaster December to Remember

Last month turned out to be a memorable one for stock market investors, but unforgettable for many of the wrong reasons. Santa Claus left more dark coal than shiny gifts, judging by the -9.2% correction last month in the S&P 500 index, making it the worst December since 1931. Overall, the damage for the year was much more palatable, down -6.2% for the 12-month period. This result contrasts with the +9.5% gain in 2016, +19.4% gain in 2018, and +276.0% gain achieved since the March 2009-low.
If I were to compare 2017 and 2018 to an amusement park, 2017 was more like a calm train ride (slow, smooth, and steady), while 2018 was more like a rollercoaster (fast, and rocky with lots of ups and downs). Stock market history tells us that on average stock prices should fall -5% three times per year and -10% one-time per year. Well, 2017 was like a walk in the park if you consider there were no -5% or -10% dips during the year, whereas in 2018, we had -12% and -20% corrections, before bouncing somewhat during the last week of the year. Rollercoaster rides can be fun, but if the bumpy ride lasts too long, park visitors will likely need a sick sack.
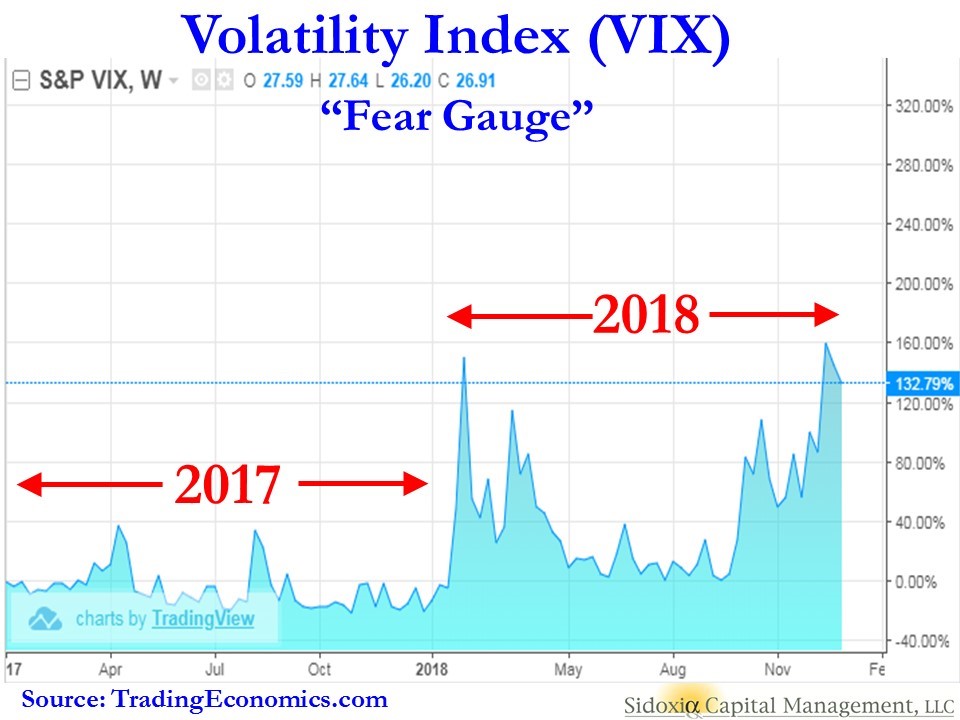
The heightened level of volatility can be seen in the Fear Gauge or the Volatility Index – VIX (see chart above), which has been bouncing around like a spiking cardiogram in response to the following news headlines:
- Government Shutdown
- Global Trade (China)
- Federal Reserve Interest Rate Policy
- Mueller Investigation
- New Balance of Power in Congress
- Brexit Deal Uncertainty
- Recession Fears
While there have been some signs of slowing growth in key areas like automobile and home sales, the overall economy has been doing quite well on the back of consumer spending, which accounts for upwards of 70% of our country’s economic activity (see GDP chart below). In fact, recently released Mastercard consumer retail holiday spending data grew +5.1% to a record level exceeding $850 billion.
Corporations, which are also helping propel continued growth in our $20 trillion economy, are producing record profits, as you can see from the chart below. This in turn has led to an amazingly low unemployment rate of 3.7%, the lowest jobless figure posted in 49 years.
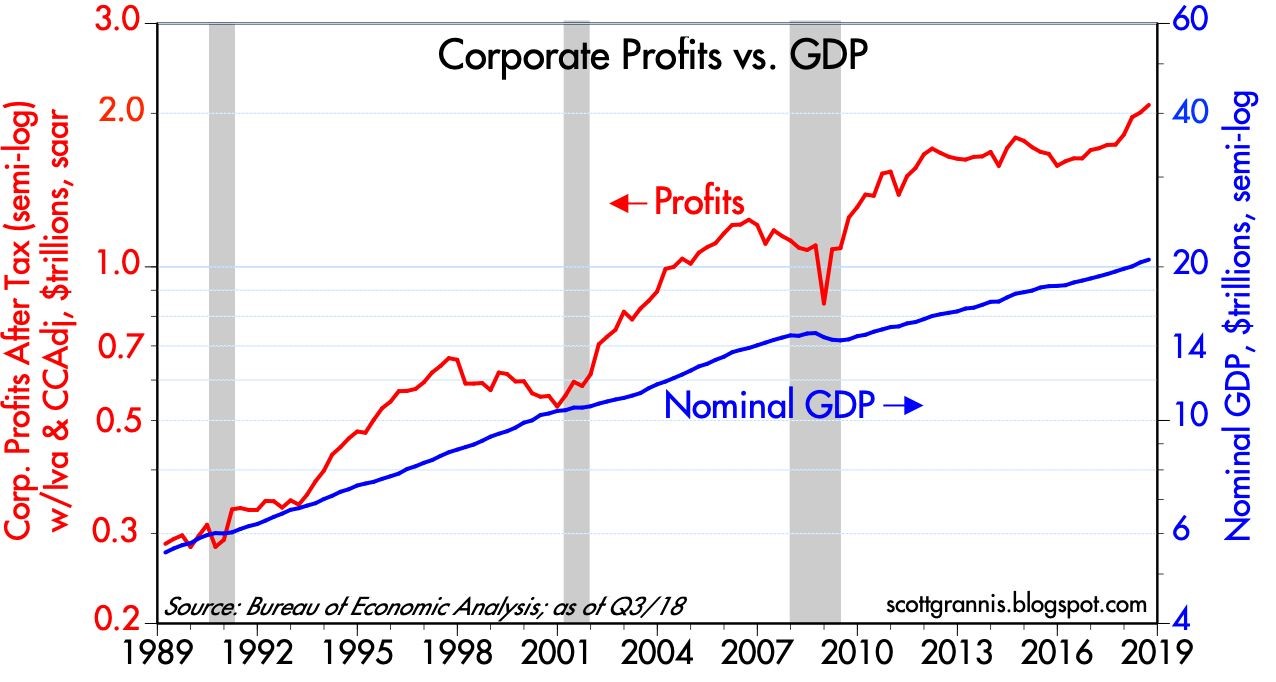
Source: Calafia Beach Pundit
Overall, economic fundamentals may remain strong, but in the face of the positive data points, fears of an impending recession overpowered the good news last month, resulting in stock prices that are much more attractively valued right now. For example, if you are shopping at a department store, it’s much more advantageous for the buyer to purchase items on sale versus paying full price. Or as the most successful investor of all-time, Warren Buffett, famously notes, “Be fearful when others are greedy and greedy only when others are fearful.” And recently, investors have been very fearful. As you can see from the chart below, prices as measured by the Price-Earnings ratio (P/E) are below the long-term, multi-decade average. This fact is even more relevant in light of the historically low inflation and interest rates (10-Year Treasury Note at 2.69%). Unsurprisingly, during the 1970s and early 1980s, double digit interest rates and inflation were relatively high leading to low, single digit P/E stock ratios over many years.
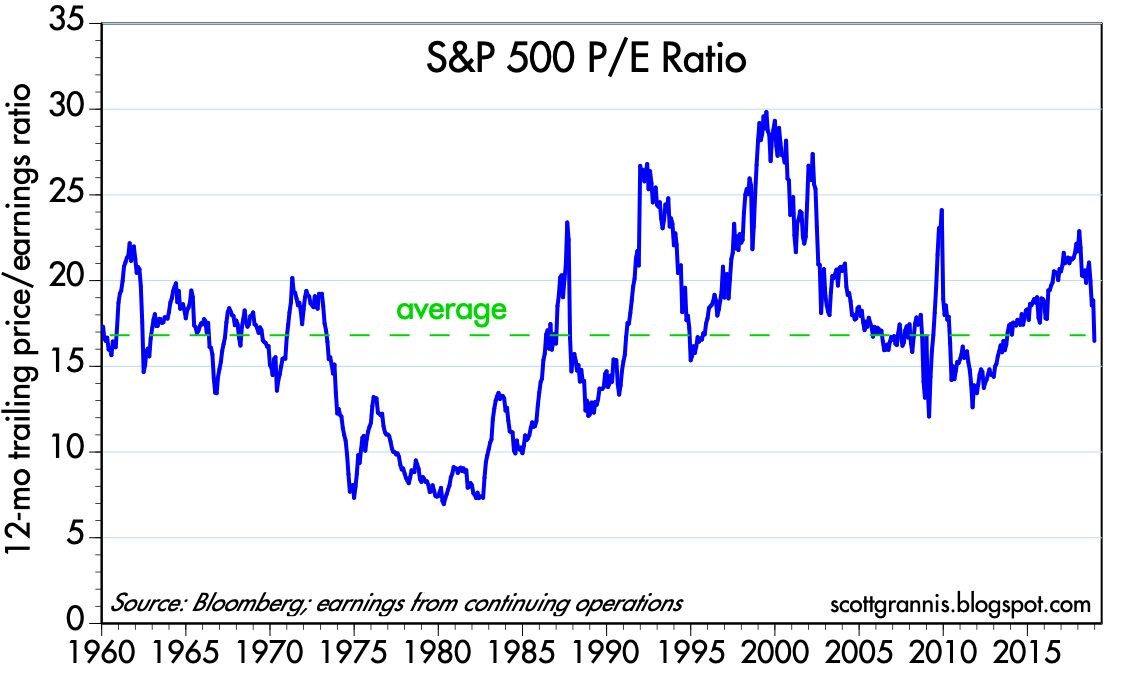
Source: Calafia Beach Pundit
Just because stock prices went down last month, does not mean they cannot go even lower. However, the rollercoaster ride experienced in recent months, coupled with the fresh turn of the calendar year, provide investors a perfect opportunity to revisit their asset allocation and potentially rebalance your portfolios to meet your long-term objectives and constraints. More attractive equity prices improves the timing of this exercise. Regardless, the adrenaline-filled ups and downs may be feel scary now, but the ride will be more enjoyable if you buckle up don’t lose sight of your long-term goals.
Wade W. Slome, CFA, CFP®
Plan. Invest. Prosper.
This article is an excerpt from a previously released Sidoxia Capital Management complimentary newsletter (January 4, 2018). Subscribe on the right side of the page for the complete text.
DISCLOSURE: Sidoxia Capital Management (SCM) and some of its clients hold positions and certain exchange traded funds (ETFs), but at the time of publishing had no direct position in any other security referenced in this article. No information accessed through the Investing Caffeine (IC) website constitutes investment, financial, legal, tax or other advice nor is to be relied on in making an investment or other decision. Please read disclosure language on IC Contact page.