Posts filed under ‘Stocks’
What Do You Worry About Next?

This article is an excerpt from a previously released Sidoxia Capital Management complimentary newsletter (November 1, 2016). Subscribe on the right side of the page for the complete text.
Boo! Halloween has just passed and frightened investors have still survived to tell the tale in 2016. While most people have gotten spooked by the presidential election, other factors like record-high corporate profits, record-low interest rates, and reasonable valuations have led to annual stock market gains. More specifically, values have risen in 2016 by approximately +4% (or +6% including dividend payments). Despite last week’s accelerating 3rd quarter GDP economic growth figure of +2.9%, which was the highest rate in two years and more than doubled the rate of the previous quarter (up +1.4%), there were still more tricks than treats during October. Recently, scary politics have shocked many Halloween participants into a zombie-like state, as evidenced by stock values declining around -1.7% during October.
This recent volatility is nothing new. Even though financial markets are significantly higher in recent years, that has not prevented repeated corrections over the year(s) as shown below in the 2009 – 2015 chart.

In order to earn higher long-term returns, investors have to accept a certain amount of short-term price movements (upwards and downwards). With a couple months remaining in the year, stock investors have achieved gains through a tremendous amount of economic and geopolitical uncertainty, including the following scares:
- China: A significant fallout from a Chinese slowdown at the beginning of the year (stocks fell about -14%).
- Brexit: A 48-hour Brexit vote scare in June (stocks fell -6%).
- Fed Fears: Threatening comments in September from the Federal Reserve about potentially hiking increasing interest rates (stocks fell -4%).
With the elections just a week away, political anxiety has jolted Americans’ adrenaline levels. The polls continue to move up and down, but as I have repeatedly pointed out, the only certain winner in Washington DC is gridlock. Sure, in a Utopian world, politicians should join hands and compromise to solve all our country’s serious problems. Unfortunately, this is not the case (see Congress’s approval rating). However, there is a silver lining to this dysfunction…gridlock can lead to fiscal discipline.
Our country’s debt/deficit financial situation has been spiraling out of control, in large measure due to rapidly rising entitlement spending, including Medicare, and Social Security. Witnessing all the political rhetoric and in-fighting is very difficult, but as I highlighted in last month’s newsletter, gridlock has flattened the spending curve significantly since 2009 – a positive development.
And although the economic recovery has been one of the slowest since World War II and global growth remains anemic, the U.S. remains a better house in a bad global neighborhood (e.g., Europe and Japan continue to suck wind), as evidenced by a number of these following positive economic indicators:

- Employment Improvement: Unemployment has fallen from 10% to 5% since 2009, and more than 15 million jobs have been added over that period.
- Housing Recovery Continues: Home sales and prices continue their multi-year rise; housing inventories remain tight; and affordability remains strong, given generationally low interest rates.
- Record Auto Sales: Car sales remain near record levels, hovering around 17 million units per year.
- Consumer Confidence on the Rise: Ever since the financial crisis, consumer sentiment figures have rebounded by about 50%.
-
Record Consumer Sales: Consumer spending accounts for approximately 70% of our economy, and as you can see from the chart below, despite consumers saving more, stronger employment and wages are fueling more spending.
 Source:Calculated Risk
Absent a clean sweep of control by the Democrat or Republican Presidential-Congressional candidates, our democratic system will retain its healthy status of checks and balances. Based on all the current polling data, a split between the White House, Senate, and House of Representatives remains a very high likelihood scenario.
The political process has been especially exhausting during the current cycle, but regardless of whether your candidate wins or loses, much of the current uncertainty will likely dissipate. As the saying goes, at least it is “Better the devil you know than the devil you don’t know.”
After the November 8th elections are completed, there will be one less election to worry about. Thankfully, after 25 years in the industry, I’m not naïve enough to believe there will be nothing else to worry about. When the financial media and blogosphere get bored, at a minimum, you can guarantee yourself plenty of useless coverage regarding the next monetary policy move by the Federal Reserve (see also Fed Fatigue).
Whatever the next set of worries become, U.K. Prime Minister Winston Churchill said it best as it relates to American politics and economics, “You can always count on Americans to do the right thing – after they’ve tried everything else.” If Churchill’s words don’t provide comfort and you had fun getting spooked over the elections on Halloween, feel free to keep wearing your costume. Behind any constructive economic data, the prolific media machine will continue doing their best in manufacturing plenty of fear, uncertainty, and doubt to keep you worried.

Wade W. Slome, CFA, CFP®
Plan. Invest. Prosper.
DISCLOSURE: Sidoxia Capital Management (SCM) and some of its clients hold positions in certain exchange traded funds (ETFs), but at the time of publishing had no direct position in any other security referenced in this article. No information accessed through the Investing Caffeine (IC) website constitutes investment, financial, legal, tax or other advice nor is to be relied on in making an investment or other decision. Please read disclosure language on IC Contact page.
Fall is Here: Change is Near

This article is an excerpt from a previously released Sidoxia Capital Management complimentary newsletter (October 1, 2016). Subscribe on the right side of the page for the complete text.
Although the fall season is here and the leaf colors are changing, there are a number of other transforming dynamics occurring this economic season as well. The S&P 500 index may not have changed much this past month (down -0.1%), but the technology-laden NASDAQ index catapulted higher (+1.9% for the month and +6.0% for 2016).
With three quarters of the year now behind us, beyond experiencing a shift in seasonal weather, a number of other changes are also coming. For starters, there’s no ignoring the elephant in the room, and that is the presidential election, which is only weeks away from determining our country’s new Commander in Chief. Besides religion, there are very few topics more emotionally charged than politics – whether you are a Republican, Democrat, Independent, Libertarian, or some combination thereof. Even though the first presidential debate is behind us, a majority of voters are already set on their candidate choice. In other words, open-minded debate on this topic can be challenging.
Hearing critical comments regarding your favorite candidate are often interpreted in the same manner as receiving critical comments about a personal family member – people often become defensive. The good news, despite the massive political divide currently occurring in the country and near-record low politician approval ratings in Congress , politics mean almost nothing when it comes to your money and retirement (see also Politics & Your Money). Regardless of what politicians might accomplish (not much), individuals actually have much more control over their personal financial future than politicians.
While inaction may rule the day currently, more action generally occurs during a crisis – we witnessed this firsthand during the 2008-2009 financial meltdown. As Winston Churchill famously stated,
“You can always count on Americans to do the right thing – after they’ve tried everything else.”
Political discourse and gridlock are frustrating to almost everyone from a practical standpoint (i.e., “Why can’t these idiots get something done in Washington?!”), however from an economic standpoint, gridlock is good (see also Who Said Gridlock is Bad?) because it can keep a responsible lid on frivolous spending. Educated individuals can debate about the proper priorities of government spending, but most voters agree, maintaining a sensible level of spending and debt should be a bipartisan issue.
From roughly 2009 – 2014, you can see how political gridlock has led to a massive narrowing in our government’s deficit levels (chart below) – back to more historical levels.This occurred just as rising frustration with Washington has been on the rise.

The Fed: Rate Revolution or Evolution?
Besides the changing season of politics, the other major area of change is Federal Reserve monetary policy. Even though the Fed has only increased interest rates once over the last 10 years, and interest rates are at near-generational lows, investors remain fearful. There is bound to be some short-term volatility if interest rates rise to 0.50% – 0.75% in December, as currently expected. However, if the Fed continues at its current snail’s pace, it won’t be until 2032 before they complete their rate hike cycles.
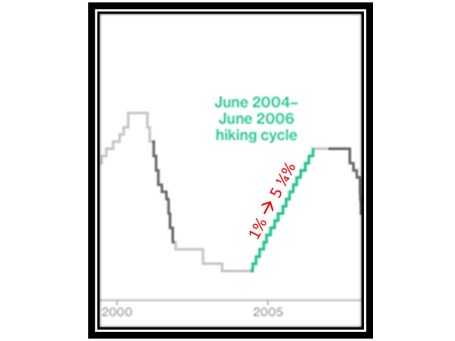
We can put the next rate increase into perspective by studying history. More specifically, the Fed raised interest rates 17 times from 2004 – 2006 (see chart below). Fortunately over this same time period, the world didn’t end as the Fed increased interest rates from 1.00% to 5.25% (stocks prices actually rose around +11%). The same can be said today – the world won’t likely end, if interest rates rise from 0.50% to 0.75% in a few months.
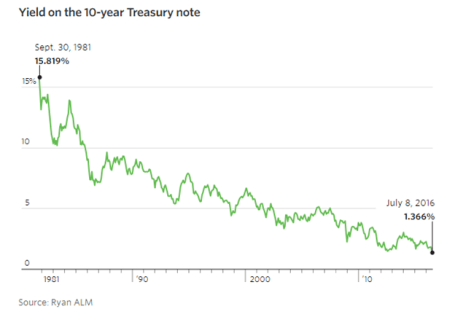
The next question becomes, why are interest rates so low? There are many reasons and theories, but a few of the key drivers behind low rates include, slower global economic growth, low inflation, high demand for low-risk assets, technology, and demographics. I could devote a whole article to each of these factors, and indeed in many cases I have, but suffice it to say that there are many reasons beyond the oversimplified explanation that artificial central bank intervention has led to a 35 year decline in interest rates (see chart below).
Change is a constant, and with fall arriving, some changes are more predictable than others. The timing of the U.S. presidential election outcome is very predictable but the same cannot be said for the timing of future interest rate increases. Irrespective of the coming changes and the related timing, history reminds us that concerns over politics and interest rates often are overblown. Many individuals remain overly-pessimistic due to excessive, daily attention to gloomy and irrelevant news headlines. Thankfully, stock prices are paying attention to more important factors (see Don’t Be a Fool) and long-term investors are being rewarded with record high stock prices in recent weeks. That’s the type of change I love.
Wade W. Slome, CFA, CFP®
Plan. Invest. Prosper.
DISCLOSURE: Sidoxia Capital Management (SCM) and some of its clients hold positions in certain exchange traded funds (ETFs), but at the time of publishing had no direct position in any other security referenced in this article. No information accessed through the Investing Caffeine (IC) website constitutes investment, financial, legal, tax or other advice nor is to be relied on in making an investment or other decision. Please read disclosure language on IC Contact page.
Growth Stocks – Cheaper by the Day

Are you a value investor? If you said “yes,” how would you feel about buying an $18 stock with a P/E (Price/Earnings) ratio of greater than 100x and a Price/Sales ratio of 14x for a company that three years earlier was started in a garage? This may not sound like a value stock, but had you bought this stock at the initial public offering (IPO), it would have been a screaming bargain – priced at less than 1x P/E ratio, based on this year’s earnings estimates.
You may be surprised to know, this company with a meager $18 IPO share price is now worth $9,192 per share today (if you adjust for three stock splits)! Yes, that’s correct, a +50,900% return. If you are wondering to which stock I’m referring, I am talking about Amazon.com Inc. (AMZN). Incredibly, ever since Amazon went public in 1997, the CEO Jeff Bezos has managed to command the start-up e-commerce company from $31 million in revenues to $121 billion (with a “b”) on an annual basis in 2016 (a +389,000% increase).
Discovering the next IPO that turns into a $363 billion behemoth is easier said than done, and unfortunately these types of companies are a rare breed. Even if you are lucky enough to identify these diamonds-in-the-rough, early in their growth cycle, very few investors have the fortitude and discipline to continually own the stocks through the perpetual volatility (i.e., peaks and valleys).
The good news is, although you may be unable to find every unicorn out there, you can still apply the same principles and characteristics to any growth stock you invest in. In order to prudently achieve outsized returns, one must identify innovative market leaders that have gained some type of sustainable competitive advantage, which will serve as the profit and cash flow growth engine for the stock over the long-term.
If a company does not have a unique advantage over industry competitors, they will likely be unable to compound earnings growth – the key to becoming a big winner. Albert Einstein, Nobel Prize winner is credited with identifying compounding as the “eighth wonder of the world,” and without compounding there will be no gigantic results.
Amazon may be a rare breed, but there are plenty of other examples of so-called “expensive” stocks that get dismissed or fall through the cracks as they explode in value to the stratosphere. Consider Starbucks Corp. (SBUX), which at the time of its IPO in 1992 was priced at a very rich P/E of 52x. Sound expensive? Actually, this was a greatest offer in a generation. Adjusted for stock splits, the IPO shares were valued at $0.27 – in the most recent trading session Starbucks shares closed at $55.90, a +20,600% increase. Similar to Amazon, had you purchased Starbucks shares at the IPO price, you would have been paying less than a measly, eye-popping 1x P/E ratio based on 2016 earnings.
Alphabet Inc. (GOOGL), formerly Google Inc., is another case of growth stock appearing pricey on the outside, but really a value of a lifetime on the inside. The hype surrounding the Google IPO was so palpable in 2004, the stock priced at a relatively nose-bleed level of 60x P/E level, approximately. The unconventional auction bidding method to buy the initial shares made investors even more skeptical. Suffice it to say, the greater than +1,600% gain has once again shown that investors can reap handsome rewards, if they do thorough enough due diligence and ignore the illusory big ticket IPO prices.
What most investors fail to realize is that P/E ratios are temporary. By purchasing a growth stock, the numerator of the P/E ratio (price) becomes static or fixed. As earnings of a growth company expand, the stock becomes cheaper by the day. More specifically, the numerator of the P/E (price) is flat, while the denominator (earnings) grows, thereby making the P/E ratio smaller (cheaper). And as you can see from the few previous examples I have provided, if you are able to identify winners, and hold them long enough, you will eventually realize the initial hefty price tag at purchase will be considered almost free after all the earnings compounding.
Legendary growth investor Peter Lynch summed it up concisely when he noted, “People concentrate too much on the P, but the E really makes the difference.” Lynch goes on to highlight the importance of patience in growth investing because stocks often go down or move sideways for long periods of time before dramatic increases occur:
“My best stocks performed in the 3rd year, 4th year, 5th year, not in the 3rd week or 4th week.”
I’ve illustrated a few successful examples of meteoric growth stocks, but more importantly the misconception many investors place on the current P/E ratio. There still is no substitute for hard-nosed, detailed fundamental research for finding big growth winners, because true growth stocks bought and held for a long enough period, will become cheaper by the day. If you don’t have the time, discipline, or patience to execute this winning strategy, find and hire an experienced investment manager who understands these concepts.
Wade W. Slome, CFA, CFP®
Plan. Invest. Prosper.
DISCLOSURE: Sidoxia Capital Management (SCM) and some of its clients hold positions in certain exchange traded funds (ETFs), AMZN, and GOOGL, but at the time of publishing had no direct position in SBUX, or any other security referenced in this article. No information accessed through the Investing Caffeine (IC) website constitutes investment, financial, legal, tax or other advice nor is to be relied on in making an investment or other decision. Please read disclosure language on IC Contact page.
Stocks Winning Olympic Gold

This article is an excerpt from a previously released Sidoxia Capital Management complimentary newsletter (August 1, 2016). Subscribe on the right side of the page for the complete text.
The XXXI Olympics in Rio, Brazil begin this week, but stocks in 2016 have already won a gold medal for their stellar performance. The S&P 500 index has already triumphantly sprinted to new, all-time record highs this month. A significant portion of the gains came in July (+3.6%), but if you also account for the positive results achieved in the first six months of 2016, stocks have advanced +6.3% for the year. If you judge the 2%+ annualized dividend yield, the total investment return earns an even higher score, coming closer to +8% for the year-to-date period.
No wonder the U.S. is standing on the top of the economic podium compared to some of the other international financial markets, which have sucked wind during 2016:
- China Shanghai Index: -15.8%
- Japan Nikkei Index: -12.9%
- French Paris CAC Index: -4.3%
- German Dax Index: -3.8%
- Europe MSCI Index: -3.5%
- Hong Kong Heng Sang Index: -0.1%
While there are some other down-and-out financial markets that have rebounded significantly this year (e.g., Brazil +61% & Russia +23%), the performance of the U.S. stock market has been impressive in light of all the fear, uncertainty, and doubt blanketing the media airwaves. Consider the fact that the record-breaking performance of the U.S. stock market in July occurred in the face of these scary headlines:
- Brexit referendum (British exit from the European Union)
- Declining oil prices
- Declining global interest rates
- More than -$11,000,000,000,000.00 (yes trillions) in negative interest rate bonds
- Global terrorist attacks
- Coup attempt in Turkey
- And oh yeah, a contentious domestic presidential election
With so many competitors struggling, and the investment conditions so challenging, then how has the U.S. prospered with a gold medal performance in this cutthroat environment? For many individuals, the answer can be confusing. However, for Sidoxia’s followers and clients, the strong pillars for a continued bull market have been evident for some time (described again below).
Bull Market Pillars
Surprising to some observers, stocks do not read pessimistic newspaper headlines or listen to gloomy news stories. In the short-run, stock prices can get injured by emotional news-driven traders and speculators, but over the long-run, stocks and financial markets are drawn like a magnet to several all-important metrics. What crucial metrics am I referring to? As I’ve reiterated in the past, the key drivers for future stock price appreciation are corporate profits, interest rates, valuations (i.e., price levels), and sentiment indicators (see also Don’t Be a Fool).
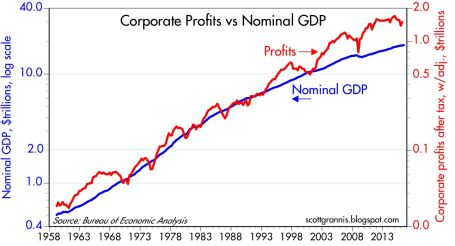
Stated more simply, money goes where it is treated best, and with many bonds and savings accounts earning negative or near 0% interest rates, investors are going elsewhere – for example, stocks. You can see from the chart below, economy/stocks are treated best by rising corporate profits, which are at/near record high levels. With the majority of stocks beating 2nd quarter earnings expectations, this shot of adrenaline has given the stock market an added near-term boost. A stabilizing U.S. dollar, better-than-expected banking results, and firming commodity prices have all contributed to the winning results.
Price Follows Earnings…and Recessions
What history shows us is stock prices follow the direction of earnings, which helps explain why stock prices generally go down during economic recessions. Weaker demand leads to weaker profits, and weaker profits lead to weaker stock prices. Fortunately for U.S. investors, there currently are no definitive signs of imminent recession clouds. Scott Grannis, the editor of Calafia Beach Pundit, sums up the relationship between recessions and the stock market here:
“Recessions typically follow periods of excesses—soaring home prices, rising inflation, widespread optimism—rather than periods dominated by risk aversion such as we have today. Risk aversion can still be found in abundance: just look at the extremely low level of Treasury yields, and the lack of business investment despite strong corporate profits.”
Similar to the Olympics, achieving success in investing can be very challenging, but if you want to win a medal, you must first compete. If you’re not investing, you’re not competing. And if you’re not investing, you have no chance of winning a financial gold medal. Just as in the Olympics, not everyone can win, and there are many ups and downs along the way to victory. Rather than focusing on the cheers and boos of the crowd, implementing a disciplined and diversified investment strategy that accounts for your time horizon, objectives, and risk tolerance is the championship approach that will increase your probability of landing on the Olympic medal podium.
Wade W. Slome, CFA, CFP®
Plan. Invest. Prosper.
DISCLOSURE: Sidoxia Capital Management (SCM) and some of its clients hold positions in certain exchange traded funds (ETFs), but at the time of publishing had no direct position in any other security referenced in this article. No information accessed through the Investing Caffeine (IC) website constitutes investment, financial, legal, tax or other advice nor is to be relied on in making an investment or other decision. Please read disclosure language on IC Contact page.
Technical Analysis – Astrology or Lob Wedge?

Investing comes in many shapes and sizes. And like religion (see Investing Religion article), most investment strategies are built on the essential belief that following certain rules and conventions will eventually lead to profit enlightenment. When it comes to technical analysis (TA), a discipline used with the principal aim of predicting future prices from past patterns, some consider it a necessity for making money in the market. Others, regard the practice of TA as a pseudoscience, much like astrology.
I feel there is a proper place for TA on selective basis, which I will describe later, but for the most part I agree with some of the legendary investors who have chimed in on the subject:
Warren Buffett: “I realized technical analysis didn’t work when I turned the charts upside down and didn’t get a different answer.”
Peter Lynch: “Charts are great for predicting the past.”
Technical Analysis Linguistics
Fundamental analysis, the antithesis of technical analysis, strives to predict future price direction by analyzing facts and data surrounding a company, industry, and/or economy. It too comes with its own syntax and versions, for example: value, growth, top-down, bottom-up, quantitative, etc.
I do not claim to be a TA expert, however in my many years of investing I have come across a smorgasbord of terms and flavors surrounding the discipline. Describing and explaining the density of material surrounding TA would encompass too large of a scope for this article, but here are some prevalent terms one should come to grips with if you want to become a technical analysis guru:
Technical Analysis Approaches
- Elliot Wave
- Relative strength / Momentum (see Momentum Investing article)
- MACD (Moving Average Convergence / Divergence)
- Fibonacci retracement
- Dow Theory
- Stochastics
- Bollinger bands
Price Patterns
- Head and shoulders
- Double bottom
- Cup and handle
- Channels
- Breakouts
- Pivot points
- Candlesticks
- Resistance/Support
- Dead cat bounce (my personal favorite)
Each of these patterns are supposes to provide insight into the future direction of price. At best, I would say the academic research surrounding the subject is “inconclusive,” and at worst I’d say it’s considered a complete “sham.”
The Lob Wedge

As I’ve stated earlier, I fall in the skeptical camp when it comes to TA, since fundamental analysis is the main engine I use for generating and tracking my investment ideas. For illustrative purposes, you may consider fundamental analysis as my group of drivers and irons. I do, however, utilize selective facets of TA much like I use a lob wedge in golf for a limited number of specific situations (e.g., shots over high trees, downhill lies, and fast greens). When it comes to trading, I do believe there is some value in tracking the relationship of extreme trading volume (high or low), especially when it is coupled with extreme price movement (high or low). The economic laws of supply and demand hold true for stock trades just as they do for guns and butter, and sharp moves in these components can provide insights into the psychological mindset of investors with respect to a security (or broader market). Beyond trading volume, there are a few other indicators that I utilize as part of my trading strategies, but these tactics play a relatively minor role, since most of my core positions are held on a multi-year time horizon.
Overall, there is a stream of wasteful noise, volatility, and misinformation that permeates the financial markets on a daily basis. A major problem with technical analysis is the many false triggered signals, which in many cases lead to excessive trading, transaction costs, and ultimately subpar investment returns. Although I remain a skeptic on the subject of technical analysis and I may not read my horoscope today, I will continue to keep a lob wedge in my golf bag with the hopes of finding new, creative ways of using it to my advantage.
Wade W. Slome, CFA, CFP®
Plan. Invest. Prosper.
DISCLOSURE: Sidoxia Capital Management (SCM) and some of its clients own exchange traded funds and various securities, including BRK.B, but at time of publishing had no direct position in BRK.A or any company mentioned in this article. No information accessed through the Investing Caffeine (IC) website constitutes investment, financial, legal, tax or other advice nor is to be relied on in making an investment or other decision. Please read disclosure language on IC “Contact” page.
EU Marriage Ends in Messy Brexit Divorce

This article is an excerpt from a previously released Sidoxia Capital Management complimentary newsletter (July 1, 2016). Subscribe on the right side of the page for the complete text.
What Just Happened?
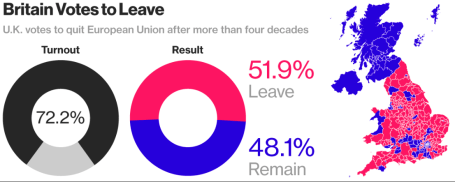
Breakups are never easy, especially when they come as a surprise. That’s exactly what happened with last week’s “Brexit” (British exit) referendum results. History was made when 51.9% of the United Kingdom (U.K.) voters from England, Scotland, Wales and Northern Ireland cast their vote to divorce (“Leave”) their country from the European Union (EU). In the end, the 48.1% of U.K. voters could not generate enough support to “Remain” in the EU (see chart below). Despite torrential downpours in southern Britain, voter turnout was extraordinarily high, as 72% of the 46.5 million registered voters came out in full force to have their voices heard.
Divorce is never cheap, and UK Prime Minister David Cameron paid the ultimate price with his defeat in the Brexit referendum…the loss of his job. Immediately following the release of the referendum results, Cameron, the British Prime Minister since 2010 and leader of the Conservative Party, immediately announced his resignation, effective no later than October 2016 after the selection of his successor.
Source: Bloomberg
One of the reasons behind the shock of the Brexit Leave decision is the longstanding relationship the U.K. has had with the EU. European Union membership first began in 1957 with Belgium, France, Germany, Italy, Luxembourg, and Netherlands being the founding countries of this new political-economic union.
A few decades later, the U.K. officially joined the EU in 1973 with Ireland and the Denmark, shortly before Margaret Thatcher came into power. If you fast forward to today, some 43 years after U.K. originally joined the EU, the Brexit decision represents the largest turning point in European political history. Not since the 1989 falling of the Berlin Wall and the subsequent demise of the Cold War in the Soviet Union has such a large, earth-moving political shift occurred.
Today, there are 28 member countries in the EU with Croatia being the newest member in 2013. Despite the Brexit outcome, there still is a backlog of countries wanting to join the EU club, including Turkey, Serbia, Albania, and Montenegro (and this excludes Scotland, which has voiced an interest in leaving the U.K. for the EU).
What Were Investors’ Reactions?
Financial markets around the world were caught off guard, given many pre-referendum polls were showing the Remain camp with a slight edge, along with British betting parlors that were handicapping an overwhelming victory for the Remain camp. Here’s a summary of stock market reactions around the globe from June 23rd to June 30th:
U.S. (S&P 500): -0.7%
U.K. (FTSE 100): +2.6%
Japan (Nikkei): -4.1%
Germany (DAX): -5.6%
Hong Kong (Hang Seng): +0.4%
China (Shanghai): +1.3%
India (BSE): -0.0%
Surprisingly, modest monthly gains achieved in the S&P 500 prior to the Brexit vote (up +0.8%) were quickly pared after the results came in but remained positive for the entire month (up +0.1%). For the year, U.S. stocks are up a limited +2.7%, which isn’t too bad considering investors’ current mood.
Stocks were not the only financial market disrupted after the Brexit announcement, foreign exchange currency rates were unstable as well. The British pound dived to a 30-year low shortly after the vote to a level of approximately $1.33/£, and was down more than -10% on the day of the announcement (see chart below). UK banks like Barclays PLC (BCS) and Lloyds Banking Group PLC (LYG) also saw their share prices significantly pressured as EU regulatory risks of losing access to European customers and negative global interest rates further squeeze the banks’ profit margins.
To put the currency picture into perspective, the value of the British pound ($2.64/£) peaked in March 1972 at a rate about double the U.S. dollar today. On the positive side of the ledger, a weaker British pound could help boost exports and vacation time to Stonehenge or London, but there is also a risk for a spike of inflation (or stagflation) on the country’s roughly $740 billion in imports (e.g., food, energy, and raw materials).
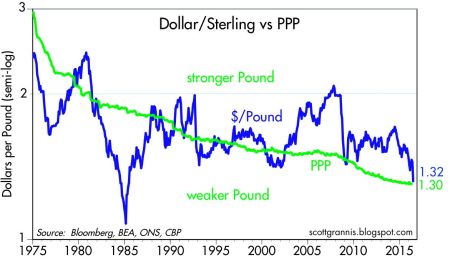
Source: Calafia Beach Pundit
Why Did it Happen?
While economically prosperous regions like London and Scotland voted heavily for Remain, the message for change of the Leave camp resonated well with working class towns and rural areas of England (seen here). Besides a geographic split, there was also a demographic divide between voters. As you can see from the YouGov poll below, the majority of younger citizens overwhelmingly voted for Remain, and vice versa for older citizens as it relates to the Leave vote.
18-24: 75% Remain
25-49: 56% Remain
50-64: 44% Remain
65+: 39% Remain
While geography and demographics certainly played a key role in the outcome of the EU Leave referendum result, at the core of the movement also was a populist discontent with immigration and the negative economic consequences created by globalization. There are many reasons behind the sluggish economic global recovery, even if the U.S. is doing best out of the developed countries, but rightly or wrongly, immigration policies and protectionism played a prominent part in the Brexit.
At the heart of the populist sentiment of lost control to Brussels (EU) and immigration is the question of whether the benefits of globalization have outweighed the costs. The spread of globalization and expanded EU immigration has disenfranchised many lower skill level workers displaced by eastern European immigrants, Syrian refugees and innovative solutions like automated machinery, software, and electronic equipment. Economic history clearly shows the answer to the effectiveness of globalization is a resounding “yes”, but the post-financial crisis recovery has been disappointingly sluggish, so a component of the populist movement has felt an urgency to find a scapegoat. The benefits of globalization can be seen in the chart below, as evidenced by the increases in per capita GDP of the UK relative to Germany and France, after joining the EU in 1973. Many observers are quick to identify the visible consequences of globalization (i.e., lower-paying job losses), but fail to identify the invisible benefits (i.e., productivity, lower prices, investment in higher-paying job gains).
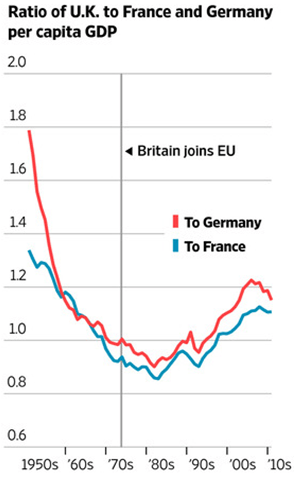
Source: The Wall Street Journal
What happens next?
While some EU leaders want to accelerate the Brexit transition, in actuality, this will require a long, drawn-out negotiation process between the still-unnamed new UK Prime Minister and EU officials. The complete EU-Brexit deal will take upwards of two-years to complete, once Article 50 of the EU Lisbon Treaty has been triggered – likely in October.
In light of the unchartered nature of the Brexit Leave vote, nobody truly knows if this decision will ultimately compromise the existential reality of the EU. Time will tell whether Brexit will merely be a small bump on the long EU road, or the beginning of a scary European domino effect that causes the 28 EU country bloc to topple. If the U.K. is successful in negotiating EU trade agreements with separate European countries, the Brexit even has a longer-term potential of benefiting economic activity. Regardless of the EU outcome, the long-term proliferation of capitalism and democracy is likely to prevail because citizens vote with their wallets and capital goes where it is treated best.
What does Brexit Mean for Global Markets?
The short answer is not much economically, however there have been plenty of less substantial events that have roiled financial markets for relatively short periods of time. There are two basic questions to ask when looking at the economic impact of Brexit:
1) What is the Brexit impact on the U.S. economy?
If you objectively analyze the statistics, U.S. companies sold approximately $56 billion of goods to the U.K. last year (our #7 trading partner). Even if you believe in the unlikely scenario of a severe U.K. economic meltdown, the U.K. trade figure is a rounding error in the whole global economic scheme of things. More specifically, $56 billion in trade with the U.K. equates to about .003 of the United States’ $18+ trillion GDP (Gross Domestic Product).
2) What is the Brexit impact on the global economy?
The U.K.’s GDP amounts to about $3 trillion dollars. Of that total, U.K. exports to the EU account for a reasonably insignificant $300 billion. As you can see from the chart below, $300 billion in UK exports to the EU are virtually meaningless and coincidentally equate to about .003 of the world’s $78 trillion estimated GDP.
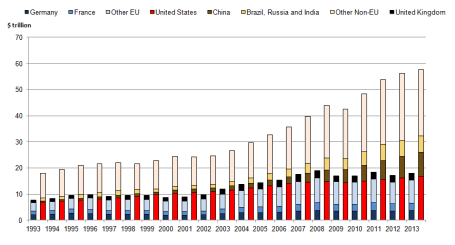
Source: The National Archives
What to Do Next?
Like many divorces, the U.K. Brexit may be messy and drawn out, until all the details are finalized over the next couple years. It’s important that you establish a strong foundation with your investments and do not divorce the sound, fundamental principles needed to grow and preserve your portfolio. As is usually the case, panicking or making an emotional decision relating to your investments during the heat of some geopolitical crisis rarely translates into an optimal decision over the long-run. As I repeatedly have advised over the years, these periods of volatility are nothing new (see also Series of Unfortunate Events).
If you catch your anxiety or blood pressure rising, do yourself a favor and turn off your TV, radio, or electronic device. A more productive use of time is to calmly review your asset allocation and follow a financial plan, with or without the assistance of a financial professional, so that you are able to achieve your long-term financial goals. This strategy will help you establish a more durable, long-lasting, and successful marriage with your investments.
Wade W. Slome, CFA, CFP®
Plan. Invest. Prosper.
DISCLOSURE: Sidoxia Capital Management (SCM) and some of its clients hold positions in certain exchange traded funds (ETFs), but at the time of publishing had no direct position in any other security referenced in this article. No information accessed through the Investing Caffeine (IC) website constitutes investment, financial, legal, tax or other advice nor is to be relied on in making an investment or other decision. Please read disclosure language on IC Contact page.
Rise of the Robots

We’re losing our jobs to robots, and they will destroy our economy. It makes for a great news soundbite, but has no factual basis in reality, if you look at the actual trajectory of automation and technology innovations throughout history. The global economy did not collapse when the steam engine replaced the oar; the automobile supplanted the horse; the computer became a substitute for the abacus; and the combine killed off the farmer. The same notion holds true today as robots become more ubiquitous in our daily commercial and personal lives.
From the early, post-revolutionary birth of our country in the 18th century, the agrarian economy accounted for upwards of 90% of jobs and financial activity…until farming technology evolved (see chart below). As new agricultural advancements were introduced, like the cotton gin, plow, scythe, chemical fertilizers, tractors, combine harvesters, and genetically engineered seeds, human capital (jobs) were redeployed into other growth sectors of the economy (e.g., factories, aerospace, semiconductors, medicine, etc.).

Source: Carpe Diem
Given that human labor accounts for about 2/3 of an average company’s expense structure, it should come as no surprise that corporations are looking to reduce costs by introducing more robotics and automation into their processes. The advantages to robotics adoption are numerous and I describe many of the reasons in my article, Chainsaw Replaces Paul Bunyan:
A robot won’t ask for a raise; it always shows up on time; you don’t have to pay for its healthcare; it can work 24/7/365 days per year; it doesn’t belong to a union; dependable quality consistency is a given; it produces products near your customers; and it won’t sue for discrimination or sexual harassment.
At Sidoxia Capital Management we opportunistically identified this growing trend quite early as evidenced by our initial 2012 investment in KUKA AG (Ticker: KUKAF), a German manufacturer of industrial robots. KUKA has recently made headlines due to a bid received from Chinese home-appliance company (Midea Group: Ticker – 000333.SZ) that values the dominant German robotics leader at $5 billion. Despite KUKA’s +273% share price appreciation from the end of 2012, not many people have heard of the company. While KUKA may not have caught the attention of many U.S. investors, the company has captured a bevy of blue-chip global customers, including Daimler, Airbus Group, Volkswagen, Fiat, Boeing, and Tesla.
Rather than sitting on its hands, KUKA has done its part to develop a higher profile. In fact, President Barack Obama and German Chancellor Angela Merkel recently received a robotics demonstration from KUKA’s CEO Till Reuter at the world’s largest industrial technology trade fair in Hannover, Germany this April (picture below)
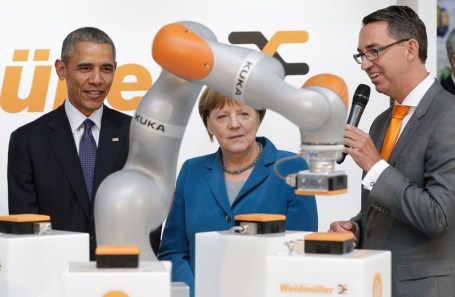
Source: Bloomberg
The recent multi-billion dollar bid by Midea Group has turned some onlookers’ heads, but what the potential deal really signals is the vast opportunity for robotics expansion in Asia. Rising labor costs in China, coupled with the enormous efficiency benefits of automation, have pushed China to become the largest purchasing country of robots in the world, ahead of the U.S., Japan, Korea and Germany (see chart below). However, according to the International Federation of Robotics (IFR), in 2015, Japan remained the country with the largest number of installed robots. IFR does not expect Japan to remain the “king” of the installed robotics hill forever. Actually, IFR estimates China will leapfrog Japan over the next few years to become both the largest purchaser of robots, along with maintaining the largest installed base of robots.
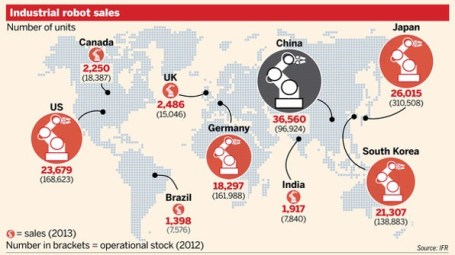
Source: Financial Times
In the coming months and years, there will be a steady stream of sensationalist headlines talking about the rise of the robots, and the destruction of jobs. We’ve repeatedly seen this movie before throughout history. Rather than a scary bloodbath ending, over the long-run we’ll likely see another happy ending. Any potential job losses will likely be outweighed by productivity gains, coupled with the benefits associated with more efficiently deployed labor to new growth sectors of the economy.
Even KUKA realizes the automation dynamics of the 21st century will serve as a net labor enhancer not detractor. If you don’t believe me, just ask Timo Boll, world champion table tennis player, who tested this theory vs. a KUKA robot (see video below). Ultimately, the rise of robots will lead to the rise of global growth and productivity.
Wade W. Slome, CFA, CFP®
Plan. Invest. Prosper.
DISCLOSURE: Sidoxia Capital Management (SCM) and some of its clients hold positions in certain exchange traded funds (ETFs), KUKAF, BA, and TSLA, but at the time of publishing had no direct position in Daimler, Airbus Group, Volkswagen, Fiat Chrysler, or any other security referenced in this article. No information accessed through the Investing Caffeine (IC) website constitutes investment, financial, legal, tax or other advice nor is to be relied on in making an investment or other decision. Please read disclosure language on IC Contact page.
Cleaning Out Your Investment Fridge

This article is an excerpt from a previously released Sidoxia Capital Management complimentary newsletter (June 1, 2016). Subscribe on the right side of the page for the complete text.
Summer is quickly approaching, but it’s not too late to do some spring cleaning. This principle not only applies to your cluttered refrigerator with stale foods but also your investment portfolio with moldy investments. In both cases, you want to get rid of the spoiled goods. It’s never fun discovering a science experiment growing in your fridge.
Over the last three months, the stock market has been replenished after a rotten first two months of the year (S&P 500 index was down -5.5% January through February). The +1.5% increase in May added to a +6.6% and +0.3% increase in March and April (respectively), resulting in a three month total advance in stock prices of +8.5%. Not surprisingly, the advance in the stock market is mirroring the recovery we have seen in recent economic data.
After digesting a foul 1st quarter economic Gross Domestic Product (GDP) reading of only +0.8%, activity has been smelling better in the 2nd quarter. A recent wholesome +3.4% increase in April durable goods orders, among other data points, has caused the Atlanta Federal Reserve Bank to raise its 2nd quarter GDP estimate to a healthier +2.9% growth rate (from its prior +2.5% forecast).
Consumer spending, which accounts for roughly 70% of our country’s economic activity, has been on the rise as well. The improving employment picture (5.0% unemployment rate last month) means consumers are increasingly opening their wallets and purses. In addition to spending more on cars, clothing, movies, and vacations, consumers are also doling out a growing portion of their income on housing. Housing developers have cautiously kept a lid on expansion, which has translated into limited supply and higher home prices, as evidenced by the Case-Shiller indices charted below.
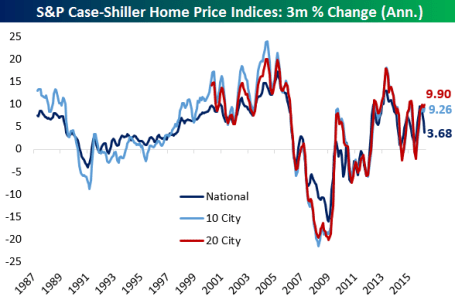
Source: Bespoke
Spoiling the Fun?
While the fridge may look like it’s fully stocked with fresh produce, meat, and dairy, it doesn’t take long for the strawberries to get moldy and the milk to sour. Investor moods can sour quickly too, especially as they fret over the impending “Brexit” (British Exit) referendum on June 23rd when British voters will decide whether they want to leave the European Union. A “yes” exit vote has the potential of roiling the financial markets and causing lots of upset stomachs.
Another financial area to monitor relates to the Federal Reserve’s monetary policy and its decision when to further increase the Federal Funds interest rate target at its June 14th – 15th meeting. With the target currently set at an almost insignificantly small level of 0.25% – 0.50%, it really should not matter whether Chair Janet Yellen decides to increase rates in June, July, September and/or November. Considering interest rates are at/near generational lows (see chart below), a ¼ point or ½ point percentage increase in short-term interest rates should have no meaningfully negative impact on the economy. If your fridge was at record freezing levels, increasing the temperature by a ¼ or ½ degree wouldn’t have a major effect either. If and when short-term interest rates increase by 2.0%, 3.0%, or 4.0% in a relatively short period will be the time to be concerned.
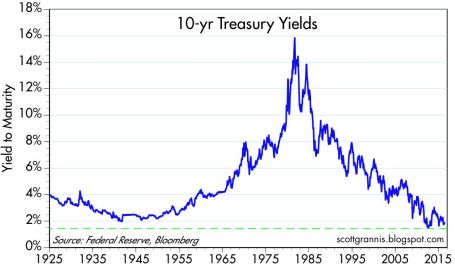
Source: Scott Grannis
Keep a Fresh Financial Plan
As mentioned earlier, your investments can get stale too. Excess cash sitting idly earning next-to-nothing in checking, savings, CDs, or in traditional low-yielding bonds is only going to spoil rapidly to inflation as your savings get eaten away. In the short-run, stock prices will move up and down based on frightening but insignificant headlines. However, in the long-run, the more important issues are determining how you are going to reach your retirement goals and whether you are going to outlive your savings. This mindset requires you to properly assess your time horizon, risk tolerance, income needs, tax situation, estate plan, and other unique circumstances. Like a balanced diet of various food groups in your refrigerator, your key personal financial planning factors are dependent upon you maintaining a properly diversified asset allocation that is periodically rebalanced to meet your long-term financial goals.
Whether you are managing your life savings, or your life-sustaining food supply, it’s always best to act now and not be a couch potato. The consequences of sitting idle and letting your investments spoil away are a lot worse than letting the food in your refrigerator rot away.
Wade W. Slome, CFA, CFP®
Plan. Invest. Prosper.
DISCLOSURE: Sidoxia Capital Management (SCM) and some of its clients hold positions in certain exchange traded funds (ETFs), but at the time of publishing had no direct position in any other security referenced in this article. No information accessed through the Investing Caffeine (IC) website constitutes investment, financial, legal, tax or other advice nor is to be relied on in making an investment or other decision. Please read disclosure language on IC Contact page.
Flat Pancakes & Dividends

Over the last 18 months, stock prices have been flat as a pancake. Absent a few brief China and recessionary scares, the Dow Jones Industrial Average index has spent most of 2015 and 2016 trading between the relatively tight levels of 17,000 – 18,000. Record corporate profits and faster growth than other developed and developing markets have created a tug-of-war with countervailing factors. A strong dollar, reversal in monetary policy, geopolitical turmoil, and volatile commodity markets have produced a neutralizing struggle among corporate executives with deep financial pockets and short arms. In this environment, share buybacks, stable profit margins, and growing dividends have taken precedence over accelerated capital investments and expensive new-hires.
With flat stock prices and interest rates at unprecedented low levels, it’s during times like these that stock investors really appreciate the appetizing flavor of stable, growing dividends. To this day, I still find it almost impossible to fathom how investors are burning money by irrationally speculating in $7 trillion in negative interest rate bonds (see Retire at Age 90).
Historically there are very few periods in which stock dividend yields have exceeded bond yields (2.1% S&P yield vs. 1.8% 10-Year Treasury yield). As I showed in my Dividend Floodgates article, for roughly 50 years (1960 – 2010), the yield on the 10-Year Treasury Notes have exceeded the dividend yield on stocks (S&P 500) – that longstanding trend does not hold today.
In the face of the competitive stock market, several trends are contributing to the upward trajectory in dividend payments (see chart below).
#1.) Corporate profits (ex-Energy) are growing and at/near record levels. Earnings are critical in providing fertile ground for dividend growth.
#2.) Demographics, plain and simple. As 76 million Baby Boomers transition into retirement, their income needs escalate. These shareholders whine and complain to corporate executives to share the spoils and increase dividends.
#3.) Low interest rates and disinflation are shrinking the available pool of income generating assets. As I pointed out above, when trillions of dollars are getting thrown into negative yielding investments, many investors are flocking to alternative income-generating assets…like dividend paying stocks.
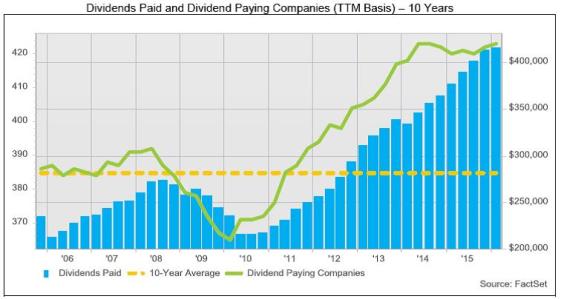
Source: FactSet
The Power of Dividends (Case Studies)
Most people don’t realize it, but over the last 100 years, dividends have accounted for approximately 40% of stocks’ total return as measured by the S&P 500. In other words, using history as a guide, if you initially invested in a stock XYZ at $100 that appreciated in value to $160 (+60%) 10 years later, that stock on average would have supplied an incremental $40 in dividends (40%) over that period, creating a total return of 100%.
Rather than using a hypothetical example, here are a few stock specific illustrations that highlight the amazing power of compounding dividend growth rates. Here are two “Dividend Aristocrats” (stocks that have increased dividends for at least 25 consecutive years):
- PepsiCo Inc (PEP): PepsiCo has increased its dividend for an astonishing 44 consecutive years. Today, the dividend yield is 2.9% based on the current share price. But had you purchased the stock in June 1972 for $1.60 per share (split-adjusted), you would currently be earning a +188% dividend yield ($3.01 dividend / $1.60 purchase price), which doesn’t even account for the +6,460% increase in the share price ($104.96 per share today from $1.60 in 1972). Over that 44 year period, the split-adjusted dividend has increased from about $0.02 per share to an annualized $3.01 dividend per share today, which equates to a mind-blowing +16,153% increase. On top of the $103 price appreciation, assuming a conservative 5% dividend reinvestment rate, my estimates show investors would have received more than $60 in reinvested dividends, making the total return that much more gargantuan.
- Emerson Electric Co (EMR): Emerson Electric too has had an even more incredible streak of dividend increases, which has now extended for 59 consecutive years. Emerson currently yields a respectable 3.6% rate, but if you purchased the stock in June 1972 for $3.73 per share (split-adjusted), you would currently be earning a +51% dividend yield ($1.92 dividend / $3.73 purchase price), which doesn’t even consider the +1,423% increase in the share price ($53.31 per share today from $3.73 in 1972).
There is never a shortage of FUD (Fear, Uncertainty, and Doubt), which has kept stock prices flat as a pancake over the last couple of years, but market leading franchise companies with stable/increasing dividends do not disappear during challenging times. Record profits (ex-energy), demographics, and a scarcity of income-generating investment alternatives are all contributing factors to the increased appetite for dividends. If you want to sweeten those flat pancakes, do yourself a favor and pour some quality dividend syrup over your investment portfolio.
Wade W. Slome, CFA, CFP®
Plan. Invest. Prosper.
DISCLOSURE: Sidoxia Capital Management (SCM) and some of its clients hold positions in certain exchange traded funds (ETFs) and PEP, but at the time of publishing had no direct position in EMR or any other security referenced in this article. No information accessed through the Investing Caffeine (IC) website constitutes investment, financial, legal, tax or other advice nor is to be relied on in making an investment or other decision. Please read disclosure language on IC Contact page.
The Traitorous 8 and Birth of Silicon Valley

Over my 25 year investment career, I’ve made quite a few technology investments and visited dozens of Silicon Valley companies. I heard bits and pieces about the story of the Traitorous 8, but I never fully comprehended the technology revolution they started. Out of intellectual curiosity, I decided to delve a little deeper into the topic.
At the heart of this topic is a small device about the size of a fingernail. This object has several different names and can be quite confusing. The official name is an integrated circuit or IC, but usually it’s referred to as a chip, microchip, or semiconductor. These chips have become ubiquitous, scattered invisibly throughout our daily lives in our cars, computers, TVs, cell phones, appliances, and remote controls (an average household is home to about 1,000 of these semiconductors). Despite most people taking the microchip for granted, this diminutive piece of silicon created from our beach’s sand has contributed the largest burst of wealth creation in human history.
Before gaining a true understanding into the birth of Silicon Valley, we have to better understand the historical context in which the global technology capital was created – this takes us back to the early twentieth century when the vacuum tube was invented in 1904. Before Al Gore invented the Internet, we needed computers, and before we had personal computers, we needed integrated circuits, and before we had integrated circuits we had vacuum tubes (see chart below). Vacuum tubes were the electronic circuitry components required to make telephones, radios and televisions work in the early 1900s.
Tech History & the Vacuum Tube

The vacuum tube was invented in 1904 by an English physicist named John Ambrose Fleming. Like semiconductors, the main function of a vacuum tube is to control the flow of electric current. More specifically, a vacuum tube controls the current transferred between cathode and anode to make a circuit. Vacuum tubes were used for amazing applications, but in modern society this technology has been largely replaced by semiconductors, primarily because of cost, scalability and reliability factors.
The first all-electronic digital computer title is usually awarded to the ENIAC computer, which stood for Electronic Numerical Integrator and Calculator. ENIAC was built at the University of Pennsylvania between 1943 and 1945 by two professors, John Mauchly and J. Presper Eckert. World War II, the Soviet Union Cold War, and the space race kicked off by the Sputnik launch all pushed the vacuum tube technology to its limits. To give you an idea of how costly and inefficient vacuum tubes were relative to today’s microchips consider some of the ENIAC statistics. ENIAC filled a 20 x 40 foot room; weighed 30 tons; used more than 18,000 vacuum tubes; and only operated 50% of the time because operators were continuously replacing burned out vacuum tubes. In fact, the ENIAC vacuum tubes generated so much heat, the temperature in the computer room often reached 120 degrees.
Shockley – The Godfather of the Transistor

Something had to change to improve vacuum tube technology, and it did…thanks in large part to a physicist named William Shockley, the so-called “Godfather of the Transistor.” Shockley received his Bachelor of Science degree from Caltech in 1932 and earned his Ph.D. degree from MIT in 1936. After graduation, Shockley left the famous Bell Labs research center, which was a research division of AT&T at the time (now owned by Nokia). As part of Shockley’s work at Bell Labs in the late 1940s, he contributed to the invention of the transistor with experimentalist Walter Brattain and quantum theorist John Bardeen. Fundamentally, the transistor is a switch, which over time has shrunk down to the size of a virus. The transistor is what ultimately replaced the vacuum tubes because it is smaller, more efficient, more reliable, more durable, and cheaper than vacuum tubes. Transistors switch and amplify the flow of electronic signals to create digital ones and zeros that instruct electronic applications. Without the benefits of shrinking transistors, today’s computer servers would be three stories high.
How small have transistors become? Take the iPhone 6 for example – it uses the A8 chip, which is made up of a whopping two billion transistors. To accomplish this feat, engineers are now creating transistors at the atomic level. Large semiconductor manufacturers like Intel Corp (INTC) are now developing transistors at the 10 nanometer level. To put this scale into perspective, consider a sheet of paper is approximately 100,000 nanometers thick. So in order to create a 10 nanometer sheet of paper, one would have to slice a single sheet 10,000 times thinner to reach 10 nanometers…mind-boggling.
Building atomic sized transistor technology is very cool, but also very expensive. Only a handful of semiconductor manufacturers have enough capital to build these new state-of-the art facilities. Case in point is Intel’s D1X fabrication facility in Hillsboro, Oregon, which is estimated to have cost $6 billion. Like seeing the pyramids – it’s difficult to understand the enormity of the structure without visiting it, which I was fortunate to do in 2014. It’s very ironic that in order to build these microscopic transistors and integrated circuits, multi-billion dollar manufacturing facilities the size of 38 football fields (~2.2 million square feet) are required. Another example of a next-generation manufacturing facility is Taiwan Semiconductor’s – Fab 15 (TSM), which was estimated to cost $9.3 billion.
These mega-transistor manufacturing facilities would not have been possible without Shockley’s contributions. Having helped invent the transistor largely replace the dominant computing technology of the last half century (i.e., vacuum tube), Shockley mustered up the courage to leave Bell Labs and start his own company, but he needed some cash to make it happen. He contacted Arnold Beckman, CEO of Beckman Coulter and his old professor at Caltech. Over a boat ride in Newport Beach, California, Shockley asked Beckman for $1 million to start his own lab. Silicon Valley potentially could have started in Southern California, but Shockley explained his aging mother lived in Palo Alto and convinced Beckman to start Shockley Semiconductor Laboratory in Mountain View, California during 1956.
After Shockley Semiconductor began operations, everything appeared to be going according to plan. Shortly after opening shop and recruiting the best and brightest engineers across the country, Shockley and his former Bell Labs colleagues Walter Brattain and John Bardeen were notified they all had won the Nobel Prize in physics (see photo below).

After the Nobel Prize celebrations, everything went downhill quickly. Shockley was known as a brilliant engineer but a horrific manager. He put his employees through a battery of tests including psychological tests, intelligence tests, and even lie detector tests. Shockley also posted employee salaries publicly and recorded phone calls. He was a paranoid individual who believed his workers were stealing trade secrets and sabotaging projects, so therefore he wouldn’t share findings with his research staff. Adding insult to injury, Shockley was a racist, who believed blacks were genetically inferior with subpar IQs, so they shouldn’t have kids.
Here is a video link summarizing William Shockley’s leadership:
The Traitorous 8 Surface
In 1957, the year after Shockley Semiconductor Labs started up, the division reached 30 employees. Eight of the employees, Sheldon Roberts, Eugene Kleiner, Victor Grinich, Jay Last, Julius Blank, Jean Hoerni, Robert Noyce, and Gordon Moore finally said, enough-is-enough and decided mutiny was their best option.

The disgruntled group ended up contacting a 30-year-old, snot-nosed, Harvard MBA graduate named Arthur Rock, the individual who eventually coined the phrase “venture capitalist.” In 1957, Rock was a New York banker working at Hayden Stone & Co. Rock believed the group of eight engineers (six of which had Ph.Ds) deserved attention, given their experience working with a Nobel Prize winner. The Traitorous 8 simply wanted to find an employer that would hire them as a group, but Rock advised them to start their own company – a novel idea during the 1950s.
After making a list and calling about 40 blue chip companies from the Wall Street Journal for funding, Rock almost gave up until they received a lead to contact Sherman Fairchild. Fairchild was a wealthy entrepreneur and playboy who hung out at the El Morocco in New York with Howard Hughes. Rock convinced Fairchild, the CEO of Fairchild Camera & Instrument, to invest $1.5 million into a Traitorous 8 startup.
The rest is history. The Traitorous 8 set up shop as Fairchild Semiconductor (FCS) in Mountain View, about twelve blocks from Shockley’s operations. Over the next 10 years, Fairchild Semiconductor grew from twelve employees to twelve thousand employees, and raked in some $130 million in annual revenues. Of the original Traitorous 8, two have become historical figures – Robert “Bob” Noyce and Gordon Moore. All good things come to an end, and Noyce and Moore increasingly got frustrated with Fairchild’s mismanagement of the semiconductor division.
After Fairchild passed over Noyce for a CEO promotion in 1968, Noyce told Moore, “I’m going to leave, are you interested?” Moore agreed, so he and Noyce contacted Arthur Rock again for his assistance. Rock quickly helped them raise $2.5 million, and Intel Corporation (short for “Integrated Electronics”) was born. Three years later in 1971, Intel launched its IPO at $23.50 per share ($.02 split-adjusted). An investment of $10,000 back then would be worth about $12,000,000 today –about a +120,000% return.
Here’s a video summarizing the creation of Intel:
Thomas Edison of Silicon Valley
Nowadays, Noyce is hailed by many as the “Thomas Edison of Silicon Valley.” Noyce received his Ph.D. from MIT and is most known for his invention of the integrated circuit. During the late 1950s, other engineers also worked on the IC, including Jack Kilby at Texas Instruments, but Noyce received the first patent in 1961. Unlike Kilby, who created his IC from germanium, Noyce created his IC from silicon, the semiconductor of choice still today. After a decade of litigation, Noyce and Kilby settled their differences and decided to cross-license their patents. Unfortunately, the Nobel Foundation doesn’t issue Nobel Prizes posthumously, so when the Nobel Prize was issued for the invention of the integrated circuit in the year 2000 (10 years after Noyce’s death), only Kilby was recognized. To Kilby’s credit, he acknowledged the contributions of Noyce and others in his Nobel speech with a story of a rabbit and beaver looking up at the Hoover Dam, “No, I didn’t build it myself. But it’s based on an idea of mine!”
Moore’s Law Established
Arguably, Moore was just as influential as Noyce, but due to his quiet leadership style, Moore is often overlooked. Moore was a year younger than Noyce and earned his chemistry degree from Berkeley and Ph.D. from Caltech. Unlike Noyce, who grew up in the Midwest (Iowa), Moore was raised near Palo Alto, which made recruiting Moore by William Shockley quite easy. Moore’s largest contribution is considered to “Moore’s Law,” which generally states the number of transistors (i.e., a chip’s computing power) will double every 1-2 years. During the 1980s, Noyce described the implications of Moore’s Law by comparing Moore’s Law to the airline industry. If the airline industry progressed at the trajectory of the semiconductor industry over the last 20 years, then the 767 airplane would cost $500 and travel around the world in 20 minutes on five gallons of gas. Regrettably, not many industries advance at the pace of semiconductors.
Moore came up with “Moore’s Law” when her wrote a seminal article for Electronics magazine in 1965 and in the article he properly predicted that the number of transistors that could be squeezed onto a microchip (around 60 at the time) would increase 1,000-fold to 60,000 transistors by 1975. It would take decades for his projections to come true, but Moore very presciently predicted the explosion of home computers, cell phones (which he called “portable communications equipment”), electronic wrist-watches, digital cars, and a host of other electronic devices and applications. A half century later, Moore’s Law holds true, but the pace of transistor growth admittedly is slowing. The physics behind semiconductor manufacturing is running into serious limitations of quantum mechanics, cost, and heat. Microchips are becoming so dense and fast that the internal components in many cases are melting the chips in research labs.
Here is a video link summarizing Moore’s Law:
While Moore’s Law is approaching diminishing returns, the costs of microchips keep declining, power keeps increasing, and efficiency keeps improving. Despite the slowing in Moore’s Law, as you can see below, the adoption of transistors via microchips is not plateauing. According to Intel, we are now consuming an estimated sextillion transistors!

Source: Intel Corporation
Politics, economics, terrorism, and social issues may dominate the daily headlines, but behind the scenes there are daily miracles occurring due to technology advancements. Driving much of that innovation is the microchip, and without the Traitorous 8, the world would look a lot different and there would be no Silicon Valley as we know it today. Had Robert Noyce and Gordon Moore miserably resigned themselves to remain at Shockley Semiconductor, perhaps mankind would not have achieved the giant strides in global standards of living (see chart below). Thankfully, their contributions live on today and ensure a bright future for our kids, grandchildren, and the world at large.

Source: FRED
Wade W. Slome, CFA, CFP®
Plan. Invest. Prosper.
DISCLOSURE: Sidoxia Capital Management (SCM) and some of its clients hold positions in certain exchange traded funds (ETFs) and in INTC (non-discretionary), TXN (non-discretionary), T (non-discretionary), but at the time of publishing had no direct position in TSM, NOK, FCS, or any other security referenced in this article. No information accessed through the Investing Caffeine (IC) website constitutes investment, financial, legal, tax or other advice nor is to be relied on in making an investment or other decision. Please read disclosure language on IC Contact page.


