Posts filed under ‘Financial Markets’
Half Trump Empty, or Half Trump Full?

This article is an excerpt from a previously released Sidoxia Capital Management complimentary newsletter (December 1, 2016). Subscribe on the right side of the page for the complete text.
It was a bitter U.S. presidential election, but fortunately, the nastiest election mudslinging has come to an end…at least until the next political contest. Unfortunately, like most elections, even after the president-elect has been selected, almost half the country remains divided and the challenges facing the president-elect have not disappeared.
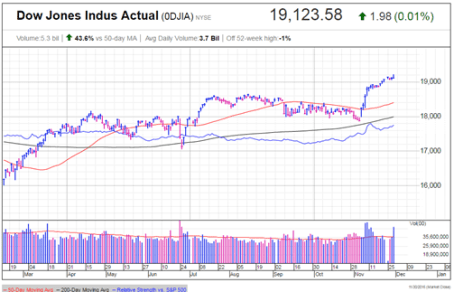
While some non-Trump voters have looked at the glass as half empty, since the national elections, the stock market glass has been overflowing to new record highs. Similar to the unforeseen British Brexit outcome in which virtually all pollsters and pundits got the results wrong, U.S. experts and investors also initially took a brief half-glass full view of the populist victory of Donald Trump. More specifically, for a few hours on Election Day, stock values tied to the Dow Jones Industrial Average index collapsed by approximately -5%.
It didn’t take long for stock prices to quickly reverse course, and when all was said and done, the Dow Jones Industrial Average finished the month higher by almost +1,000 points (+5.4%) to finish at 19,124 – a new all-time record high (see chart below). Worth noting, stocks have registered a very respectable +10% return during 2016, and the year still isn’t over.
Source: Investors.com (IBD)
Drinking the Trump Egg Nog
Why are investors so cheery? The proof will be in the pudding, but current optimism is stemming from a fairly broad list of anticipated pro-growth policies.
At the heart of the reform is the largest expected tax reform since Ronald Reagan’s landmark legislation three decades ago. Not only is Trump proposing stimulative tax cuts for corporations, but also individual tax reductions targeted at low-to-middle income taxpayers. Other facets of the tax plan include simplification of the tax code; removal of tax loopholes; and repatriation of foreign cash parked abroad. Combined, these measures are designed to increase profits, wages, investment spending, productivity, and jobs.
On the regulatory front, the President-elect has promised to repeal the Obamacare healthcare system and also overhaul the Dodd-Frank financial legislation. These initiatives, along with talk of dialing back other regulatory burdensome laws and agencies have many onlookers hopeful such policies could aid economic growth.
Fueling further optimism is the prospect of a trillion dollar infrastructure spending program created to fix our crumbling roads and bridges, while simultaneously increasing jobs.
No Free Lunch
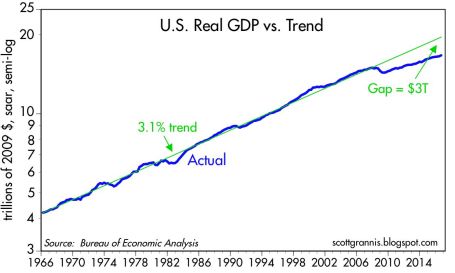
As is the case with any economic plan, there is never a free lunch. Every cost has a benefit, and every benefit has a cost. The cost of the 2008-2009 Financial crisis is reflected in the sluggish economic growth seen in the weak GDP (Gross Domestic Product) statistics, which have averaged a modest +1.6% growth rate over the last year. Scott Grannis points out how the slowest recovery since World War II has resulted in a $3 trillion economic gap (see chart below).
Source: Calafia Beach Pundit
The silver lining benefit to weak growth has been tame inflation and the lowest interest rate levels experienced in a generation. Notwithstanding the recent rate rise, this low rate phenomenon has spurred borrowing, and improved housing affordability. The sub-par inflation trends have also better preserved the spending power of American consumers on fixed incomes.
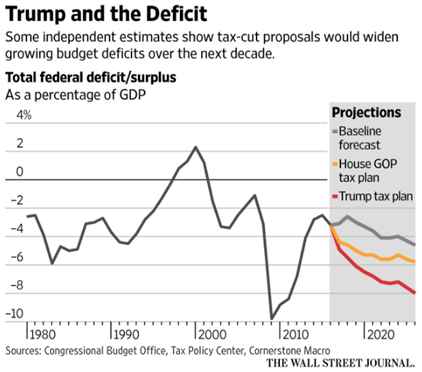
If executed properly, the benefits of pro-growth policies are obvious. Lower taxes should mean more money in the pockets of individuals and businesses to spend and invest on the economy. This in turn should create more jobs and growth. Regulatory reform and infrastructure spending should have similarly positive effects. However, there are some potential downside costs to the benefits of faster growth, including the following:
- Higher interest rates
- Rising inflation
- Stronger dollar
- Greater amount of debt
- Larger deficits (see chart below)
Source: The Wall Street Journal
Even though President-elect Trump has not even stepped foot into the Oval Office yet, signs are already emerging that we could face some or all of the previously mentioned headwinds. For example, just since the election, the yield on 10-Year Treasury Notes have spiked +0.5% to 2.37%, and 30-Year Fixed Rate mortgages are flirting with 4.0%. Social and economic issues relating to immigration legislation and Supreme Court nominations are likely to raise additional uncertainties in the coming months and years.
Attempting to anticipate and forecast pending changes makes perfect sense, but before you turn your whole investment portfolio upside down, it’s important to realize that actions speak louder than words. Even though Republicans have control over the three branches of government (Executive, Legislative, Judicial), the amount of control is narrow (i.e., the Senate), and the nature of control is splintered. In other words, Trump will still have to institute the “art of the deal” to persuade all factions of the Republicans (including establishment, Tea-Party, and rural) and Democrats to follow along and pass his pro-growth policies.
Although I do not agree with all of Trump’s policies, including his rhetoric on trade (see Free Trade Boogeyman), I will continue paying closer attention to his current actions rather than his past words. Until proven otherwise, I will keep on my rose colored glasses and remain optimistic that the Trump glass is half full, not half empty.

Wade W. Slome, CFA, CFP®
Plan. Invest. Prosper.
DISCLOSURE: Sidoxia Capital Management (SCM) and some of its clients hold positions in certain exchange traded funds (ETFs), but at the time of publishing had no direct position in any other security referenced in this article. No information accessed through the Investing Caffeine (IC) website constitutes investment, financial, legal, tax or other advice nor is to be relied on in making an investment or other decision. Please read disclosure language on IC Contact page.
Sleeping and Napping Through Bubbles

We have lived through many investment bubbles in our history, and unfortunately, most investors sleep through the early wealth-creating inflation stages. Typically, the average investor wakes up later to a hot idea once every man, woman, and child have identified the clear trend…right as the bubble is about burst. Sadly, the masses do a great job of identifying financial bubbles at the end of a cycle, but have a tougher time realizing the catastrophic consequences of exiting a tired winner. Or as strategist Jim Stack states, “Bubbles, for the most part, are invisible to those trapped inside the bubble.” The challenge of recognizing bubbles explains why they are more easily classified as bubbles after a colossal collapse occurs. For those speculators chasing a precise exit point on a bubblicious investment, they may be better served by waiting for the prick of the bubble, then take a decade long nap before revisiting the fallen angel investment idea.
Even for the minority of pundits and investors who are able to accurately identify these financial bubbles in advance, a much smaller number of these professionals are actually able to pinpoint when the bubble will burst. Take for example Alan Greenspan, the ex-Federal Reserve Chairman from 1987 to 2006. He managed to correctly identify the technology bubble in late-1996 when he delivered his infamous “irrational exuberance” speech, which questioned the high valuation of the frothy, tech-driven stock market. The only problem with Greenspan’s speech was his timing was massively off. Stated differently, Greenspan was three years premature in calling out the pricking of the bubble, as the NASDAQ index subsequently proceeded to more than triple from early 1997 to early 2000 (the index exploded from about 1,300 to over 5,000).
One of the reasons bubbles are so difficult to time during their later stages is because the deflation period occurs so quickly. As renowned value investor Howard Marks fittingly notes, “The air always goes out a lot faster than it went in.”
Bubbles, Bubbles, Everywhere
Financial bubbles do not occur every day, but thanks to the psychological forces of investor greed and fear, bubbles do occur more often than one might think. As a matter of fact, famed investor Jeremy Grantham claims to have identified 28 bubbles in various global markets since 1920. Definitions vary, but Webster’s Dictionary defines a financial bubble as the following:
A state of booming economic activity (as in a stock market) that often ends in a sudden collapse.
Although there is no numerical definition of what defines a bubble or collapse, the financial crisis of 2008 – 2009, which was fueled by a housing and real estate bubble, is the freshest example in most people minds. However, bubbles go back much further in time – here are a few memorable ones:
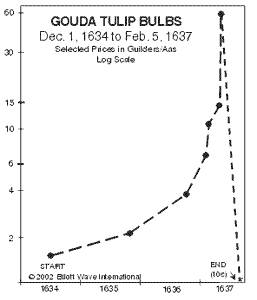
Dutch Tulip-Mania: Fear and greed have been ubiquitous since the dawn of mankind, and those emotions even translate over to the buying and selling of tulips. Believe it or not, some 400 years ago in the 1630s, individual Dutch tulip bulbs were selling for the same prices as homes ($61,700 on an inflation-adjusted basis). This bubble ended like all bubbles, as you can see from the chart below.
Source: The Stock Market Crash.net
British Railroad Mania: In the mid-1840s, hundreds of companies applied to build railways in Britain. Like all bubbles, speculators entered the arena, and the majority of companies went under or got gobbled up by larger railway companies.
Roaring 20s: Here in the U.S., the Roaring 1920s eventually led to the great Wall Street Crash of 1929, which finally led to a nearly -90% plunge in the Dow Jones Industrial stock index over a relatively short timeframe. Leverage and speculation were contributors to this bust, which resulted in the Great Depression.
Nifty Fifty: The so-called Nifty Fifty stocks were a concentrated set of glamor stocks or “Blue Chips” that investors and traders piled into. The group of stocks included household names like Avon (AVP), McDonald’s (MCD), Polaroid, Xerox (XRX), IBM and Disney (DIS). At the time, the Nifty Fifty were considered “one-decision” stocks that investors could buy and hold forever. Regrettably, numerous of these hefty priced stocks (many above a 50 P/E) came crashing down about 90% during the 1973-74 period.
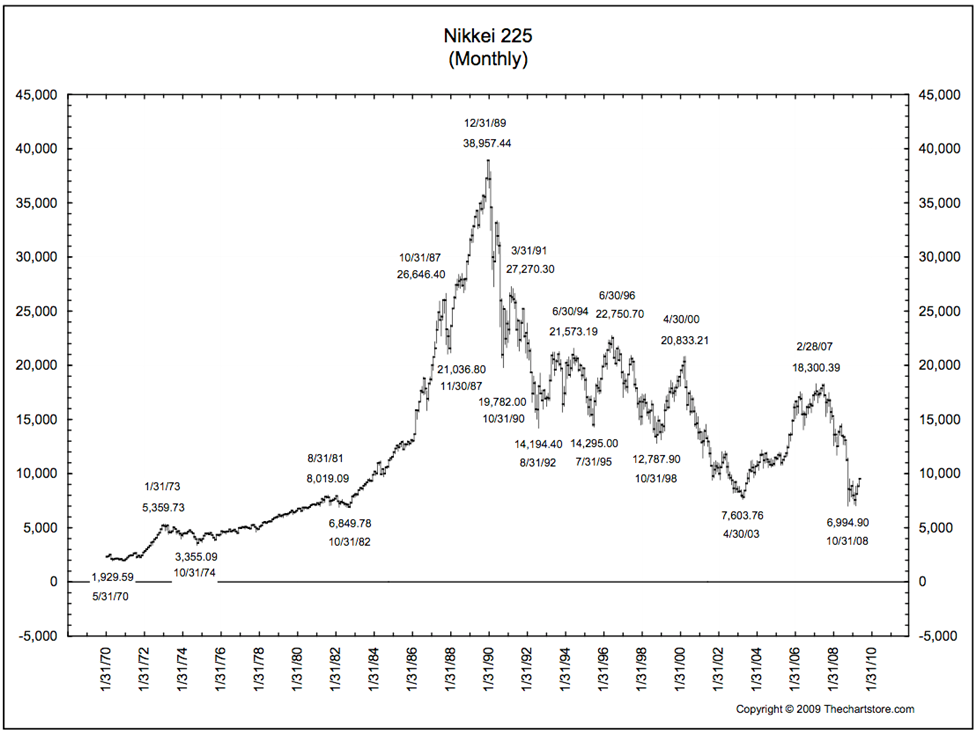
Japan’s Nikkei: The Japanese Nikkei 225 index traded at an eye popping Price-Earnings (P/E) ratio of about 60x right before the eventual collapse. The value of the Nikkei index increased over 450% in the eight years leading up to the peak in 1989 (from 6,850 in October 1982 to a peak of 38,957 in December 1989).
Source: Thechartstore.com
The Tech Bubble: We all know how the technology bubble of the late 1990s ended, and it wasn’t pretty. PE ratios above 100 for tech stocks was the norm (see table below), as compared to an overall PE of the S&P 500 index today of about 14x.

Source: Wall Street Journal – March 14, 2000
The Next Bubble
What is/are the next investment bubble(s)? Nobody knows for sure, but readers of Investing Caffeine know that long-term bonds are one fertile area. Given the generational low in yields and rates, and the 35-year bull run in bond prices, it can be difficult to justify heavy allocations of inflation losing bonds for long time-horizon investors. Commercial real estate and Silicon Valley unicorns could be other potential over-heated areas. However, as we discussed earlier, identifying and timing bubble bursts is extremely challenging. Nevertheless, the great thing about long-term investing is that probabilities and valuations ultimately do matter, and therefore a diversified portfolio skewed away from extreme valuations and speculative sectors will pay handsome dividends over the long-run.
Many traders continue to daydream as they chase performance through speculative investment bubbles, looking to squeeze the last ounce of an easily identifiable trend. As the lead investment manager at Sidoxia Capital Management, I spend less time sucking the last puff out of a cigarette, and spend more time opportunistically devoting resources to valuation-sensitive growth trends. As demonstrated with historical examples, following the popular trend du jour eventually leads to financial ruin and nightmares. Avoiding bubbles and pursuing fairly priced growth prospects is the way to achieve investment prosperity…and provide sweet dreams.
Wade W. Slome, CFA, CFP®
Plan. Invest. Prosper.
DISCLOSURE: Sidoxia Capital Management (SCM) and some of its clients hold positions in certain exchange traded funds (ETFs), MCD, DIS and are short TLT, but at the time of publishing SCM had no direct positions in AVP, XRX, IBM,or any other security referenced in this article. No information accessed through the Investing Caffeine (IC) website constitutes investment, financial, legal, tax or other advice nor is to be relied on in making an investment or other decision. Please read disclosure language on IC Contact page.
When Genius Failed
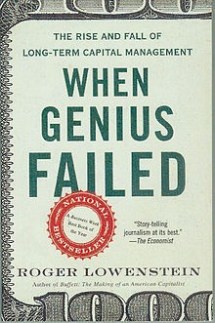
It has been a busy year between work, play, family, and of course the recent elections. My work responsibilities contain a wide-ranging number of facets, but in addition to research, client meetings, conference calls, conferences, trading, and other activities, I also attempt to squeeze in some leisure reading as well. While it’s sad but true that I find pleasure in reading SEC documents (10Ks and 10Qs), press releases, transcripts, corporate presentations, financial periodicals, and blogs, I finally did manage to also scratch When Genius Failed by Roger Lowenstein from my financial reading bucket list.
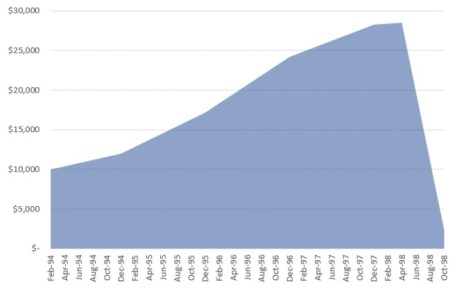
When Genius Failed chronicles the rise and fall of what was considered the best and largest global hedge fund, Long Term Capital Management (LTCM). The irony behind the collapse makes the story especially intriguing. Despite melding the brightest minds in finance, including two Nobel Prize winners, Robert Merton and Myron Scholes, the Greenwich, Connecticut hedge fund that started with $1.3 billion in early 1994 managed to peak at around $140 billion before eventually crumbling to ruin.
With the help of confidential internal memos, interviews with former partners and employees of LTCM, discussions with the Federal Reserve, and consultations with the six major banks involved in the rescue, Lowenstein provides the reader with a unique fly-on-the-wall perspective to this grand financial crisis.
There have certainly been plenty of well-written books recounting the 2008-2009 financial crisis (see my review on Too Big to Fail), but the sheer volume has burnt me out on the subject. With that in mind, I decided to go back in time to the period of 1993 – 1998, a point at the beginning of my professional career. Until LTCM’s walls began figuratively caving in and global markets declined by more than $1 trillion in value, LTCM was successful at maintaining a relatively low profile. The vast majority of Americans (99%) had never heard of the small group of bright individuals who started LTCM, until the fund’s ultimate collapse blanketed every newspaper headline and media outlet.
Key Characters
Meriwether: John W. Meriwether was a legendary trader at Salomon Brothers, where he started the Arbitrage Group in 1977 and built up a successful team during the 1980s. His illustrious career is profiled in Michael Lewis’s famed book, Liar’s Poker. Meriwether built his trading philosophy upon the idea that mispricings would eventually revert back to the mean or converge, and therefore shrewd opportunistic trading will result in gains, if patience is used. Another name for this strategy is called “arbitrage”. In sports terms, the traders of the LTCM fund were looking for inaccurate point spreads, which could then be exploited for profit opportunity. Prior to the launch of LTCM, in 1991 Meriwether was embroiled in the middle of a U.S. Treasury bid-rigging scheme when one of his traders Paul Mozer admitted to submitting false bids to gain unauthorized advantages in government-bond auctions. John Gutfreund, Salomon Brothers’ CEO was eventually forced to quit, and Salomon’s largest, famed shareholder Warren Buffett became interim CEO. Meriwether was slapped on the wrist with a suspension and fine, and although Buffett eventually took back Meriwether in a demoted role, ultimately the trader was viewed as tainted goods so he left to start LTCM in 1993.
LTCM Team: During 1993 Meriwether built his professional team at LTCM and he began this process by recruiting several key Salomon Brothers bond traders. Larry Hilibrand and Victor Haghani were two of the central players at the firm. Other important principals included Eric Rosenfeld, William Krasker, Greg Hawkins, Dick Leahy, Robert Shustak, James McEntee, and David W. Mullins Jr.
Nobel Prize Winners (Merton & Scholes): While Robert C. Merton was teaching at Harvard University and Myron S. Scholes at Stanford University, they decided to put their academic theory to the real-world test by instituting their financial equations with the other investing veterans at LTCM. Scholes and Merton were effectively godfathers of quantitative theory. If there ever were a Financial Engineering Hall of Fame, Merton and Scholes would be initial inductees. Author Lowenstein described the situation by saying, “Long-Term had the equivalent of Michael Jordan and Muhammad Ali on the same team.” Paradoxically, in 1997, right before the collapse of LTCM, Merton and Scholes would become Nobel Prize laureates in Economic Sciences for their work in developing the theory of how to price options.
The History:
Founded in 1993, Long-Term Management Capital was hailed as the most impressive hedge fund created in history. Near its peak, LTCM managed money for about 100 investors and employed 200 employees. LTCM’s primary strategy was to identify mispriced bonds and profit from a mean reversion strategy. In other words, as long as the overall security mispricings narrowed, rather than widened, then LTCM would stand to profit handsomely.
On an individual trade basis, profits from LTCM’s trades were relatively small, but the fund implemented thousands of trades and used vast amounts of leverage (borrowings) to expand the overall profits of the fund. Lowenstein ascribed the fund’s success to the following process:
“Leveraging its tiny margins like a high-volume grocer, sucking up nickel after nickel and multiplying the process a thousand times.”
Although LTCM implemented this strategy successfully in the early years of the fund, this premise finally collapsed like a house of falling cards in 1998. As is generally the case, hedge funds and other banking competitors came to understand and copy LTCM’s successful trading strategies. Towards the end of the fund’s life, Meriwether and the other fund partners were forced to experiment with less familiar strategies like merger arbitrage, pair trades, emerging markets, and equity investing. This diversification strategy was well intentioned, however by venturing into uncharted waters, the traders were taking on excessive risk (i.e., they were increasing the probability of permanent capital losses).
The Timeline
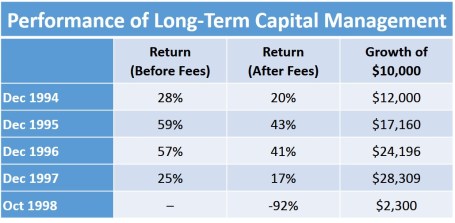
- 1994 (28% return, 20% after fees): After attempting to raise capital funding in 1993, LTCM opened its doors for business in February 1994 with $1.25 billion in equity. Financial markets were notably volatile during 1994 in part due to Federal Reserve Chairman Alan Greenspan leading the first interest rate hike in five years. The instability caused famed fund managers Michael Steinhardt and George Soros to lose -$800 million and $650 million, respectively, all within a timespan of less than a week. The so-called “Mexican Tequila Crisis” that occurred at the end of the year also resulted in a devaluation of the Mexican peso and crumbling of the Mexican stock market.
- 1995 (59% return, 43% after fees): By the end of 1995, the fund had tripled its equity capital and total assets had grown to $102 billion. Total leverage, or the ratio of debt to equity, stood around 28 to 1. LTCM’s derivative contract portfolio was like a powder keg, covering positions worth approximately $650 billion.
- 1996 (57% return, 41% after fees): By the spring of 1996, the fund was holding $140 billion in assets, making it two and a half times as big as Fidelity Magellan, the largest mutual fund on the planet. The fund also carried derivatives valued at more than $1 trillion, all financed off a relatively smaller $4 billion equity base. Investors were loving the returns and financial institutions were clamoring to gain some of LTCM’s business. During this period, as many as 55 banks were providing LTCM financing. The mega-returns earned in 1996 came in large part due to profitable leveraged spread trades on Japanese convertible bonds, Italian bonds, junk bonds, and interest rate swaps. Total profits for the year reached an extraordinary level of around $2.1 billion. To put that number in perspective, that figure was more money generated than the profits earned by McDonalds, Disney, American Express, Nike, Xerox, and many more Fortune 500 companies.
- 1997 (25% return, 17% after fees): The Asia Crisis came into full focus during October 1997. Thailand’s baht currency fell by -20% after the government decided to let the currency float freely. Currency weakness then spread to the Philippines, Malaysia, South Korea, and Singapore. As Russian bond spreads (prices) began to widen, massive trading losses for LTCM were beginning to compound. Returns remained positive for the year and the fund grew its equity capital to $5 billion. As the losses were mounting and the writing on the wall was revealing itself, professors Merton and Scholes were recognized with their Nobel Prize announcement. Ironically, LTCM was in the process of losing control. LTCM’s bloated number of 7,600 positions wasn’t making the fund any easier to manage. During 1997, the partners realized the fund’s foundation was shaky, so they returned $2.7 billion in capital to investors. Unfortunately, the risk profile of the fund worsened – not improved. More specifically, the fund’s leverage ratio skyrocketed from 18:1 to 28:1.
- 1998 (-92% return – loss): The Asian Crisis losses from the previous year began to bleed into added losses in 1998. In fact, losses during May and June alone ended up reducing LTCM’s capital by $461 million. As the losses racked up, LTCM was left in the unenviable position of unwinding a mind-boggling 60,000 individual positions. It goes almost without saying that selling is extraordinarily difficult during a panic. As Lowenstein put it, “Wall Street traders were running from Long-Term’s trades like rats from a sinking ship.” A few months later in September, LTCM’s capital shrunk to less than $1 billion, meaning about $100 billion in debt (leverage ratio greater than 100:1) was supporting the more than $100 billion in LTCM assets. It was just weeks later the fund collapsed abruptly. Russia defaulted on its ruble debt, and the collapsing currency contagion spread to global markets outside Russia, including Eastern Asia, and South America.
The End of LTCM
On September 23, 1998, after failed investment attempts by Warren Buffett and others to inject capital into LTCM, the heads of Bankers Trust, Bear Stearns, Chase Manhattan, Goldman Sachs, J.P. Morgan, Lehman Brothers, Merrill Lynch, Morgan Stanley Dean Witter, and Salomon Brothers all gathered at the Federal Reserve Bank of New York in the heart of Wall Street. Presiding over this historical get-together was Fed President, William J. McDonough. International markets were grinding to a halt during this period and the Fed was running out of time before an all-out meltdown was potentially about to occur. Ultimately, McDonough was able to get 14 banks to wire $3.65 billion in bailout funds to LTCM. While all LTCM partners were financially wiped out completely, initial investors managed to recoup a small portion of their original investment (23 cents on the dollar after factoring in fees), even though the tally of total losses reached approximately $4.6 billion. Once the bailout was complete, it took a few years for the fund to liquidate its gargantuan number of positions and for the banks to get their multi-billion dollar bailout paid back in full.
- 1999 – 2009 (Epilogue): Meriwether didn’t waste much time moping around after the LTCM collapse, so he started a new hedge fund, JWM Partners, with $250 million in seed capital primarily from legacy LTCM investors. Regrettably, the fund was hit with significant losses during the 2008-2009 Financial Crisis and was subsequently forced to close its doors in July 2009.
Source: The Personal Finance Engineer
Source: The Personal Finance Engineer
Lessons Learned:
- The Risks of Excessive Leverage: Although the fund grew to peak value of approximately $140 billion in assets, most of this growth was achieved with added debt. When all was said and done, LTCM borrowed more than 30 times the value of its equity. As Lowenstein put it, LTCM was “adding leverage to leverage, as if coating a flammable tinderbox with kerosene.” In home purchase terms, if LTCM wanted to buy a house using the same amount of debt as their fund, they would lose all of their investment, if the house value declined a mere 3-4%. The benefit of leverage is it multiplies gains. The downside to leverage is that it also multiplies losses. If you carry too much leverage in a declining market, the chance of bankruptcy rises…as the partners and investors of LTCM learned all too well. Adding fuel to the LTCM flames were the thousands of derivative contracts, valued at more than $1 trillion. Warren Buffett calls derivatives: “Weapons of Mass Destruction.”
- Past is Not Always Prologue for the Future: Just because a strategy works now or in the past, does not mean that same strategy will work in the future. As it relates to LTCM, Nobel Prize winning economist Merton Miller stated, “In a strict sense, there wasn’t any risk – if the world had behaved as it did in the past.” LTCM’s models worked for a while, then failed miserably. There is no Holy Grail investment strategy that works always. If an investment strategy sounds too good to be true, then it probably is too good to be true.
- Winning Strategies Eventually Get Competed Away: The spreads that LTCM looked to exploit became narrower over time. As the fund achieved significant excess returns, competitors copied the strategies. As spreads began to tighten even further, the only way LTCM could maintain their profits was by adding additional leverage (i.e., debt). High-frequency trading (HFT) is a modern example of this phenomenon, in which early players exploited a new technology-driven strategy, until copycats joined the fray to minimize the appeal by squeezing the pool of exploitable profits.
- Academics are Not Practitioners: Theory does not always translate into reality, and academics rarely perform as well as professional practitioners. Merton and Scholes figured this out the hard way. As Merton admitted after winning the Nobel Prize, “It’s a wrong perception to believe that you can eliminate risk just because you can measure it.”
- Size Matters: As new investors poured massive amounts of capital into the fund, the job of generating excess returns for LTCM managers became that much more difficult. I appreciate this lesson firsthand, given my professional experience in managing a $20 billion fund (see also Managing $20 Billion). Managing a massive fund is like maneuvering a supertanker – the larger a fund gets, the more difficult it becomes to react and anticipate market changes.
- Stick to Your Knitting: Because competitors caught onto their strategies, LTCM felt compelled to branch out. Meriwether and LTCM had an edge trading bonds but not in stocks. In the later innings of LTCM’s game, the firm became a big player in stocks. Not only did the firm place huge bets on merger arbitrage, but LTCM dabbled significantly in various long-short pair trades, including a $2.3 billion pair trade bet on Royal Dutch and Shell. Often the firm used derivative securities called equity swaps to make these trades without having to put up any significant capital. As LTCM experimented in the new world of equities, the firm was obviously playing in an area in which it had absolutely no expertise.
As philosopher George Santayana states, “Those who fail to learn from history are doomed to repeat it.” For those who take investing seriously, When Genius Failed is an important cautionary tale that provides many important lessons about financial markets and highlights the dangers of excessive leverage. You may not be a genius Nobel Prize winner in economics, but learning from Long-Term Capital Management’s failings will place you firmly on the path to becoming an investing genius.
Wade W. Slome, CFA, CFP®
Plan. Invest. Prosper.
DISCLOSURE: Sidoxia Capital Management (SCM) and some of its clients hold positions in certain exchange traded funds (ETFs), DIS, JPM, and MCD, but at the time of publishing had no direct position in AXP, NKE, XRX, RD, GS, MS, Shell, or any other security referenced in this article. No information accessed through the Investing Caffeine (IC) website constitutes investment, financial, legal, tax or other advice nor is to be relied on in making an investment or other decision. Please read disclosure language on IC Contact page
What Do You Worry About Next?

This article is an excerpt from a previously released Sidoxia Capital Management complimentary newsletter (November 1, 2016). Subscribe on the right side of the page for the complete text.
Boo! Halloween has just passed and frightened investors have still survived to tell the tale in 2016. While most people have gotten spooked by the presidential election, other factors like record-high corporate profits, record-low interest rates, and reasonable valuations have led to annual stock market gains. More specifically, values have risen in 2016 by approximately +4% (or +6% including dividend payments). Despite last week’s accelerating 3rd quarter GDP economic growth figure of +2.9%, which was the highest rate in two years and more than doubled the rate of the previous quarter (up +1.4%), there were still more tricks than treats during October. Recently, scary politics have shocked many Halloween participants into a zombie-like state, as evidenced by stock values declining around -1.7% during October.
This recent volatility is nothing new. Even though financial markets are significantly higher in recent years, that has not prevented repeated corrections over the year(s) as shown below in the 2009 – 2015 chart.

In order to earn higher long-term returns, investors have to accept a certain amount of short-term price movements (upwards and downwards). With a couple months remaining in the year, stock investors have achieved gains through a tremendous amount of economic and geopolitical uncertainty, including the following scares:
- China: A significant fallout from a Chinese slowdown at the beginning of the year (stocks fell about -14%).
- Brexit: A 48-hour Brexit vote scare in June (stocks fell -6%).
- Fed Fears: Threatening comments in September from the Federal Reserve about potentially hiking increasing interest rates (stocks fell -4%).
With the elections just a week away, political anxiety has jolted Americans’ adrenaline levels. The polls continue to move up and down, but as I have repeatedly pointed out, the only certain winner in Washington DC is gridlock. Sure, in a Utopian world, politicians should join hands and compromise to solve all our country’s serious problems. Unfortunately, this is not the case (see Congress’s approval rating). However, there is a silver lining to this dysfunction…gridlock can lead to fiscal discipline.
Our country’s debt/deficit financial situation has been spiraling out of control, in large measure due to rapidly rising entitlement spending, including Medicare, and Social Security. Witnessing all the political rhetoric and in-fighting is very difficult, but as I highlighted in last month’s newsletter, gridlock has flattened the spending curve significantly since 2009 – a positive development.
And although the economic recovery has been one of the slowest since World War II and global growth remains anemic, the U.S. remains a better house in a bad global neighborhood (e.g., Europe and Japan continue to suck wind), as evidenced by a number of these following positive economic indicators:

- Employment Improvement: Unemployment has fallen from 10% to 5% since 2009, and more than 15 million jobs have been added over that period.
- Housing Recovery Continues: Home sales and prices continue their multi-year rise; housing inventories remain tight; and affordability remains strong, given generationally low interest rates.
- Record Auto Sales: Car sales remain near record levels, hovering around 17 million units per year.
- Consumer Confidence on the Rise: Ever since the financial crisis, consumer sentiment figures have rebounded by about 50%.
-
Record Consumer Sales: Consumer spending accounts for approximately 70% of our economy, and as you can see from the chart below, despite consumers saving more, stronger employment and wages are fueling more spending.
 Source:Calculated Risk
Absent a clean sweep of control by the Democrat or Republican Presidential-Congressional candidates, our democratic system will retain its healthy status of checks and balances. Based on all the current polling data, a split between the White House, Senate, and House of Representatives remains a very high likelihood scenario.
The political process has been especially exhausting during the current cycle, but regardless of whether your candidate wins or loses, much of the current uncertainty will likely dissipate. As the saying goes, at least it is “Better the devil you know than the devil you don’t know.”
After the November 8th elections are completed, there will be one less election to worry about. Thankfully, after 25 years in the industry, I’m not naïve enough to believe there will be nothing else to worry about. When the financial media and blogosphere get bored, at a minimum, you can guarantee yourself plenty of useless coverage regarding the next monetary policy move by the Federal Reserve (see also Fed Fatigue).
Whatever the next set of worries become, U.K. Prime Minister Winston Churchill said it best as it relates to American politics and economics, “You can always count on Americans to do the right thing – after they’ve tried everything else.” If Churchill’s words don’t provide comfort and you had fun getting spooked over the elections on Halloween, feel free to keep wearing your costume. Behind any constructive economic data, the prolific media machine will continue doing their best in manufacturing plenty of fear, uncertainty, and doubt to keep you worried.
Wade W. Slome, CFA, CFP®
Plan. Invest. Prosper.
DISCLOSURE: Sidoxia Capital Management (SCM) and some of its clients hold positions in certain exchange traded funds (ETFs), but at the time of publishing had no direct position in any other security referenced in this article. No information accessed through the Investing Caffeine (IC) website constitutes investment, financial, legal, tax or other advice nor is to be relied on in making an investment or other decision. Please read disclosure language on IC Contact page.
Fall is Here: Change is Near

This article is an excerpt from a previously released Sidoxia Capital Management complimentary newsletter (October 1, 2016). Subscribe on the right side of the page for the complete text.
Although the fall season is here and the leaf colors are changing, there are a number of other transforming dynamics occurring this economic season as well. The S&P 500 index may not have changed much this past month (down -0.1%), but the technology-laden NASDAQ index catapulted higher (+1.9% for the month and +6.0% for 2016).
With three quarters of the year now behind us, beyond experiencing a shift in seasonal weather, a number of other changes are also coming. For starters, there’s no ignoring the elephant in the room, and that is the presidential election, which is only weeks away from determining our country’s new Commander in Chief. Besides religion, there are very few topics more emotionally charged than politics – whether you are a Republican, Democrat, Independent, Libertarian, or some combination thereof. Even though the first presidential debate is behind us, a majority of voters are already set on their candidate choice. In other words, open-minded debate on this topic can be challenging.
Hearing critical comments regarding your favorite candidate are often interpreted in the same manner as receiving critical comments about a personal family member – people often become defensive. The good news, despite the massive political divide currently occurring in the country and near-record low politician approval ratings in Congress , politics mean almost nothing when it comes to your money and retirement (see also Politics & Your Money). Regardless of what politicians might accomplish (not much), individuals actually have much more control over their personal financial future than politicians.
While inaction may rule the day currently, more action generally occurs during a crisis – we witnessed this firsthand during the 2008-2009 financial meltdown. As Winston Churchill famously stated,
“You can always count on Americans to do the right thing – after they’ve tried everything else.”
Political discourse and gridlock are frustrating to almost everyone from a practical standpoint (i.e., “Why can’t these idiots get something done in Washington?!”), however from an economic standpoint, gridlock is good (see also Who Said Gridlock is Bad?) because it can keep a responsible lid on frivolous spending. Educated individuals can debate about the proper priorities of government spending, but most voters agree, maintaining a sensible level of spending and debt should be a bipartisan issue.
From roughly 2009 – 2014, you can see how political gridlock has led to a massive narrowing in our government’s deficit levels (chart below) – back to more historical levels.This occurred just as rising frustration with Washington has been on the rise.

The Fed: Rate Revolution or Evolution?
Besides the changing season of politics, the other major area of change is Federal Reserve monetary policy. Even though the Fed has only increased interest rates once over the last 10 years, and interest rates are at near-generational lows, investors remain fearful. There is bound to be some short-term volatility if interest rates rise to 0.50% – 0.75% in December, as currently expected. However, if the Fed continues at its current snail’s pace, it won’t be until 2032 before they complete their rate hike cycles.
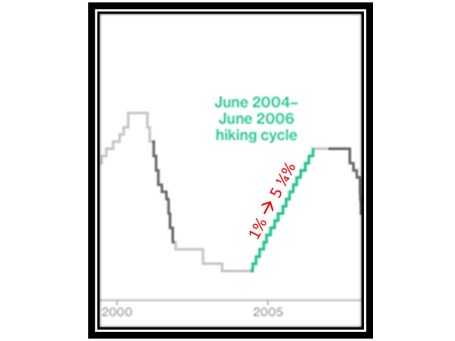
We can put the next rate increase into perspective by studying history. More specifically, the Fed raised interest rates 17 times from 2004 – 2006 (see chart below). Fortunately over this same time period, the world didn’t end as the Fed increased interest rates from 1.00% to 5.25% (stocks prices actually rose around +11%). The same can be said today – the world won’t likely end, if interest rates rise from 0.50% to 0.75% in a few months.
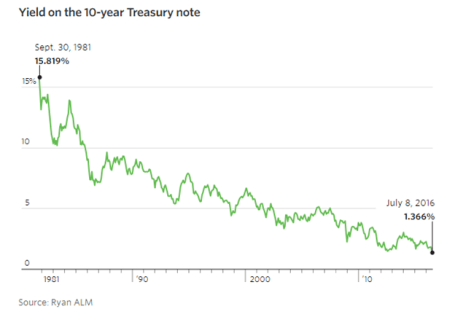
The next question becomes, why are interest rates so low? There are many reasons and theories, but a few of the key drivers behind low rates include, slower global economic growth, low inflation, high demand for low-risk assets, technology, and demographics. I could devote a whole article to each of these factors, and indeed in many cases I have, but suffice it to say that there are many reasons beyond the oversimplified explanation that artificial central bank intervention has led to a 35 year decline in interest rates (see chart below).
Change is a constant, and with fall arriving, some changes are more predictable than others. The timing of the U.S. presidential election outcome is very predictable but the same cannot be said for the timing of future interest rate increases. Irrespective of the coming changes and the related timing, history reminds us that concerns over politics and interest rates often are overblown. Many individuals remain overly-pessimistic due to excessive, daily attention to gloomy and irrelevant news headlines. Thankfully, stock prices are paying attention to more important factors (see Don’t Be a Fool) and long-term investors are being rewarded with record high stock prices in recent weeks. That’s the type of change I love.
Wade W. Slome, CFA, CFP®
Plan. Invest. Prosper.
DISCLOSURE: Sidoxia Capital Management (SCM) and some of its clients hold positions in certain exchange traded funds (ETFs), but at the time of publishing had no direct position in any other security referenced in this article. No information accessed through the Investing Caffeine (IC) website constitutes investment, financial, legal, tax or other advice nor is to be relied on in making an investment or other decision. Please read disclosure language on IC Contact page.
Huh… Stocks Reach a Record High?

This article is an excerpt from a previously released Sidoxia Capital Management complimentary newsletter (September 1, 2016). Subscribe on the right side of the page for the complete text.
The stock market hit all-time record highs again in August, but despite the +6.2% move in 2016 S&P 500 stock prices (and +225% since early 2009), investors continue to scratch their heads in confusion. Individuals continue to ask, “Huh, how can stocks be trading at or near record levels (+6% for the year) when Brexit remains a looming overhang, uncertainty surrounds the U.S. presidential election, global terrorist attacks are on the rise, negative interest rates are ruling the day, and central banks around the globe are artificially propping up financial markets (see also Fed Myths vs. Reality)? Does this laundry list of concerns stress you out? If you said “yes”, you are not alone.
As I’ve pointed out in the past, we live in a different world today. In the olden days, terrorist attacks, natural disasters, currency crises, car chases, bank failures, celebrity DUIs, and wars happened all the time. However, before the internet existed, people either never heard about these worries, or they just didn’t care (or both). Today, we live in a Twitter, Facebook, Instagram, Snapchat, society with 500+ cable channels, and supercomputers in the palm of our hands (i.e., smartphones) with more computing power than existed on the Apollo mission to the moon. In short, doom-and-gloom captures human attention and sells advertising, the status quo does not.
- Record corporate profits are on the rise
- Stabilizing value of the dollar
- Stabilizing energy and commodity prices
- Record low interest rates
- Skeptical investing public
Fortunately, the stock market pays more attention to these important dynamics, rather than the F.U.D. (Fear, Uncertainty, Doubt) peddled by the pundits, bloggers, and TV talking heads. Certainly, any or all of the previously mentioned positive factors could change or deteriorate over time, but for the time being, the bulls are winning.
Let’s take a closer look at the influencing components that are driving stock prices higher:
Record Corporate Profits

Source: Yardeni.com
Profits are the mother’s milk that feeds the stock market. During recessions, profits are starved and stock prices decline. On the flip side, economic expansions feed profits and cause share prices to rise. As you can see from the chart above, there was a meteoric rise in corporate income from 2009 – 2014 before a leveling off occurred from 2015 going into 2016. The major headwinds causing profits to flatten was a spike of 25% in the value of the U.S. dollar relative to the value of other global currencies, all within a relatively short time span of about nine months (see chart below).

Why is this large currency shift important? The answer is that approximately 40% of multinational profits derived by S&P 500 companies come from international markets. Therefore, when the value of the dollar rose 25%, the cost to purchase U.S. products and services by foreign buyers became 25% costlier. Selling dramatically higher cost goods abroad squeezed exports, which in turn led to a flattening of profits. Time will tell, but as I showed in the first chart, the slope of the profit line has resumed its upwards trajectory, which helps explain why stock prices have been advancing in recent months.
Besides a strong dollar, another negative factor that temporarily weakened earnings was the dramatic decline in oil prices (see chart below) Two years ago, WTI oil prices were above $100 per barrel. Today, prices are hovering around $45 per barrel. As you can imagine, this tremendous price decline has had a destructive impact on the profits of the energy sector in general. The good news is that after watching prices plummet below $30 earlier this year, prices have since stabilized at higher levels. In other words, the profits headwind has been neutralized, and if global economic growth recovers further, the energy headwind could turn into an energy tailwind.

Record Low Interest Rates
Stocks were not popular during the early 1980s. In fact, the Dow Jones Industrial Average traded at 2,600 in 1980 vs 18,400 today. The economy was much smaller back then, but another significant overhang to lower stock prices was higher interest rates (and inflation). Back in 1980, the Federal Funds target rate set by the Federal Reserve reached a whopping 20.0% versus today the same rate sits at < 0.5%.
Why is this data important? When you can earn a 16.99% yield in a one-year bank CD (see advertisement below), generally there is a much smaller appetite to invest in riskier, more volatile stocks. Another way to think about rates is to equate interest rates to the cost of owning stocks. When interest rates were high, the relative cost to own stocks was also high, so many investors liquidated stocks. It makes perfect sense that stocks in that high interest rate environment of 1980 would be a lot less attractive compared to a relatively safe CD that paid 17% over a 12-month period.

On the other hand, when interest rates are low, the relative cost of owning stocks is low, so it makes sense that stock prices are rising in this environment. Just like profits, interest rates are not static, and they too can change rapidly. But as long as rates remain near record lows, and profits remain healthy, stocks should remain an appealing asset class, especially given the scarcity of strong alternatives.
Skeptical Investing Public
The last piece of the puzzle to examine in order to help explain the head-scratching record stock prices is the pervasive skepticism present in the current stock market. How can Brexit, presidential election, terrorism, negative interest rates, and uncertain Federal Reserve policies be good for stock prices? Investing in many respects can be like navigating through traffic. When everyone wants to drive on the freeway, it becomes congested and a bad option, therefore taking side-streets or detours is a better strategy. The same principle applies to the stock market. When everyone wants to invest in the stock market (like during the late 1990s) or buy housing (mid-2000s), prices are usually too inflated, and shrewd investors decide to choose a different route by selling.
The same holds true in reverse. When nobody is interested in investing (see also, 18-year low in stock ownership and two trillion of stocks sold), then generally that is a strong sign that it is a good time to buy. Currently, skepticism is plentiful, for all the reasons cited above, which is a healthy investment indicator. Many individuals continue reading the ominous headlines and scratching their heads in confusion over today’s record stock prices. In contrast, at Sidoxia, we have opportunistically benefited from investors’ skepticism by discovering plenty of attractive opportunities for our clients. There’s no confusion about that.
Wade W. Slome, CFA, CFP®
Plan. Invest. Prosper.
DISCLOSURE: Sidoxia Capital Management (SCM) and some of its clients hold positions in certain exchange traded funds (ETFs) and FB, but at the time of publishing had no direct position in TWTR or any other security referenced in this article. No information accessed through the Investing Caffeine (IC) website constitutes investment, financial, legal, tax or other advice nor is to be relied on in making an investment or other decision. Please read disclosure language on IC Contact page.
Stocks Winning Olympic Gold

This article is an excerpt from a previously released Sidoxia Capital Management complimentary newsletter (August 1, 2016). Subscribe on the right side of the page for the complete text.
The XXXI Olympics in Rio, Brazil begin this week, but stocks in 2016 have already won a gold medal for their stellar performance. The S&P 500 index has already triumphantly sprinted to new, all-time record highs this month. A significant portion of the gains came in July (+3.6%), but if you also account for the positive results achieved in the first six months of 2016, stocks have advanced +6.3% for the year. If you judge the 2%+ annualized dividend yield, the total investment return earns an even higher score, coming closer to +8% for the year-to-date period.
No wonder the U.S. is standing on the top of the economic podium compared to some of the other international financial markets, which have sucked wind during 2016:
- China Shanghai Index: -15.8%
- Japan Nikkei Index: -12.9%
- French Paris CAC Index: -4.3%
- German Dax Index: -3.8%
- Europe MSCI Index: -3.5%
- Hong Kong Heng Sang Index: -0.1%
While there are some other down-and-out financial markets that have rebounded significantly this year (e.g., Brazil +61% & Russia +23%), the performance of the U.S. stock market has been impressive in light of all the fear, uncertainty, and doubt blanketing the media airwaves. Consider the fact that the record-breaking performance of the U.S. stock market in July occurred in the face of these scary headlines:
- Brexit referendum (British exit from the European Union)
- Declining oil prices
- Declining global interest rates
- More than -$11,000,000,000,000.00 (yes trillions) in negative interest rate bonds
- Global terrorist attacks
- Coup attempt in Turkey
- And oh yeah, a contentious domestic presidential election
With so many competitors struggling, and the investment conditions so challenging, then how has the U.S. prospered with a gold medal performance in this cutthroat environment? For many individuals, the answer can be confusing. However, for Sidoxia’s followers and clients, the strong pillars for a continued bull market have been evident for some time (described again below).
Bull Market Pillars
Surprising to some observers, stocks do not read pessimistic newspaper headlines or listen to gloomy news stories. In the short-run, stock prices can get injured by emotional news-driven traders and speculators, but over the long-run, stocks and financial markets are drawn like a magnet to several all-important metrics. What crucial metrics am I referring to? As I’ve reiterated in the past, the key drivers for future stock price appreciation are corporate profits, interest rates, valuations (i.e., price levels), and sentiment indicators (see also Don’t Be a Fool).
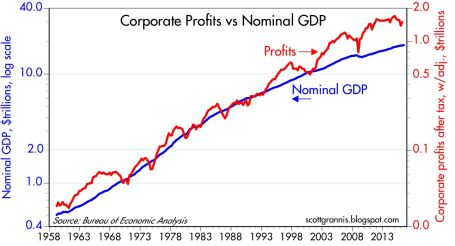
Stated more simply, money goes where it is treated best, and with many bonds and savings accounts earning negative or near 0% interest rates, investors are going elsewhere – for example, stocks. You can see from the chart below, economy/stocks are treated best by rising corporate profits, which are at/near record high levels. With the majority of stocks beating 2nd quarter earnings expectations, this shot of adrenaline has given the stock market an added near-term boost. A stabilizing U.S. dollar, better-than-expected banking results, and firming commodity prices have all contributed to the winning results.
Price Follows Earnings…and Recessions
What history shows us is stock prices follow the direction of earnings, which helps explain why stock prices generally go down during economic recessions. Weaker demand leads to weaker profits, and weaker profits lead to weaker stock prices. Fortunately for U.S. investors, there currently are no definitive signs of imminent recession clouds. Scott Grannis, the editor of Calafia Beach Pundit, sums up the relationship between recessions and the stock market here:
“Recessions typically follow periods of excesses—soaring home prices, rising inflation, widespread optimism—rather than periods dominated by risk aversion such as we have today. Risk aversion can still be found in abundance: just look at the extremely low level of Treasury yields, and the lack of business investment despite strong corporate profits.”
Similar to the Olympics, achieving success in investing can be very challenging, but if you want to win a medal, you must first compete. If you’re not investing, you’re not competing. And if you’re not investing, you have no chance of winning a financial gold medal. Just as in the Olympics, not everyone can win, and there are many ups and downs along the way to victory. Rather than focusing on the cheers and boos of the crowd, implementing a disciplined and diversified investment strategy that accounts for your time horizon, objectives, and risk tolerance is the championship approach that will increase your probability of landing on the Olympic medal podium.
Wade W. Slome, CFA, CFP®
Plan. Invest. Prosper.
DISCLOSURE: Sidoxia Capital Management (SCM) and some of its clients hold positions in certain exchange traded funds (ETFs), but at the time of publishing had no direct position in any other security referenced in this article. No information accessed through the Investing Caffeine (IC) website constitutes investment, financial, legal, tax or other advice nor is to be relied on in making an investment or other decision. Please read disclosure language on IC Contact page.
EU Marriage Ends in Messy Brexit Divorce

This article is an excerpt from a previously released Sidoxia Capital Management complimentary newsletter (July 1, 2016). Subscribe on the right side of the page for the complete text.
What Just Happened?
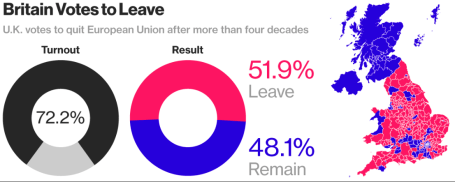
Breakups are never easy, especially when they come as a surprise. That’s exactly what happened with last week’s “Brexit” (British exit) referendum results. History was made when 51.9% of the United Kingdom (U.K.) voters from England, Scotland, Wales and Northern Ireland cast their vote to divorce (“Leave”) their country from the European Union (EU). In the end, the 48.1% of U.K. voters could not generate enough support to “Remain” in the EU (see chart below). Despite torrential downpours in southern Britain, voter turnout was extraordinarily high, as 72% of the 46.5 million registered voters came out in full force to have their voices heard.
Divorce is never cheap, and UK Prime Minister David Cameron paid the ultimate price with his defeat in the Brexit referendum…the loss of his job. Immediately following the release of the referendum results, Cameron, the British Prime Minister since 2010 and leader of the Conservative Party, immediately announced his resignation, effective no later than October 2016 after the selection of his successor.
Source: Bloomberg
One of the reasons behind the shock of the Brexit Leave decision is the longstanding relationship the U.K. has had with the EU. European Union membership first began in 1957 with Belgium, France, Germany, Italy, Luxembourg, and Netherlands being the founding countries of this new political-economic union.
A few decades later, the U.K. officially joined the EU in 1973 with Ireland and the Denmark, shortly before Margaret Thatcher came into power. If you fast forward to today, some 43 years after U.K. originally joined the EU, the Brexit decision represents the largest turning point in European political history. Not since the 1989 falling of the Berlin Wall and the subsequent demise of the Cold War in the Soviet Union has such a large, earth-moving political shift occurred.
Today, there are 28 member countries in the EU with Croatia being the newest member in 2013. Despite the Brexit outcome, there still is a backlog of countries wanting to join the EU club, including Turkey, Serbia, Albania, and Montenegro (and this excludes Scotland, which has voiced an interest in leaving the U.K. for the EU).
What Were Investors’ Reactions?
Financial markets around the world were caught off guard, given many pre-referendum polls were showing the Remain camp with a slight edge, along with British betting parlors that were handicapping an overwhelming victory for the Remain camp. Here’s a summary of stock market reactions around the globe from June 23rd to June 30th:
U.S. (S&P 500): -0.7%
U.K. (FTSE 100): +2.6%
Japan (Nikkei): -4.1%
Germany (DAX): -5.6%
Hong Kong (Hang Seng): +0.4%
China (Shanghai): +1.3%
India (BSE): -0.0%
Surprisingly, modest monthly gains achieved in the S&P 500 prior to the Brexit vote (up +0.8%) were quickly pared after the results came in but remained positive for the entire month (up +0.1%). For the year, U.S. stocks are up a limited +2.7%, which isn’t too bad considering investors’ current mood.
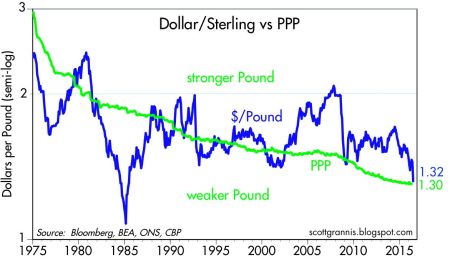
Stocks were not the only financial market disrupted after the Brexit announcement, foreign exchange currency rates were unstable as well. The British pound dived to a 30-year low shortly after the vote to a level of approximately $1.33/£, and was down more than -10% on the day of the announcement (see chart below). UK banks like Barclays PLC (BCS) and Lloyds Banking Group PLC (LYG) also saw their share prices significantly pressured as EU regulatory risks of losing access to European customers and negative global interest rates further squeeze the banks’ profit margins.
To put the currency picture into perspective, the value of the British pound ($2.64/£) peaked in March 1972 at a rate about double the U.S. dollar today. On the positive side of the ledger, a weaker British pound could help boost exports and vacation time to Stonehenge or London, but there is also a risk for a spike of inflation (or stagflation) on the country’s roughly $740 billion in imports (e.g., food, energy, and raw materials).
Source: Calafia Beach Pundit
Why Did it Happen?
While economically prosperous regions like London and Scotland voted heavily for Remain, the message for change of the Leave camp resonated well with working class towns and rural areas of England (seen here). Besides a geographic split, there was also a demographic divide between voters. As you can see from the YouGov poll below, the majority of younger citizens overwhelmingly voted for Remain, and vice versa for older citizens as it relates to the Leave vote.
18-24: 75% Remain
25-49: 56% Remain
50-64: 44% Remain
65+: 39% Remain
While geography and demographics certainly played a key role in the outcome of the EU Leave referendum result, at the core of the movement also was a populist discontent with immigration and the negative economic consequences created by globalization. There are many reasons behind the sluggish economic global recovery, even if the U.S. is doing best out of the developed countries, but rightly or wrongly, immigration policies and protectionism played a prominent part in the Brexit.
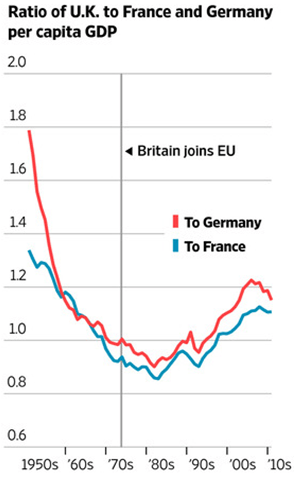
At the heart of the populist sentiment of lost control to Brussels (EU) and immigration is the question of whether the benefits of globalization have outweighed the costs. The spread of globalization and expanded EU immigration has disenfranchised many lower skill level workers displaced by eastern European immigrants, Syrian refugees and innovative solutions like automated machinery, software, and electronic equipment. Economic history clearly shows the answer to the effectiveness of globalization is a resounding “yes”, but the post-financial crisis recovery has been disappointingly sluggish, so a component of the populist movement has felt an urgency to find a scapegoat. The benefits of globalization can be seen in the chart below, as evidenced by the increases in per capita GDP of the UK relative to Germany and France, after joining the EU in 1973. Many observers are quick to identify the visible consequences of globalization (i.e., lower-paying job losses), but fail to identify the invisible benefits (i.e., productivity, lower prices, investment in higher-paying job gains).
Source: The Wall Street Journal
What happens next?
While some EU leaders want to accelerate the Brexit transition, in actuality, this will require a long, drawn-out negotiation process between the still-unnamed new UK Prime Minister and EU officials. The complete EU-Brexit deal will take upwards of two-years to complete, once Article 50 of the EU Lisbon Treaty has been triggered – likely in October.
In light of the unchartered nature of the Brexit Leave vote, nobody truly knows if this decision will ultimately compromise the existential reality of the EU. Time will tell whether Brexit will merely be a small bump on the long EU road, or the beginning of a scary European domino effect that causes the 28 EU country bloc to topple. If the U.K. is successful in negotiating EU trade agreements with separate European countries, the Brexit even has a longer-term potential of benefiting economic activity. Regardless of the EU outcome, the long-term proliferation of capitalism and democracy is likely to prevail because citizens vote with their wallets and capital goes where it is treated best.
What does Brexit Mean for Global Markets?
The short answer is not much economically, however there have been plenty of less substantial events that have roiled financial markets for relatively short periods of time. There are two basic questions to ask when looking at the economic impact of Brexit:
1) What is the Brexit impact on the U.S. economy?
If you objectively analyze the statistics, U.S. companies sold approximately $56 billion of goods to the U.K. last year (our #7 trading partner). Even if you believe in the unlikely scenario of a severe U.K. economic meltdown, the U.K. trade figure is a rounding error in the whole global economic scheme of things. More specifically, $56 billion in trade with the U.K. equates to about .003 of the United States’ $18+ trillion GDP (Gross Domestic Product).
2) What is the Brexit impact on the global economy?
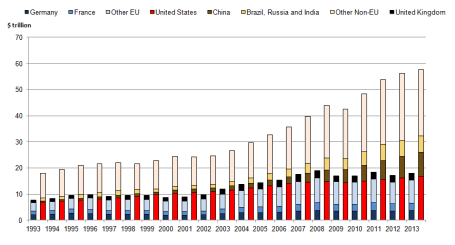
The U.K.’s GDP amounts to about $3 trillion dollars. Of that total, U.K. exports to the EU account for a reasonably insignificant $300 billion. As you can see from the chart below, $300 billion in UK exports to the EU are virtually meaningless and coincidentally equate to about .003 of the world’s $78 trillion estimated GDP.
Source: The National Archives
What to Do Next?
Like many divorces, the U.K. Brexit may be messy and drawn out, until all the details are finalized over the next couple years. It’s important that you establish a strong foundation with your investments and do not divorce the sound, fundamental principles needed to grow and preserve your portfolio. As is usually the case, panicking or making an emotional decision relating to your investments during the heat of some geopolitical crisis rarely translates into an optimal decision over the long-run. As I repeatedly have advised over the years, these periods of volatility are nothing new (see also Series of Unfortunate Events).
If you catch your anxiety or blood pressure rising, do yourself a favor and turn off your TV, radio, or electronic device. A more productive use of time is to calmly review your asset allocation and follow a financial plan, with or without the assistance of a financial professional, so that you are able to achieve your long-term financial goals. This strategy will help you establish a more durable, long-lasting, and successful marriage with your investments.
Wade W. Slome, CFA, CFP®
Plan. Invest. Prosper.
DISCLOSURE: Sidoxia Capital Management (SCM) and some of its clients hold positions in certain exchange traded funds (ETFs), but at the time of publishing had no direct position in any other security referenced in this article. No information accessed through the Investing Caffeine (IC) website constitutes investment, financial, legal, tax or other advice nor is to be relied on in making an investment or other decision. Please read disclosure language on IC Contact page.
Cleaning Out Your Investment Fridge

This article is an excerpt from a previously released Sidoxia Capital Management complimentary newsletter (June 1, 2016). Subscribe on the right side of the page for the complete text.
Summer is quickly approaching, but it’s not too late to do some spring cleaning. This principle not only applies to your cluttered refrigerator with stale foods but also your investment portfolio with moldy investments. In both cases, you want to get rid of the spoiled goods. It’s never fun discovering a science experiment growing in your fridge.
Over the last three months, the stock market has been replenished after a rotten first two months of the year (S&P 500 index was down -5.5% January through February). The +1.5% increase in May added to a +6.6% and +0.3% increase in March and April (respectively), resulting in a three month total advance in stock prices of +8.5%. Not surprisingly, the advance in the stock market is mirroring the recovery we have seen in recent economic data.
After digesting a foul 1st quarter economic Gross Domestic Product (GDP) reading of only +0.8%, activity has been smelling better in the 2nd quarter. A recent wholesome +3.4% increase in April durable goods orders, among other data points, has caused the Atlanta Federal Reserve Bank to raise its 2nd quarter GDP estimate to a healthier +2.9% growth rate (from its prior +2.5% forecast).
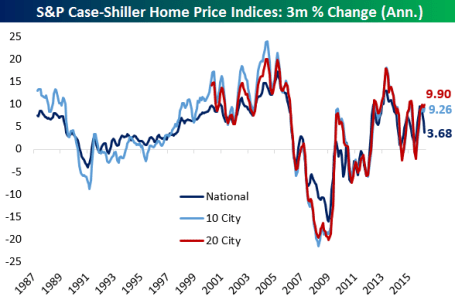
Consumer spending, which accounts for roughly 70% of our country’s economic activity, has been on the rise as well. The improving employment picture (5.0% unemployment rate last month) means consumers are increasingly opening their wallets and purses. In addition to spending more on cars, clothing, movies, and vacations, consumers are also doling out a growing portion of their income on housing. Housing developers have cautiously kept a lid on expansion, which has translated into limited supply and higher home prices, as evidenced by the Case-Shiller indices charted below.
Source: Bespoke
Spoiling the Fun?
While the fridge may look like it’s fully stocked with fresh produce, meat, and dairy, it doesn’t take long for the strawberries to get moldy and the milk to sour. Investor moods can sour quickly too, especially as they fret over the impending “Brexit” (British Exit) referendum on June 23rd when British voters will decide whether they want to leave the European Union. A “yes” exit vote has the potential of roiling the financial markets and causing lots of upset stomachs.
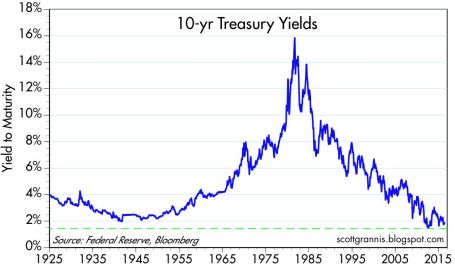
Another financial area to monitor relates to the Federal Reserve’s monetary policy and its decision when to further increase the Federal Funds interest rate target at its June 14th – 15th meeting. With the target currently set at an almost insignificantly small level of 0.25% – 0.50%, it really should not matter whether Chair Janet Yellen decides to increase rates in June, July, September and/or November. Considering interest rates are at/near generational lows (see chart below), a ¼ point or ½ point percentage increase in short-term interest rates should have no meaningfully negative impact on the economy. If your fridge was at record freezing levels, increasing the temperature by a ¼ or ½ degree wouldn’t have a major effect either. If and when short-term interest rates increase by 2.0%, 3.0%, or 4.0% in a relatively short period will be the time to be concerned.
Source: Scott Grannis
Keep a Fresh Financial Plan
As mentioned earlier, your investments can get stale too. Excess cash sitting idly earning next-to-nothing in checking, savings, CDs, or in traditional low-yielding bonds is only going to spoil rapidly to inflation as your savings get eaten away. In the short-run, stock prices will move up and down based on frightening but insignificant headlines. However, in the long-run, the more important issues are determining how you are going to reach your retirement goals and whether you are going to outlive your savings. This mindset requires you to properly assess your time horizon, risk tolerance, income needs, tax situation, estate plan, and other unique circumstances. Like a balanced diet of various food groups in your refrigerator, your key personal financial planning factors are dependent upon you maintaining a properly diversified asset allocation that is periodically rebalanced to meet your long-term financial goals.
Whether you are managing your life savings, or your life-sustaining food supply, it’s always best to act now and not be a couch potato. The consequences of sitting idle and letting your investments spoil away are a lot worse than letting the food in your refrigerator rot away.
Wade W. Slome, CFA, CFP®
Plan. Invest. Prosper.
DISCLOSURE: Sidoxia Capital Management (SCM) and some of its clients hold positions in certain exchange traded funds (ETFs), but at the time of publishing had no direct position in any other security referenced in this article. No information accessed through the Investing Caffeine (IC) website constitutes investment, financial, legal, tax or other advice nor is to be relied on in making an investment or other decision. Please read disclosure language on IC Contact page.
Pulling the Band-Aid Off Slowly

Federal Reserve monetary policy once again came to the forefront as the Fed released its April minutes this week. After living through years of a ZIRP (Zero Interest Rate Policy) coupled with QE (Quantitative Easing), many market participants and commentators are begging for a swifter move back to “normalization” (a Federal Funds Rate target set closer to historical averages). The economic wounds from the financial crisis may be healing, as seen in the improving employment data, but rather than ripping off the interest rate Band-Aid quickly and putting the pain behind investors, the dovish Fed Chair Janet Yellen has been signaling for months the Fed will increase rates at a “gradual” pace.
Despite the more hawkish tone regarding the possibility of an additional rate hike in June, Fed interest rate futures are currently still only factoring in about a 26% probability of a rate increase in June. As I have been saying for years (see “Fed Fatigue”), there has, and will likely continue to be, an overly, hyper-sensitive focus on monetary policy and language disseminated by members of the Feral Reserve Open Market Committee.
For example, in 1994, despite the Fed increasing target rates by +2.5% in a single year (from 3.0% to 5.5%), stock prices finished roughly flat for the year, and the market resumed its decade-long bull market run the subsequent year. Today, the higher bound of Fed Funds sits at a mere 0.5%, and the Fed has announced only one target increase this cycle (equaling a fraction of the ’94 pace). Even if investors are panicking over another potential quarter point in June or July, can you say, “overkill?”
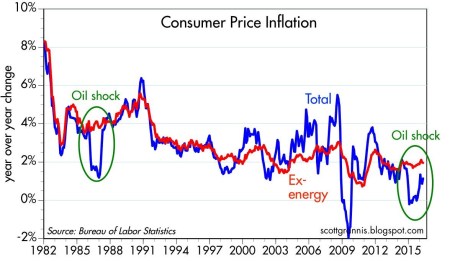
While the Fed is approaching the lower-end of the range for its employment mandate (unemployment currently sitting at 5%), despite the recent bounce in oil prices, core inflation remains in check (see Calafia Pundit chart below). This long-term benign pricing trend gives the Fed a longer leash as it relates to the pace of future rate hikes.
Source: Calafia Beach Pundit
Sure, ripping off the Fed Band-Aid with a small handful of +0.5% (50 bps) hikes might appease hawkish investors, but Janet Yellen, the “Fed Fairy Godmother,” has made it abundantly clear she is in no hurry to raise rates. Whether there is zero, one, or two additional rate hikes this year is much less important than other fundamental factors. Adding fuel to the Fed-speak fire in the short-run will be Yellen speeches on May 27th at Harvard University and on June 6th at the World Affairs Council of Philadelphia. And then following that, we will have the “Brexit” referendum (i.e., the vote on whether Britain should exit the EU); a steady stream of election noise; and many other unanticipated economic/geopolitical headlines.
As I continually state, the key factors driving the direction of long-term stock prices are profits, interest rates, valuations, and sentiment (see Follow the Stool). Profits (ex-energy) are growing near record levels; interest rates are near record lows (even with potential 2016 hikes); valuations remain near historical averages; and sentiment regarding stock ownership is firing strongly as a positive contrarian indicator.
While many pundits have been calling for and predicting the Fed to rip the Band-Aid off with a swift string of rate increases, persistently low inflation, coupled with a consistently dovish Fed Chair are likely to lead to a slow peeling of the monetary policy Band-Aid. Unfortunately, the endless flow of irrelevant monetary policy guesswork regarding the timing of future rate hikes will be more painful than the actual hikes themselves. In the end, any future hikes should be justified with a stronger economic foundation, which should represent future strength, rather than future weakness.
Wade W. Slome, CFA, CFP®
Plan. Invest. Prosper.
DISCLOSURE: Sidoxia Capital Management (SCM) and some of its clients hold positions in certain exchange traded funds (ETFs), but at the time of publishing had no direct position in any other security referenced in this article. No information accessed through the Investing Caffeine (IC) website constitutes investment, financial, legal, tax or other advice nor is to be relied on in making an investment or other decision. Please read disclosure language on IC Contact page.