Posts filed under ‘economy’
The Only Thing to Fear is the Unknown Itself

Martin Luther King, Jr. famously stated, “The only thing we have to fear is fear itself,” but when it comes to the stock market, the only thing to fear is the “unknown.” As much as people like to say, “I saw that crisis coming,” or “I knew the bubble was going to burst,” the reality is these assertions are often embellished, overstated, and/or misplaced.
How many people saw these events coming?
- 1987 – Black Monday
- Iraqi War
- Thai Baht Currency Crisis
- Long-Term Capital Management Collapse & Bailout
- 9/11 Terrorist Attack
- Lehman Brothers Bankruptcy / Bear Stearns Bailout
- Flash Crash
- U.S. Debt Downgrade
- Arab Spring
- Sequestration Cuts
- Cyprus Financial Crisis
- Federal Reserve (QE1, QE2, QE3, Operation Twist, etc.)
Sure, there will always be a prescient few who may actually get it right and profit from their crystal balls, but to assume you are smart enough to predict these events with any consistent accuracy is likely reckless. Even for the smartest and brightest minds, uncertainty and doubt surrounding such mega-events leads to inaction or paralysis. If profiting in advance of these negative outcomes was so easy, you probably would be basking in the sun on your personal private island…and not reading this article.
Coming to grips with the existence of a never-ending series of future negative financial shocks is the price of doing business in the stock market, if you want to become a successful long-term investor. The fact of the matter is with 7 billion people living on a planet orbiting the sun at 67,000 mph, the law of large numbers tells us there will be many unpredictable events caused either by pure chance or poor human decisions. As the great financial crisis of 2008-2009 proved, there will always be populations of stupid or ignorant people who will purposely or inadvertently cause significant damage to economies around the world.
Fortunately, the power of democracy (see Spreading the Seeds of Democracy) and the benefits of capitalism have dramatically increased the standards of living for hundreds of millions of people. Despite horrific outcomes and unthinkable atrocities perpetrated throughout history, global GDP and living standards continue to positively march forward and upward. For example, consider in my limited lifespan, I have seen the introduction of VCRs, microwave ovens, mobile phones, and the internet, while experiencing amazing milestones like the eradication of smallpox, the sequencing of the human genome, and landing space exploration vehicles on Mars, among many other unimaginable achievements.
Despite amazing advancements, many investors are paralyzed into inaction out of fear of a harmful outcome. If I received a penny for every negative prediction I read or heard about over my 20+ years of investing, I would be happily retired. The stock market is never immune from adverse events, but chances are a geopolitical war in Ukraine/Iraq; accelerated Federal Reserve rate tightening; China real estate bubble; Argentinian debt default; or other current, worrisome headline is unlikely to be the cause of the next -20%+ bear market. History shows us that fear of the unknown is more rational than the fear of the known. If you can’t come to grips with fear itself, I fear your long-term results will lead to a scary retirement.
Wade W. Slome, CFA, CFP®
Plan. Invest. Prosper.
DISCLOSURE: Sidoxia Capital Management (SCM) and some of its clients hold long positions in certain exchange traded funds, but at the time of publishing SCM had no direct position in any other security referenced in this article. No information accessed through the Investing Caffeine (IC) website constitutes investment, financial, legal, tax or other advice nor is to be relied on in making an investment or other decision. Please read disclosure language on IC Contact page.
Stocks Winning vs. Weak Competitors

This article is an excerpt from a previously released Sidoxia Capital Management complementary newsletter (June 2, 2014). Subscribe on the right side of the page for the complete text.
Winning at any sport is lot easier if you can compete without an opponent. Imagine an NBA basketball MVP LeBron James driving to the basket against no defender, or versus a weakling opponent like a 44-year-old investment manager. Under these circumstances, it would be pretty easy for James and his team, the Miami Heat, to victoriously dominate without even a trace of sweat.
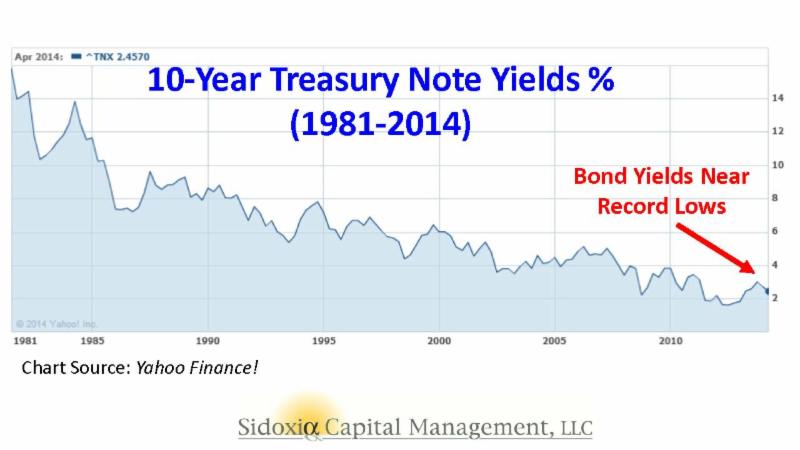
Effectively, stocks have enjoyed similar domination in recent years, while steamrolling over the bond competition. To put the stock market’s winning streak into perspective, the S&P 500 index set a new all-time record high in May, with the S&P 500 advancing +2.1% to 1924 for the month, bringing the 2013-2014 total return to about +38%. Not too shabby results over 17 months, if you consider bank deposits and CDs are paying a paltry 0.0-1.0% annually, and investors are gobbling up bonds yielding a measly 2.5% (see chart below).
The point, once again, is that even if you are a skeptic or bear on the outlook for stocks, the stock market still offers the most attractive opportunities relative to other asset classes and investment options, including bonds. It’s true, the low hanging fruit in stocks has been picked, and portfolios can become too equity-heavy, but even retirees should have some exposure to equities.
As I wrote last month in Buy in May and Dance Away, why would investors voluntarily lock in inadequate yields at generational lows when the earnings yield on stocks are so much more appealing. The approximate P/E (Price-Earnings) ratio for the S&P 500 currently averages approximately +6.2% with a rising dividend yield of about +1.8% – not much lower than many bonds. Over the last five years, those investors willing to part ways with yield-less cash have voted aggressively with their wallets. Those with confidence in the equity markets have benefited massively from the approximate +200% gains garnered from the March 2009 S&P 500 index lows.
For the many who have painfully missed the mother of all stock rallies, the fallback response has been, “Well, sure the market has tripled, but it’s only because of unprecedented printing of money at the QE (Quantitative Easing) printing presses!” This argument has become increasingly difficult to defend ever since the Federal Reserve announced the initiation of the reduction in bond buying (a.k.a., “tapering”) six months ago (December 18th). Over that time period, the Dow Jones Industrial Average has increased over 800 points and the S&P 500 index has risen a healthy 8.0%.
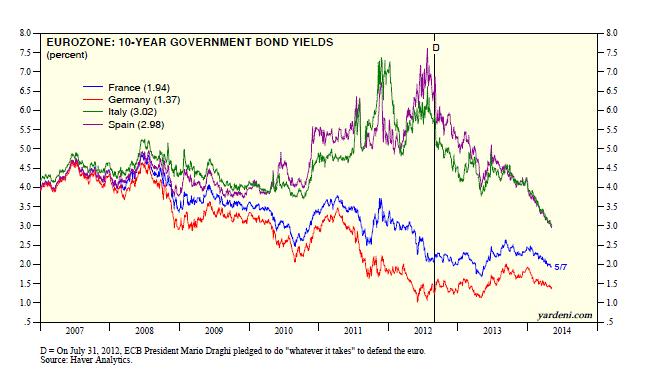
As much as everyone would like to blame (give credit to) the Fed for the bull market, the fact is the Federal Reserve doesn’t control the world’s interest rates. Sure, the Fed has an influence on global interest rates, but countries like Japan may have something to do with their own 0.57% 10-year government bond yield. For example, the economic/political policies and demographics in play might be impacting Japan’s stock market (Nikkei), which has plummeted about -62% over the last 25 years (about 39,000 to 15,000). Almost as shocking as the lowly rates in Japan and the U.S. and Japan, are the astonishingly low interest rates in Europe. As the chart below shows, France and Germany have sub-2% 10-year government bond yields (1.76% and 1.36%, respectively) and even economic basket case countries like Italy and Spain have seen their yields pierce below the 3% level.
 Source: Dr. Ed’s Blog
Suffice it to say, yield is not only difficult to find on our shores, but it is also challenging to find winning bond returns globally.
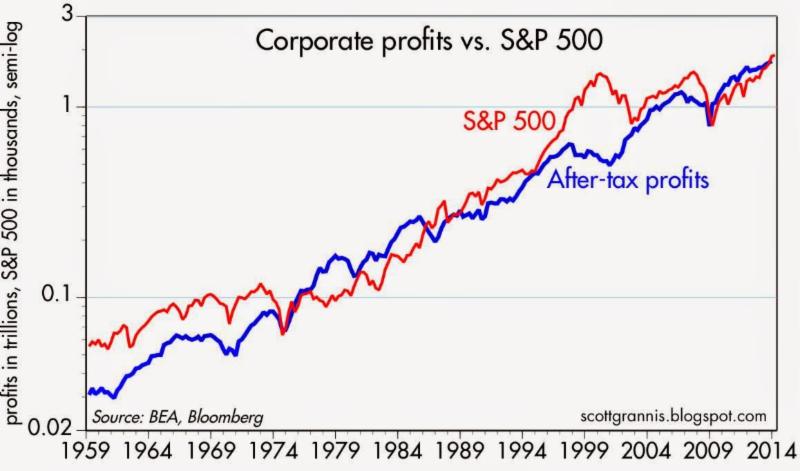
Well if low interest rates and the Federal Reserve aren’t the only reasons for a skyrocketing stock market, then how come this juggernaut performance has such long legs? The largest reason in my mind boils down to two words…record profits. Readers of mine know I follow the basic tenet that stock prices follow earnings over the long-term. Interest rates and Fed Policy will provide headwinds and tailwinds over different timeframes, but ultimately the almighty direction of profits determines long-run stock performance. You don’t have to be a brain surgeon or rocket scientist to appreciate this correlation. Scott Grannis (Calafia Beach Pundit) has beautifully documented this relationship in the chart below.
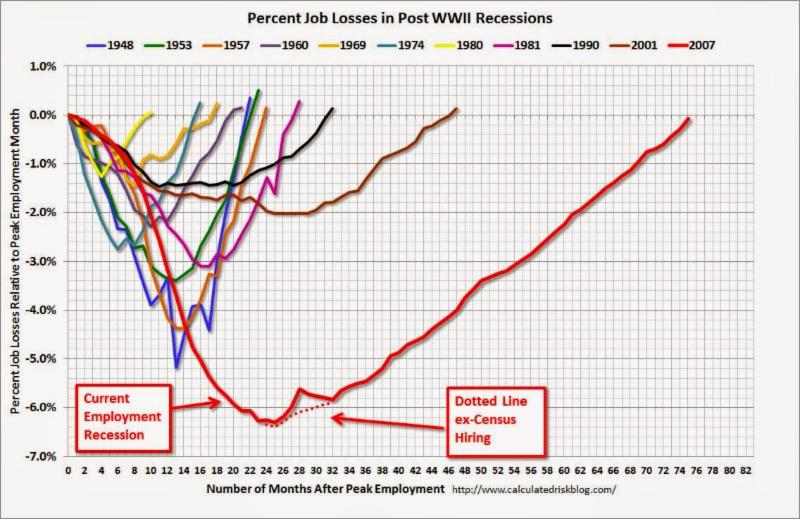
Supporting this concept, profits help support numerous value-enhancing shareholder activities we have seen on the rise over the last five years, which include rising dividends, share buybacks, and M&A (Mergers & Acquisitions) activity. Eventually the business cycle will run its course, and during the next recession, profits and stock prices will be expected to decline. A final contributing factor to the duration of this bull market is the abysmally slow pace of this economic recovery, which if measured in job creation terms has been the slowest since World War II. Said differently, the slower a recovery develops, the longer the recovery will last. Bill McBride at Calculated Risk captured this theme in the following chart:
Despite the massive gains and new records set, skeptics abound as evidenced by the nearly -$10 billion of withdrawn money out of U.S. stock funds over the last month (most recent data).
I’ve been labeled a perma-bull by some, but over my 20+ years of investing experience I understand the importance of defensive positioning along with the benefits of shorting expensive, leveraged stocks during bear markets, like the ones in 2000-2001 and 2008-2009. When will I reverse my views and become bearish (negative) on stocks? Here are a few factors I’m tracking:
- Inverted Yield Curve: This was a good precursor to the 2008-2009 crash, but there are no signs of this occurring yet.
- Overheated Fund Inflows: When everyone piles into stocks, I get nervous. In the last four weeks of domestic ICI fund flow data, we have seen the opposite…about -$9.5 billion outflows from stock funds.
- Peak Employment: When things can’t get much better is the time to become more worried. There is still plenty of room for improvement, especially if you consider the stunningly low employment participation rate.
- Fed Tightening / Rising Bond Yields: The Fed has made it clear, it will be a while before this will occur.
- When Housing Approaches Record Levels: Although Case-Shiller data has shown housing prices bouncing from the bottom, it’s clear that new home sales have stalled and have plenty of head room to go higher.
- Financial Crisis: Chances of experiencing another financial crisis of a generation is slim, but many people have fresh nightmares from the 2008-2009 financial crisis. It’s not every day that a 158 year-old institution (Lehman Brothers) or 85 year-old investment bank (Bear Stearns) disappear, but if the dominoes start falling again, then I guess it’s OK to become anxious again.
- Better Opportunities: The beauty about my practice at Sidoxia is that we can invest anywhere. So if we find more attractive opportunities in emerging market debt, convertible bonds, floating rate notes, private equity, or other asset classes, we have no allegiances and will sell stocks.
Every recession and bear market is different, and although the skies may be blue in the stock market now, clouds and gray skies are never too far away. Even with record prices, many fears remain, including the following:
- Ukraine: There is always geopolitical instability somewhere on the globe. In the past investors were worried about Egypt, Iran, and Syria, but for now, some uncertainty has been created around Ukraine.
- Weak GDP: Gross Domestic Product was revised lower to -1% during the first quarter, in large part due to an abnormally cold winter in many parts of the country. However, many economists are already talking about the possibility of a 3%+ rebound in the second quarter as weather improves.
- Low Volatility: The so-called “Fear Gauge” is near record low levels (VIX index), implying a reckless complacency among investors. While this is a measure I track, it is more confined to speculative traders compared to retail investors. In other words, my grandma isn’t buying put option insurance on the Nasdaq 100 index to protect her portfolio against the ramifications of the Thailand government military coup.
- Inflation/Deflation: Regardless of whether stocks are near a record top or bottom, financial media outlets in need of a topic can always fall back on the fear of inflation or deflation. Currently inflation remains in check. The Fed’s primary measure of inflation, the Core PCE, recently inched up +0.2% month-to-month, in line with forecasts.
- Fed Policy: When are investors not worried about the Federal Reserve’s next step? Like inflation, we’ll be hearing about this concern until we permanently enter our grave.
In the sport of stocks and investing, winning is never easy. However, with the global trend of declining interest rates and the scarcity of yields from bonds and other safe investments (cash/money market/CDs), it should come as no surprise to anyone that the winning streak in stocks is tied to the lack of competing investment alternatives. Based on the current dynamics in the market, if LeBron James is a stock, and I’m forced to guard him as a 10-year Treasury bond, I think I’ll just throw in the towel and go to Wall Street. At least that way my long-term portfolio has a chance of winning by placing a portion of my bets on stocks over bonds.
Wade W. Slome, CFA, CFP®
Plan. Invest. Prosper.
DISCLOSURE: Sidoxia Capital Management (SCM) and some of its clients hold positions in certain exchange traded funds (ETFs), but at the time of publishing SCM had no direct position in any other security referenced in this article. No information accessed through the Investing Caffeine (IC) website constitutes investment, financial, legal, tax or other advice nor is to be relied on in making an investment or other decision. Please read disclosure language on IC Contact page.
Buy in May and Tap Dance Away

This article is an excerpt from a previously released Sidoxia Capital Management complementary newsletter (May 1, 2014). Subscribe on the right side of the page for the complete text.
The proverbial Wall Street adage that urges investors to “Sell in May, and go away” in order to avoid a seasonally volatile period from May to October has driven speculative trading strategies for generations. The basic premise behind the plan revolves around the idea that people have better things to do during the spring and summer months, so they sell stocks. Once the weather cools off, the thought process reverses as investors renew their interest in stocks during November. If investing was as easy as selling stocks on May 1 st and then buying them back on November 1st, then we could all caravan in yachts to our private islands while drinking from umbrella-filled coconut drinks. Regrettably, successful investing is not that simple and following naïve strategies like these generally don’t work over the long-run.
Even if you believe in market timing and seasonal investing (see Getting Off the Market Timing Treadmill ), the prohibitive transaction costs and tax implications often strip away any potential statistical advantage.
Unfortunately for the bears, who often react to this type of voodoo investing, betting against the stock market from May – October during the last two years has been a money-losing strategy. Rather than going away, investors have been better served to “Buy in May, and tap dance away.” More specifically, the S&P 500 index has increased in each of the last two years, including a +10% surge during the May-October period last year.
Nervous? Why Invest Now?
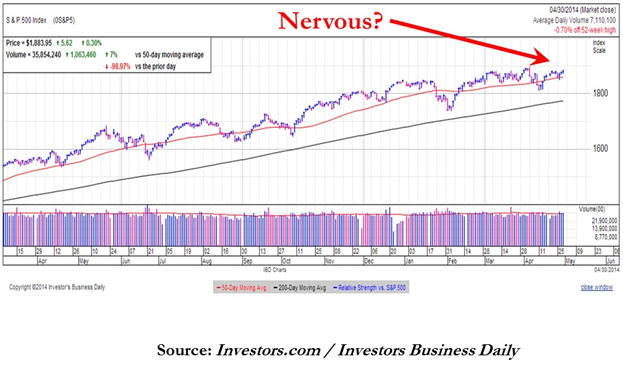
With the weak recent economic GDP figures and stock prices off by less than 1% from their all-time record highs, why in the world would investors consider investing now? Well, for starters, one must ask themselves, “What options do I have for my savings…cash?” Cash has been and will continue to be a poor place to hoard funds, especially when interest rates are near historic lows and inflation is eating away the value of your nest-egg like a hungry sumo wrestler. Anyone who has completed their income taxes last month knows how pathetic bank rates have been, and if you have pumped gas recently, you can appreciate the gnawing impact of escalating gasoline prices.
While there are selective opportunities to garner attractive yields in the bond market, as exploited in Sidoxia Fusion strategies, strategist and economist Dr. Ed Yardeni points out that equities have approximately +50% higher yields than corporate bonds. As you can see from the chart below, stocks (blue line) are yielding profits of about +6.6% vs +4.2% for corporate bonds (red line). In other words, for every $100 invested in stocks, companies are earning $6.60 in profits on average, which are then either paid out to investors as growing dividends and/or reinvested back into their companies for future growth.
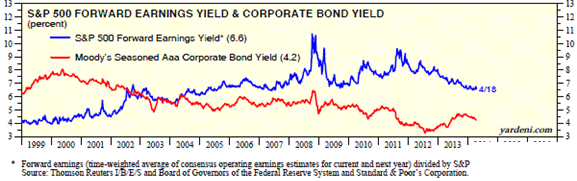
Source: Dr. Ed’s Blog
Hefty profit streams have resulted in healthy corporate balance sheets, which have served as ammunition for the improving jobs picture. At best, the economic recovery has moved from a snail’s pace to a tortoise’s pace, but nevertheless, the unemployment rate has returned to a more respectable 6.7% rate. The mended economy has virtually recovered all of the approximately 9 million private jobs lost during the financial crisis (see chart below) and expectations for Friday’s jobs report is for another +220,000 jobs added during the month of April.
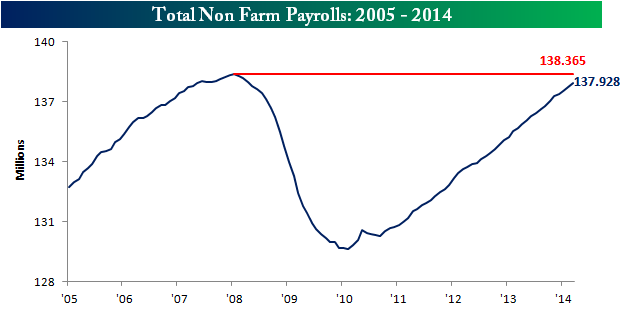
Source: Bespoke
Wondrous Wing Woman
Investing can be scary for some individuals, but having an accommodative Fed Chair like Janet Yellen on your side makes the challenge more manageable. As I’ve pointed out in the past (with the help of Scott Grannis), the Fed’s stimulative ‘Quantitative Easing’ program counter intuitively raised interest rates during its implementation. What’s more, Yellen’s spearheading of the unprecedented $40 billion bond buying reduction program (a.k.a., ‘Taper’) has unexpectedly led to declining interest rates in recent months. If all goes well, Yellen will have completed the $85 billion monthly tapering by the end of this year, assuming the economy continues to expand.
In the meantime, investors and the broader financial markets have begun to digest the unwinding of the largest, most unprecedented monetary intervention in financial history. How can we tell this is the case? CEO confidence has improved to the point that $1 trillion of deals have been announced this year, including offers by Pfizer Inc. – PFE ($100 billion), Facebook Inc. – FB ($19 billion), and Comcast Corp. – CMCSA ($45 billion).

Source: Entrepreneur
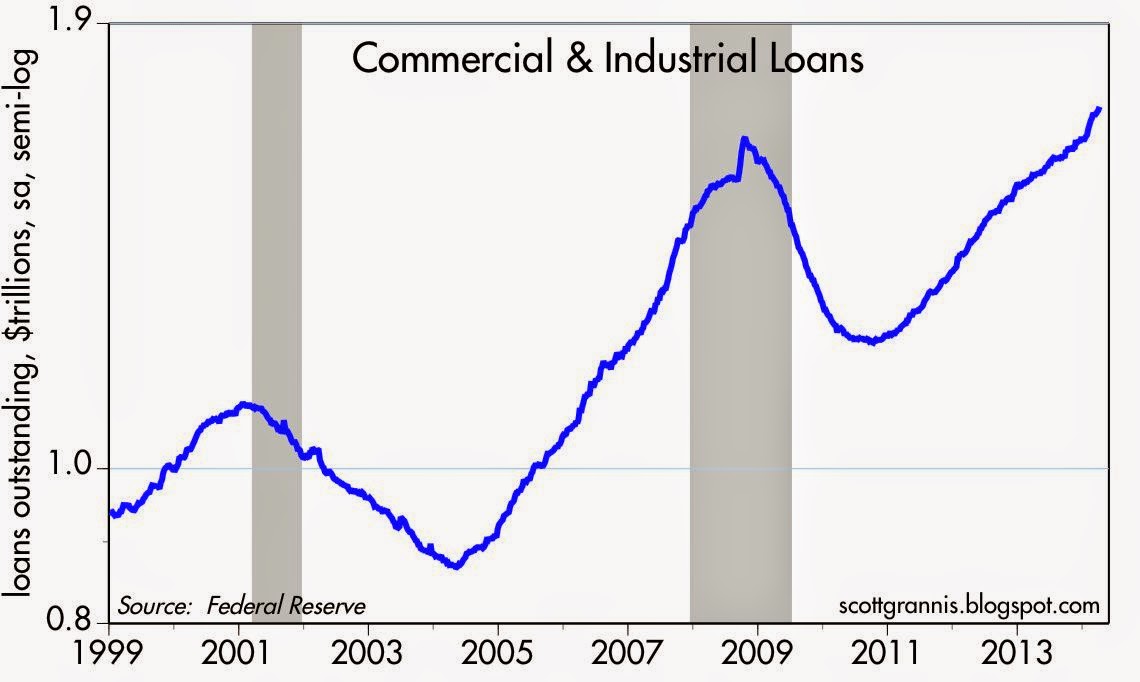
Banks are feeling more confident too, and this is evident by the acceleration seen in bank loans. After the financial crisis, gun-shy bank CEOs fortified their balance sheets, but with five years of economic expansion under their belts, the banks are beginning to loosen their loan purse strings further (see chart below).
The coast is never completely clear. As always, there are plenty of things to worry about. If it’s not Ukraine, it can be slowing growth in China, mid-term elections in the fall, and/or rising tensions in the Middle East. However, for the vast majority of investors, relying on calendar adages (i.e., selling in May) is a complete waste of time. You will be much better off investing in attractively priced, long-term opportunities, and then tap dance your way to financial prosperity.
Wade W. Slome, CFA, CFP®
Plan. Invest. Prosper.
DISCLOSURE: Sidoxia Capital Management (SCM) and some of its clients hold positions in PFE, CMCSA, and certain exchange traded funds (ETFs), but at the time of publishing SCM had no direct position in FB or any other security referenced in this article. No information accessed through the Investing Caffeine (IC) website constitutes investment, financial, legal, tax or other advice nor is to be relied on in making an investment or other decision. Please read disclosure language on IC Contact page.
Bernanke: Santa Claus or Grinch?

I’ve written plenty about my thoughts on the Fed (see Fed Fatigue) and all the blathering from the media talking heads. Debates about the timing and probability of a Fed “taper” decision came to a crescendo in the recent week. As is often the case, the exact opposite of what the pundits expected actually happened. It was not a huge surprise the Federal Reserve initiated a $10 billion tapering of its $85 billion monthly bond buying program, but going into this week’s announcement, the betting money was putting their dollars on the status quo.
With the holiday season upon us, investors must determine whether the tapered QE1/QE2/QE3 gifts delivered by Bernanke are a cause for concern. So the key question is, will this Santa Claus rally prance into 2014, or will the Grinch use the taper as an excuse to steal this multi-year bull market gift away?
Regardless of your viewpoint, what we did learn from this week’s Fed announcement is that this initial move by the Fed will be a baby step, reducing mortgage-backed and Treasury security purchases by a measly $5 billion each. I say that tongue in cheek because the total global bond market has been estimated at about $80,000,000,000,000 (that’s $80 trillion).
As I’ve pointed out in the past, the Fed gets way too much credit (blame) for their impact on interest rates (see Interest Rates: Perception vs Reality). Interest rates even before this announcement were as high/higher than when QE1 was instituted. What’s more, if the Fed has such artificial influence over interest rates, then why do Austria, Belgium, Canada, Denmark, Finland, France, Germany, Japan, Netherlands, Sweden, and Switzerland all have lower 10-year yields than the U.S.? Maybe their central banks are just more powerful than our Fed? Unlikely.
Dow 128,000 in 2053
Readers of Investing Caffeine know I have followed the lead of investing greats like Warren Buffett and Peter Lynch, who believe trying to time the markets is a waste of your time. In a recent Lynch interview, earlier this month, Charlie Rose asked for Lynch’s opinion regarding the stock market, given the current record high levels. Here’s what he had to say:
“I think the market is fairly priced on what is happening right now. You have to say to yourself, is five years from now, 10 years from now, corporate profits are growing about 7 or 8% a year. That means they double, including dividends, about every 10 years, quadruple every 20, go up 8-fold every 40. That’s the kind of numbers you are interested in. The 10-year bond today is a little over 2%. So I think the stock market is the best place to be for the next 10, 20, 30 years. The next two years? No idea. I’ve never known what the next two years are going to bring.”
READ MORE ABOUT PETER LYNCH HERE
Guessing is Fun but Fruitless
I freely admit it. I’m a stock-a-holic and member of S.A. (Stock-a-holic’s Anonymous). I enjoy debating the future direction of the economy and financial markets, not only because it is fun, but also because without these topics my blog would likely go extinct. The reality of the situation is that my hobby of thinking and writing about the financial markets has no direct impact on my investment decisions for me or my clients.
There is no question that stocks go down during recessions, and an average investor will likely live through at least another half-dozen recessions in their lifetime. Unfortunately, speculators have learned firsthand about the dangers of trading based on economic and/or political headlines during volatile cycles. That doesn’t mean everyone should buy and do nothing. If done properly, it can be quite advantageous to periodically rebalance your portfolio through the use of various valuation and macro metrics as a means to objectively protect/enhance your portfolio’s performance. For example, cutting exposure to cyclical and debt-laden companies going into an economic downturn is probably wise. Reducing long-term Treasury positions during a period of near-record low interest rates (see Confessions of a Bond Hater) as the economy strengthens is also likely a shrewd move.
As we have seen over the last five years, the net result of investor portfolio shuffling has been a lot of pain. The acts of panic-selling caused damaging losses for numerous reasons, including a combination of agonizing transactions costs; increased inflation-decaying cash positions; burdensome taxes; and a mass migration into low-yielding bonds. After major indexes have virtually tripled from the 2009 lows, many investors are now left with the gut-wrenching decision of whether to get back into stocks as the markets reach new highs.
As the bulls continue to point to the scores of gifts still lying under the Christmas tree, the bears are left hoping that new Fed Grinch Yellen will come and steal all the presents, trees, and food from the planned 2014 economic feast. There are still six trading days left in the year, so Santa Bernanke cannot finish wrapping up his +30% S&P 500 total return gift quite yet. Nevertheless, ever since the initial taper announcement, stocks have moved higher and Bernanke has equity investors singing “Joy to the World!”
Wade W. Slome, CFA, CFP®
Plan. Invest. Prosper.
DISCLOSURE: Sidoxia Capital Management (SCM) and some of its clients hold positions in certain exchange traded funds (ETFs), but at the time of publishing SCM had no direct position in any other security referenced in this article. No information accessed through the Investing Caffeine (IC) website constitutes investment, financial, legal, tax or other advice nor is to be relied on in making an investment or other decision. Please read disclosure language on IC Contact page.
Perception vs. Reality: Interest Rates & the Economy

There is a difference between perception and reality, especially as it relates to the Federal Reserve, the economy, and interest rates.
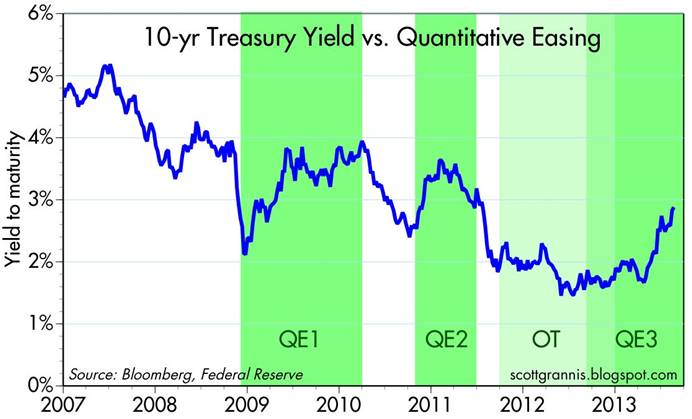
Perception: The common perception reflects a belief that Quantitative Easing (QE) – the Federal Reserve’s bond buying program – has artificially stimulated the economy and financial markets through lower interest rates. The widespread thinking follows that an end to tapering of QE will lead to a crash in the economy and financial markets.
Reality: As the chart below indicates, interest rates have risen during each round of QE (i.e., QE1/QE2/QE3) and fallen after the completion of each series of bond buying (currently at a pace of $85 billion per month in purchases). That’s right, the Federal Reserve has actually failed on its intent to lower interest rates. In fact, the yield on the 10-year Treasury Note stands at 2.94% today, while at the time QE1 started five years ago, on December 16, 2008, the 10-year rate was dramatically lower (~2.13%). Sure, the argument can be made that rates declined in anticipation of the program’s initiation, but if that is indeed the case, the recent rate spike of the 10-year Treasury Note to the 3.0% level should reverse itself once tapering begins (i.e., interest rates should decline). Wow, I can hardly wait for the stimulative effects of tapering to start!
Source: Calafia Beach Pundit
Fact or Fiction? QE Helps Economy
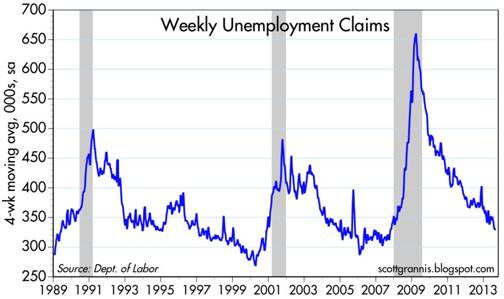
Taken from a slightly different angle, if you consider the impact of the Federal Reserve’s actions on the actual economy, arguably there are only loose connections. More specifically, if you look at the jobs picture, there is virtually NO correlation between QE activity and job creation (see unemployment claims chart below). There have been small upward blips along the QE1/QE2/QE3 path, but since the beginning of 2009, the declining trend in unemployment claims looks like a black diamond ski slope.
Source: Calafia Beach Pundit
Moreover, if you look at a broad spectrum of economic charts since QE1 began, including data on capital spending, bank loans, corporate profits, vehicle sales, and other key figures related to the economy, the conclusion is the same – there is no discernible connection between the economic recovery and the Federal Reserve’s quantitative easing initiatives.
I know many investors are highly skeptical of the stock market’s rebound, but is it possible that fundamental economic laws of supply and demand, in concert with efficient capital markets, could have something to do with the economic recovery? Booms and busts throughout history have come as a result of excesses and scarcities – in many cases assisted by undue amounts of fear and greed. We experienced these phenomena most recently with the tech and housing bubbles in the early and middle parts of last decade. Given the natural adjustments of supply and demand, coupled with the psychological scars and wounds from the last financial crisis, there is no clear evidence of a new bubble about to burst.
While it’s my personal view that many government initiatives, including QE, have had little impact on the economy, the Federal Reserve does have the ability to indirectly increase business and consumer confidence. Ben Bernanke clearly made this positive impact during the financial crisis through his creative implementation of unprecedented programs (TARP, TALF, QE, Twist, etc.). The imminent tapering and eventual conclusion of QE may result in a short-term hit to confidence, but the economy is standing on a much stronger economic foundation today. Making Ben Bernanke a scapegoat for rising interest rates is easy to do, but in actuality, an improving economy on stronger footing will likely have a larger bearing on the future direction of interest rates relative to any upcoming Fed actions.
Doubters remain plentiful, but the show still goes on. Not only are banks and individuals sitting on much sturdier and healthier balance sheets, but corporations are running lean operations that are reporting record profit margins while sitting on trillions of dollars in cash. In addition, with jobs on a slow but steady path to recovery, confidence at the CEO and consumer levels is also on the rise.
Despite all the negative perceptions surrounding the Fed’s pending tapering, reality dictates the impact from QE’s wind-down will likely to be more muted than anticipated. The mitigation of monetary easing is more a sign of sustainable economic strength than a sign of looming economic collapse. If this reality becomes the common perception, markets are likely to move higher.
Wade W. Slome, CFA, CFP®
Plan. Invest. Prosper.
DISCLOSURE: Sidoxia Capital Management (SCM) and some of its clients hold positions in certain exchange traded funds (ETFs), but at the time of publishing, SCM had no direct position in any other security referenced in this article. No information accessed through the Investing Caffeine (IC) website constitutes investment, financial, legal, tax or other advice nor is the information to be relied on in making an investment or other decision. Please read disclosure language on IC Contact page.
QE: The Greatest Thing Since Sliced Bread*

Quantitative easing (QE), or the Federal Reserve’s bond buying program, has been a spectacular success. Arguably, the greatest innovation since sliced bread. Don’t believe me? I mean, if you listen to many of the experts, strategists, economists, and blogosphere pundits, the magical elixir of QE can be the only explanation rationalizing the multi-year economic recovery and stock market boom. Don’t believe me? Well, apparently many of the bearish pros make sure to credit QE for all our financial/economic positives. For example…
- QE is the reason the stock market is near all-time record highs.
- QE created seven million jobs in the U.S. over the last four years.
- QE turned around the housing market.
- QE turned around the auto market.
- QE weakened the U.S. dollar, resulting in flourishing exports.
- QE has lowered borrowing rates, thereby cleansing consumer balance sheets through deleveraging.
- QE is the reason Facebook Inc. (FB) hired 1,323 employees over the last year.
- QE is the reason Google Inc. (GOOG) has spent $7.8 billion on R&D over the last year.
- QE explains why McDonald’s Corp. (MCD) plans to open more than 1,400 stores this year.
- QE explains why Warren Buffett and 3G capital paid $28 billion to buy Heinz.
- QE is the reason Elon Musk and Tesla Motors (TSLA) invented the model S electric vehicle.
- QE exhibits why Target Corp. (TGT) is expanding outside the U.S. into Canada.
- QE is the reason why S&P 500 companies are expected to pay $300 billion in dividends this year.
- QE is the reason why S&P 500 companies were buying back shares at a $400 billion clip this year.
- QE is the basis for corporations spending billions on efficiency enhancing cloud-based services.
- QE led to a record number of new FDA drug approvals last year.
- QE has caused a natural gas production boom in numerous shale regions.
Wow…the list goes on and on! Heck, I even hear QE can take the corrosion off of a rusted car battery. Given how incredible this QE stuff is, why even consider tapering QE? Financial markets have been volatile on the heels of tapering the 3rd iteration of quantitative easing (QE3), but why slow QE3, when the FED could add more awesomeness with QE4, QE10, QE 100, and QE 1,000?
All of this QE talk is so wonderful, but unfortunately, according to all the bearish pundits, QE has created an artificial sugar high, thus creating an asset bubble that is going to end in a disastrous cratering of financial markets.
I know it’s entirely possible that QE may have absolutely nothing to do with the financial market recovery (other than a bid under Treasury & mortgage backed security prices), and also has no bearing on why I buy or sell stocks, but I guess I will need to hide in a cave when QE3 tapering begins. Although the end of dividends, share buybacks, housing/auto recoveries, acquisitions, expansion, innovation, etc., caused by QE tapering sure does not sound like a cheery outcome, at least I still have a loaf of sliced bread to make a sandwich.
*DISCLOSURE: For those readers not familiar with my writing style, I have been known to use a healthy dose of sarcasm. Call me if you want a deeper explanation.
Wade W. Slome, CFA, CFP®
Plan. Invest. Prosper.
DISCLOSURE II : Sidoxia Capital Management (SCM) and some of its clients hold positions in certain exchange traded funds (ETFs) and GOOG, but at the time of publishing, SCM had no direct position in FB, TSLA, MCD, BRKA, TGT, or any other security referenced in this article. No information accessed through the Investing Caffeine (IC) website constitutes investment, financial, legal, tax or other advice nor is to be relied on in making an investment or other decision. Please read disclosure language on IC Contact page
Jobs and the DMV Economy

If you have ever gone to get your driver’s license at the Department of Motor Vehicles (DMV)…you may still be waiting in line? It’s a painful but often a mandatory process, and in many ways the experience feels a lot like the economic recovery we currently have been living through over the last four years. Steady progress is being made, but in general, people hardly notice the economy moving forward.
My geographic neighbor and blogger here in Orange County, California (Bill McBride – Calculated Risk) has some excellent visuals that compare our sluggish DMV economy with previous economic cycles dating back to 1948:
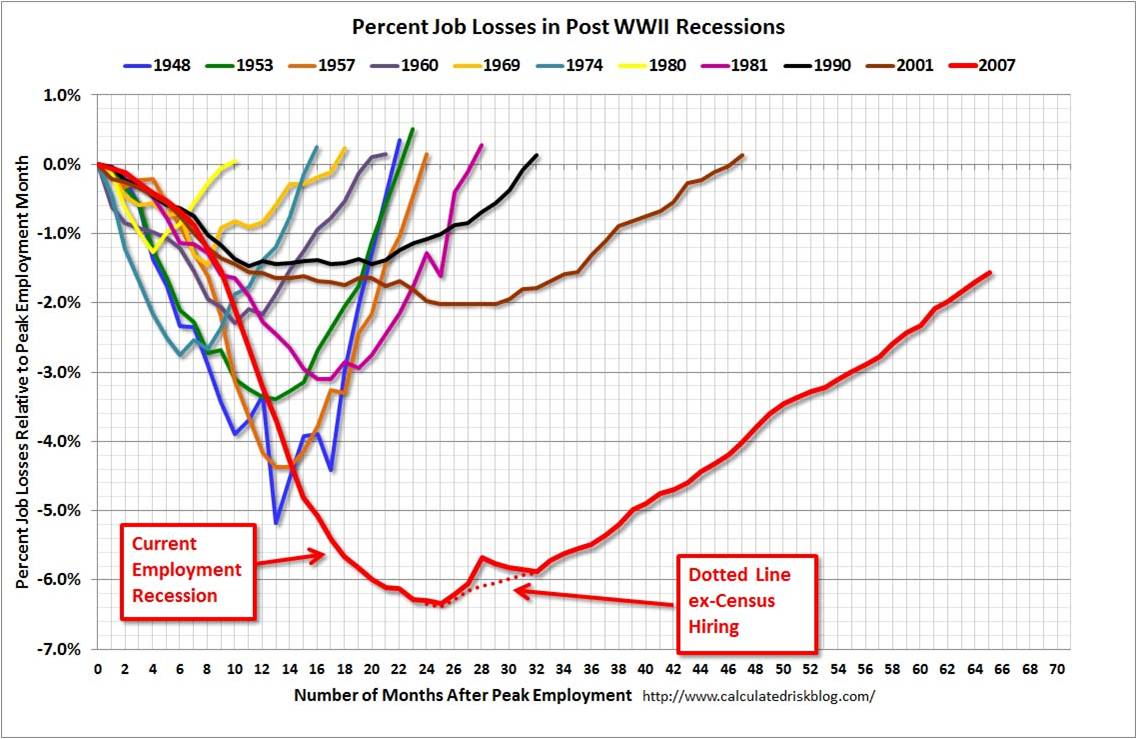
Source: Calculated Risk
As you can see from the chart above, the current economic recovery (red-line), as measured by job losses, is the slowest comeback in more than a half-century. Basically, over a two year period, the U.S. lost about nine million jobs, and during the following three years the economy regained approximately seven million of those jobs – still digging out of the hole. Last Friday’s June jobs report was welcomed, as it showed net jobs of +195,000 were added during the month, and importantly the previous two months were revised higher by another +70,000 jobs. These data points combined with last month’s Fed’s QE3 tapering comments by Ben Bernanke help explain why the continued rout in 10 year Treasury rates has continued in recent weeks, propelling the benchmark rate to 2.71% – almost double the 1.39% rate hit last year amidst continued European financial market concerns.
As with most recessions or crashes, the bursting of the bubble (i.e., damage) occurs much faster than the inflation (i.e., recovery), and McBride’s time series clearly shows this fact:

Source: Calculated Risk
While pessimists point to the anemic pace of the current recovery, the glass half-full people (myself included) appreciate that the sluggish rebound is likely to last longer than prior recoveries. There are two other key dynamics underlying the reported employment figures:
- Continued Contraction in Government Workers: Excessive government debt and deficits have led to continued job losses – state and local job losses appear to be stabilizing but federal cuts are ongoing.
- Decline in the Labor Force Participation Rate: Discouraged workers and aging Baby Boomer demographics have artificially lowered the short-term unemployment figures because fewer people are looking for work. If economic expansion accelerates, the participation contraction trend is likely to reverse.
Skepticism Reigns Supreme
Regardless of the jobs picture and multi-year expansion, investors and business managers alike remain skeptical about the sustainability of the economic recovery. Anecdotally I encounter this sentiment every day, but there are other data points that bolster my assertion. Despite the stock market more than doubling in value from the lows of 2009, CNBC viewer ratings are the weakest in about 20 years (see Value Walk) and investments in the stock market are the lowest in 15 years (see Gallup poll chart below):

Source: Gallup
Why such skepticism? Academic research in behavioral finance highlights innate flaws in human decision-making processes. For example, humans on average weigh losses twice as much as gains as economist and Nobel prizewinner Daniel Kahneman explains in his book Thinking Fast and Slow (see Investing Caffeine article: Decision Making on Freeways and in Parking Lots). Stated differently, the losses from 2008-2009 are still too fresh in the minds of Americans. Until the losses are forgotten, and/or the regret of missing gains becomes too strong, many investors and managers will fearfully remain on the sideline.
The speed of our economic recovery is as excruciatingly agonizing, and so is waiting in line at the DMV. The act of waiting can be horrific, but obtaining a driver’s license is required for driving and investing is necessary for retirement. If you don’t want to go to investing jail, then you better get in the investing line now before job growth accelerates, because you don’t want to be sent to the back of the line where you will have to wait longer.
Wade W. Slome, CFA, CFP®
Plan. Invest. Prosper.
DISCLOSURE: Sidoxia Capital Management (SCM) and some of its clients hold positions in certain exchange traded funds (ETFs), but at the time of publishing, SCM had no direct position in any other security referenced in this article. No information accessed through the Investing Caffeine (IC) website constitutes investment, financial, legal, tax or other advice nor is to be relied on in making an investment or other decision. Please read disclosure language on IC Contact page.
Fed Fatigue Setting In

Uncle…uncle! There you have it – I have finally cried “uncle” because I cannot take it anymore. I don’t think I can listen to another panel or read another story debating about the timing of Fed “tapering”, or heaven forbid the Fed actually “tighten” the Federal Funds rate (i.e., increasing the targeted rate for inter-bank lending). Type in the words “Bernanke” and “tapering” into Google and you will get back more than 41,000,000 results. The build up to the 600-word FOMC (Federal Open Market Committee) statement was almost deafening, so much so that live coverage of Federal Reserve Chairman Ben Bernanke was available at your fingertips:

Source: Yahoo! Finance
Like a toddler (or a California-based, investment blog writer) going to the doctor’s office to receive an inoculation, the anxiety and mental anguish caused in anticipation of the event is often more painful than the actual injection. As I highlighted in a previous Investing Caffeine article, the 1994 interest rate cycle wasn’t Armageddon for equity markets, and the same can be said for the rate hikes from 1.0% to 5.25% in the 2004-20006 period (see chart below). Even if QE3 ends in mid-2014 and the new Federal Reserve Chairman (thank you President Obama) raises rates in 2015, this scenario would not be the first (or last) time the Federal Reserve has tightened monetary policy.
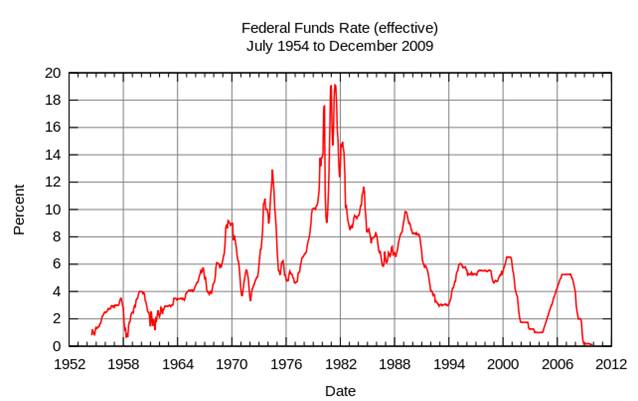
Source: Wikipedia
Short Memories – What Have You Done for Me Lately?
People are quick to point out the one-day -350 Dow point loss earlier this week, but many of them forget about the +3,000 point moon shot in the Dow Jones Industrial index that occurred in six short months (November 2012 – May 2013). The same foggy recollection principle applies to interest rates. The recent rout in 10-year Treasury prices is easily recalled as rates have jumped from 1.5% to 2.5% over the last year, however amnesia often sets in for others if you ask them where rates were a few years ago. It’s easy to forget that 30-year fixed rate mortgages exceeded 5% and the 10-year reached 4% just three short years ago.
Bernanke: The Center of the Universe?
Does Ben Bernanke deserve credit for implementing extraordinary measures during extraordinary times during the 2008-09 financial crisis? Absolutely. But should every man, women, and child wait with bated breath to see if a word change or tonal adjustment is made in the eight annual FOMC meetings?
Like the public judging Ben Bernanke, my Sidoxia clients probably give me too much credit when things go well and too much blame when things don’t. I love how Bernanke gets blamed/credited for the generational low interest rates caused by his money printing ways and QE punch bowl tactics. Last I checked, the interest rate downtrend has been firmly in place over the last three decades, well before Bernanke came into the Fed and worked his monetary magic. How much credit/blame are we forgetting to give former Federal Reserve Chairmen Paul Volcker, Alan Greenspan, and other government policy-makers? Regardless of what happens economically for the remainder of 2013, Bernanke will do whatever he can to solidify his legacy in the waning sunset months of his term.
Another forgotten fact I like to point out: There is more than one central banker living on this planet. If you haven’t been asleep over the last few decades, our financial markets have increasingly become globally interconnected with the assistance of technology. I know our 10-year Treasury rates are hovering around 2.50%, and our egotistical patriotism leads us to hail Bernanke as a monetary god, but don’t any other central bankers or government officials around the world deserve any recognition for achieving yields even lower than ours? Here’s a partial list (June 22, 2013 – Financial Times):
- Japan – 0.86%
- Germany – 1.67%
- Canada – 2.33%
- U.K. – 2.31%
- France – 2.27%
- Sweden – 2.15%
- Austria – 2.09%
- Switzerland – 0.92%
- Netherlands – 2.07%
Although it may be fun to look at Ben Bernanke as our country’s financial Superman who is there to save the day, there are a lot more important factors to consider than the 47 words added and 19 subtracted from the latest FOMC statement. If investing was as easy as following central bank monetary policy, everyone would be continually jet setting to their private islands. Rather than wasting your time listening to speculative blathering about direction of Fed monetary policy, why not focus on finding solid investment ideas and putting a long-term investment plan in place. Now please excuse me – Fed fatigue has set in and I need to take a nap.
Wade W. Slome, CFA, CFP®
Plan. Invest. Prosper.
DISCLOSURE: Sidoxia Capital Management (SCM) and some of its clients hold positions in certain exchange traded funds (ETFs) and GOOG, but at the time of publishing, SCM had no direct position in any other security referenced in this article. No information accessed through the Investing Caffeine (IC) website constitutes investment, financial, legal, tax or other advice nor is to be relied on in making an investment or other decision. Please read disclosure language on IC Contact page.
1994 Bond Repeat or 2013 Stock Defeat?

Interest rates are moving higher, bond prices are collapsing, and fear regarding a stock market plunge is palpable. Sound like a recent news headline or is this a description of a 1994 financial market story? For those with a foggy, double-decade-old memory, here is a summary of the 1994 economic environment:
- The economy registered its 34th month of expansion and the stock market was on a record 40-month advance
- The Federal Reserve embarked on its multi-hike, rate-tightening monetary policy
- The 10-year Treasury note exhibited an almost 2.5% jump in yields
- Inflation was low with a threat of rising inflation lurking in the background
- An upward sloping yield curve encouraged speculative bond carry-trade activity (borrow short, invest long)
- Globalization and technology sped up the pace of price volatility
Many of these listed items resemble factors experienced today, but bond losses in 1994 were much larger than the losses of 2013 – at least so far. At the time, Fortune magazine called the 1994 bond collapse the worst bond market loss in history, with losses estimated at upwards of $1.5 trillion. The rout started with what might have appeared as a harmless 0.25% increase in the Federal Funds rate (the rate that banks lend to each other) from 3% to 3.25% in February 1994. By the time 1994 came to a close, acting Federal Reserve Chairman Alan Greenspan had jacked up this main monetary tool by 2.5%.
Rising rates may have acted as the flame for bond losses, but extensive use of derivatives and leverage acted as the gasoline. For example, over-extended Eurobond positions bought on margin by famed hedge fund manager Michael Steinhardt of Steinhardt Partners lead to losses of about-30% (or approximately $1.5 billion). Renowned partner of Omega Partners, Leon Cooperman, took a similar beating. Cooperman’s $3 billion fund cratered -24% during the first half of 1994. Insurance company bond portfolios were hit hard too, as collective losses for the industry exceeded $20 billion, or more than the claims paid for Hurricane Andrew’s damage. Let’s not forget the largest casualty of this era – the public collapse of Orange County, California. Poor derivatives trades led to $1.7 billion in losses and ultimately forced the county into bankruptcy.
There are plenty of other examples, but suffice it to say, the pain felt by other bond investors was widespread as a massive number of margin calls caused a snowball of bond liquidations. The speed of the decline was intensified as bond holders began selling short and using derivatives to hedge their portfolios, accelerating price declines.
Just as the accommodative interest rate punch bowl was eventually removed by Greenspan, so too is Ben Bernanke (current Fed Chairman) threatening to do today. Even if Bernanke unleashes a cold-turkey tapering of the $85 billion per month in bond-purchases, massive losses in bond values won’t necessarily mean catastrophe for stock values. For evidence, one needs to look no further than this 1994-1995 chart of the stock market:
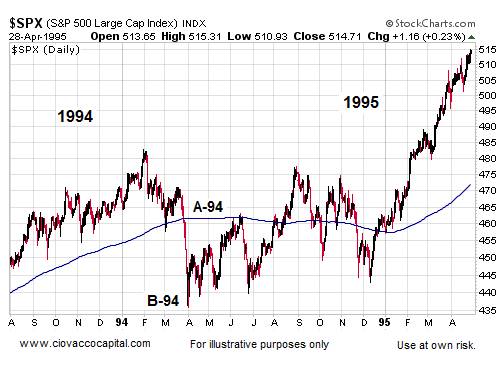
Source: Ciovaccocapital.com
Volatility for stocks definitely increased in 1994 with the S&P 500 index correcting about -10% early in the year. But as you can see, by the end of the year the market was off to the races, tripling in value over the next five years. Volatility has been the norm for the current bull market rally as well. Despite the more than doubling in stock prices since early 2009, we have experienced two -20% corrections and one -10% pullback.
What’s more, the onset of potential tapering is completely consistent with core economic principles. Capitalism is built on free trading markets, not artificial intervention. Extraordinary times required extraordinary measures, but the probabilities of a massive financial Armageddon have been severely diminished. As a result, the unprecedented scale of quantitative easing (QE) will eventually become more harmful than beneficial. The moral of the story is that volatility is always a normal occurrence in the equity markets, therefore any significant stock pullback associated with potential bond tapering (or fed fund rate hikes) shouldn’t be viewed as the end of the world, nor should a temporary weakening in stock prices be viewed as the end to the bull market in stocks.
Why have stocks historically provided higher returns than bonds? The short answer is that stocks are riskier than bonds. The price for these higher long-term returns is volatility, and if investors can’t handle volatility, then they shouldn’t be investing in stocks.
If you are an investor that thinks they can time the market, you wouldn’t be wasting your time reading this article. Rather, you’d be spending time on your personal island while drinking coconut drinks with umbrellas (see Market Timing Treadmill).
Although there are some distinct similarities between the economic backdrop of 1994 and 2013, there are quite a few differences also. For starters, the economy was growing at a much healthier clip then (+4.1% GDP growth), which stoked inflationary fears in the mind of Greenspan. Moreover, unemployment was quite low (5.5% by year-end vs. 7.6% today) and the Fed did not communicate forward looking Fed policy back then.
It’s unclear if the recent 50 basis point ascent in 10-year Treasury rates was just an appetizer for what’s to come, but simple mathematics indicate there is really only one direction left for interest rates to go…higher. If history repeats itself, it will likely be bond investors choking on higher rates (not stock investors). For the sake of optimistic bond speculators, I hope Ben Bernanke knows the Heimlich maneuver. Studying history may help bond bulls avoid indigestion.
Wade W. Slome, CFA, CFP®
Plan. Invest. Prosper.
DISCLOSURE: Sidoxia Capital Management (SCM) and some of its clients hold positions in certain exchange traded funds (ETFs), but at the time of publishing SCM had no direct position in any other security referenced in this article. No information accessed through the Investing Caffeine (IC) website constitutes investment, financial, legal, tax or other advice nor is to be relied on in making an investment or other decision. Please read disclosure language on IC Contact page.
What’s Going on with This Crazy Market?!

The massive rally of the stock market since March 2009 has been perplexing for many, but the state of confusion has reached new heights as the stock market has surged another +2.0% in May, surpassing the Dow 15,000 index milestone and hovering near all-time record highs. Over the last few weeks, the volume of questions and tone of disbelief emanating from my social circles has become deafening. Here are some of the questions and comments I’ve received lately:
“Wade, why in the heck is the market up so much?”; “This market makes absolutely no sense!”; “Why should I buy at the peak when I can buy at the bottom?”; “With all this bad news, when is the stock market going to go down?”; “You must be shorting (betting against) this market, right?”
If all the concerns about the Benghazi tragedy, IRS conservative targeting, and Federal Reserve bond “tapering” are warranted, then it begs the question, “How can the Dow Jones and other indexes be setting new all-time highs?” In short, here are a few reasons:
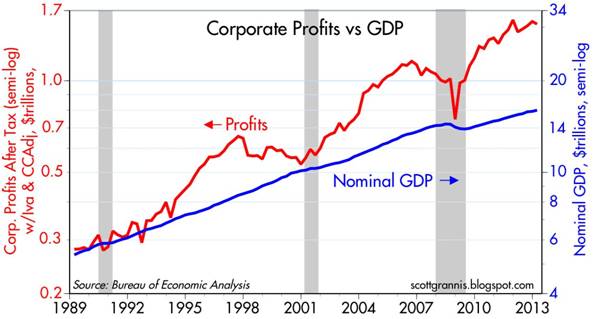
You hear a lot of noise on TV and read a lot of blathering in newspapers/blogs, but what you don’t hear much about is how corporate profits have about tripled since the year 2000 (see red line in chart above), and how the profit recovery from the recent recession has been the strongest in 55 years (Scott Grannis). The profit collapse during the Great Recession was closely chronicled in nail-biting detail, but a boring profit recovery story sells a lot less media advertising, and therefore gets swept under the rug.
II.) Reasonable Prices (Comparing Apples & Oranges):
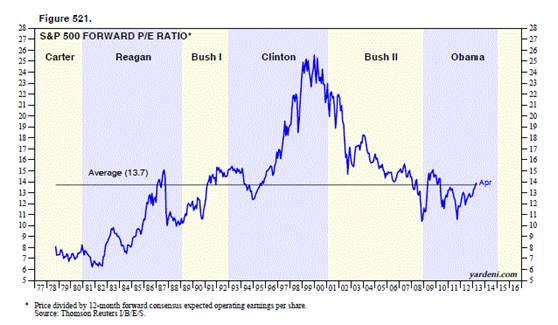
Source: Dr. Ed’s Blog
The Price-Earnings ratio (P/E) is a general barometer of stock price levels, and as you can see from the chart above (Ed Yardeni), current stock price levels are near the historical average of 13.7x – not at frothy levels experienced during the late-1990s and early 2000s.
Comparing Apples & Oranges:

At the most basic level of analysis, investors are like farmers who choose between apples (stocks) and oranges (bonds). On the investment farm, growers are generally going to pick the fruit that generates the largest harvest and provide the best return. Stocks (apples) have historically offered the best prices and yielded the best harvests over longer periods of time, but unfortunately stocks (apples) also have wild swings in annual production compared to the historically steady crop of bonds (oranges). The disastrous apple crop of 2008-2009 led a massive group of farmers to flood into buying a stable supply of oranges (bonds). Unfortunately the price of growing oranges (i.e., buying bonds) has grown to the highest levels in a generation, with crop yields (interest rates) also at a generational low. Even though I strongly believe apples (stocks) currently offer a better long-term profit potential, I continue to remind every farmer (investor) that their own personal situation is unique, and therefore they should not be overly concentrated in either apples (stocks) or oranges (bonds).
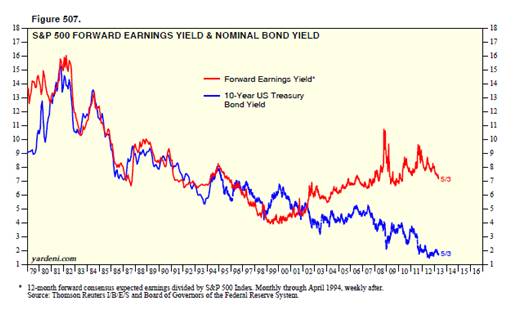
Source: Dr. Ed’s Blog
Regardless, you can see from the chart above (Dr. Ed’s Blog), the red line (stocks) is yielding substantially more than the blue line (bonds) – around 7% vs. 2%. The key for every investor is to discover an optimal balance of apples (stocks) and oranges (bonds) that meets personal objectives and constraints.
III.) Skepticism (Market Climbs a Wall of Worry):

Source: Calafia Beach Pundit
Although corporate profits are strong, and equity prices are reasonably priced, investors have been withdrawing hundreds of billions of dollars from equity funds (negative blue lines in chart above – Calafia Beach Pundit). While the panic of 2008-2009 has been extinguished from average investors’ psyches, the Recession in Europe, slowing growth in China, Washington gridlock, and the fresh memories of the U.S. financial crisis have created a palpable, nervous skepticism. Most recently, investors were bombarded with the mantra of “Selling in May, and Going Away” – so far that advice hasn’t worked so well. To buttress my point about this underlying skepticism, one need not look any further than a recent CNBC segment titled, “The Most Confusing Market Ever” (see video below):
Source: CNBC
It’s clear that investors remain skittish, but as legendary investor Sir John Templeton so aptly stated, “Bull markets are born on pessimism, grow on skepticism, mature on optimism and die on euphoria.” The sentiment pendulum has been swinging in the right direction (see previous Investing Caffeine article), but when money flows sustainably into equities and optimism/euphoria rules the day, then I will become much more fearful.
Being a successful investor or a farmer is a tough job. I’ll stop growing apples when my overly optimistic customers beg for more apples, and yields on oranges also improve. In the meantime, investors need to remember that no matter how confusing the market is, don’t put all your oranges (bonds) or apples (stocks) in one basket (portfolio) because the financial markets do not need to get any crazier than they are already.
Wade W. Slome, CFA, CFP®
Plan. Invest. Prosper.
DISCLOSURE: Sidoxia Capital Management (SCM) and some of its clients hold positions in certain exchange traded funds (ETFs), but at the time of publishing SCM had no direct position in any other security referenced in this article. No information accessed through the Investing Caffeine (IC) website constitutes investment, financial, legal, tax or other advice nor is to be relied on in making an investment or other decision. Please read disclosure language on IC Contact page.


