Posts filed under ‘economy’
Extrapolation: Dangers of the Reckless Ruler

The game of investing would be rather simple if everything moved in a straight line and economic data points could be could be connected with a level ruler. Unfortunately, the real world doesn’t operate that way – data points are actually scattered continuously. In the short-run, inflation, GDP, exchange rates, interest rates, corporate earnings, profit margins, geopolitics, natural disasters, financial crises, and an infinite number of other factors are very difficult to predict with any accurate consistency. The true way to make money is to correctly identify long-term trends and then opportunistically take advantage of the chaos by using the power of mean reversion. Let me explain.
Take for example the just-released October employment figures, which on the surface showed a blowout creation of +271,000 new jobs during the month (unemployment rate decline to 5.0%) versus the Wall Street consensus forecast of +180,000 (flat unemployment rate of 5.1%). The rise in new workers was a marked acceleration from the +137,000 additions in September and the +136,000 in August. The better-than-expected jobs numbers, the highest monthly addition since late 2014, was paraded across television broadcasts and web headlines as a blowout number, which gives the Federal Reserve and Chairwoman Janet Yellen more ammunition to raise interest rates next month at the Federal Open Market Committee meeting. Investors are now factoring in roughly a 70% probability of a +0.25% interest rate hike next month compared to an approximately 30% chance of an increase a few weeks ago.
As is often the case, speculators, traders, and the media rely heavily on their trusty ruler to connect two data points to create a trend, and then subsequently extrapolate that trend out into infinity, whether the trend is moving upwards or downwards. I went back in time to explore the media’s infatuation with limitless extrapolation in my Back to the Future series (see Part I; Part II; and Part III). More recently, weakening data in China caused traders to extrapolate that weakness into perpetuity and pushed Chinese stocks down in August by more than -20% and U.S. stocks down more than -10%, over the same timeframe.
While most of the media coverage blew the recent jobs number out of proportion (see BOOM! Big Rebound in Job Creation), some shrewd investors understand mean reversion is one of the most powerful dynamics in economics and often overrides the limited utility of extrapolation. Case in point is blogger-extraordinaire Scott Grannis (Calafia Beach Pundit) who displayed this judgment when he handicapped the October jobs data a day before the statistics were released. Here’s what Grannis said:
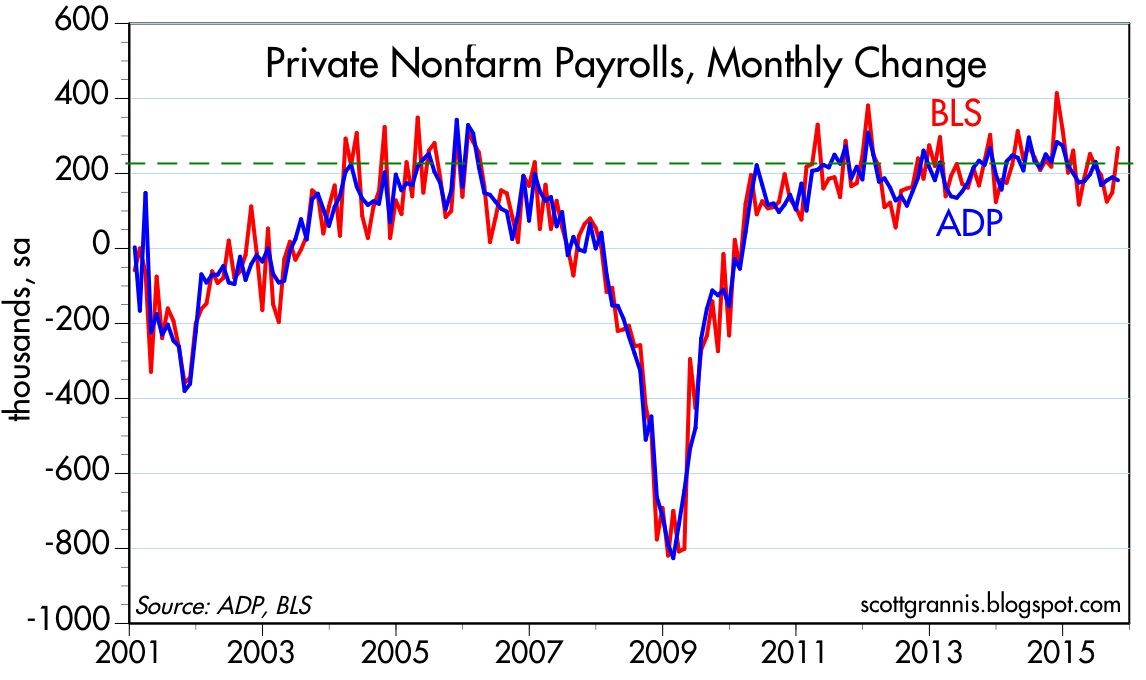
The BLS’s estimate of private sector employment tends to be more volatile than ADP’s, and both tend to track each other over time. That further suggests that the BLS jobs number—to be released early tomorrow—has a decent chance of beating expectations.
Now, Grannis may not have guaranteed a specific number, but comparing the volatile government BLS and private sector ADP jobs data (always released before BLS) only bolsters the supremacy of mean reversion. As you can see from the chart below, both sets of data have been highly correlated and the monthly statistics have reliably varied between a range of +100k to +300k job additions over the last six years. So, although the number came in higher than expected for October, the result is perfectly consistent with the “slowly-but-surely” growing U.S. economy.
Source: Calafia Beach Pundit
While I spend much more time picking stocks than picking the direction of economic statistics, even I will agree there is a high probability the Fed moves interest rates next month. But even if Yellen acts in December, she has been very clear that this rate hike cycle will be slower than previous periods due to the weak pace of economic expansion. I agree with Grannis, who noted, “Higher rates would be a confirmation of growth, not a threat to growth.” Whatever happens next month, do yourself a favor and keep the urge of extrapolation at bay by keeping your pencil and ruler in your drawer.

Wade W. Slome, CFA, CFP®
Plan. Invest. Prosper.
DISCLOSURE: Sidoxia Capital Management (SCM) and some of its clients hold positions in certain exchange traded funds (ETFs) , but at the time of publishing, SCM had no direct position in any other security referenced in this article. No information accessed through the Investing Caffeine (IC) website constitutes investment, financial, legal, tax or other advice nor is to be relied on in making an investment or other decision. Please read disclosure language on IC Contact page.
More Treats, Less Tricks

This article is an excerpt from a previously released Sidoxia Capital Management complimentary newsletter (November 2, 2015). Subscribe on the right side of the page for the complete text.
Have you finished licking the last of your Halloween chocolate-covered fingers and scheduled your next cavity-filled dental appointment? After a few challenging months, the normally spooky month of October produced an abundance of sweet treats rather than scary tricks for stock market investors. In fact, the S&P 500 index finished the month with a whopping +8.3% burst, making October the tastiest performing month since late 2010. This came in stark contrast to the indigestion experienced with the -8.7% decline over the previous two months.
What’s behind all these sweet gains? For starters, fears of a Chinese economic sugar-high ending in a crash have abated for now. With that said, “Little Red Riding Hood” is not out of the woods quite yet. Like a surprising goblin or ghost popping out to scare you at a Halloween haunted house, China could still rear its ugly head in the future due to its prominent stature as the second largest global economy. We have been forced to deal with similar on-again-off-again concerns associated with Greece.
The good news is the Chinese government and central bank are not sitting on their hands. In addition to interest rate cuts and corruption crackdowns, Chinese government officials have even recently halted its decades-long one-child policy. China’s new two-child policy is designed to spur flagging economic growth and also reverse the country’s aging demographic profile.
Also contributing to the stock market’s sugary October advances is an increasing comfort level with the Federal Reserve’s eventual interest rate increase. Just last week, the central bank released the statement from its October Federal Open Market Committee meetings stating it will determine whether it will be “appropriate” to increase interest rates at its next meetings, which take place on December 15th and 16th. Interest rate financial markets are now baking in a roughly 50% probability of a Fed interest rate hike next month. Initially, the October Fed statement was perceived negatively by investors due to fears that higher rates could potentially choke off economic growth. Within a 30 minute period after the announcement, stock prices reversed course and surged higher. Investors interpreted the Fed signal of a possible interest rate hike as an upbeat display of confidence in a strengthening economy.
As I have reiterated on numerous occasions (see also Fed Fatigue), a +0.25% increase in the Federal Funds rate from essentially a level of 0% is almost irrelevant in my eyes – just like adjusting the Jacuzzi temperature from 102 degrees down to 101 degrees is hardly noticeable. More practically speaking, an increase from 14.00% to 14.25% on a credit card interest rate will not deter consumers from spending, just like a 3.90% mortgage rising to 4.15% will not break the bank for homebuyers. On the other hand, if interest rates were to spike materially higher by 3.00% – 4.00% over a very short period of time, this move would have a much more disruptive impact, and would be cause for concern. Fortunately for equity investors, this scenario is rather unlikely in the short-run due to virtually no sign of inflation at either the consumer or worker level. Actually, if you read the Fed’s most recent statement, Fed Chairwoman Janet Yellen indicated the central bank intends to maintain interest rates below “normal” levels for “some time” even if the economy keeps chugging along at a healthy clip.
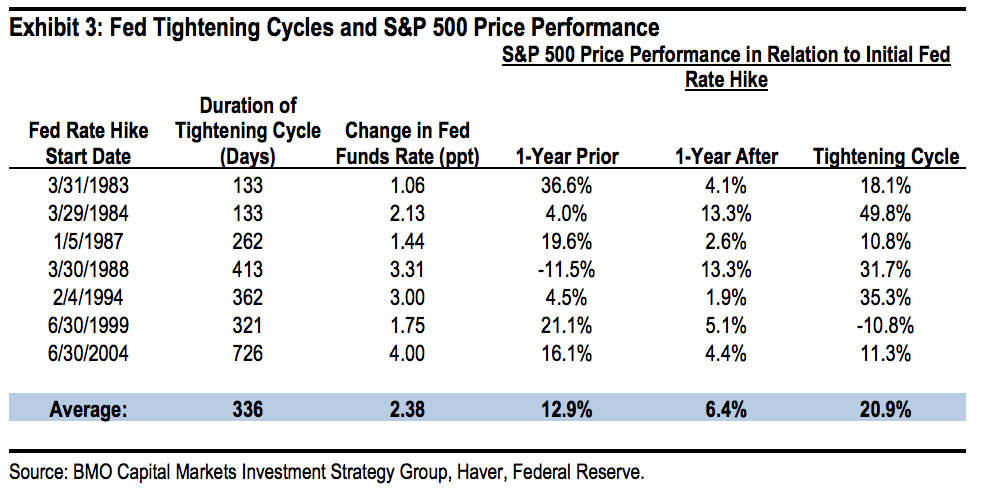
If you think my interest rate perspective is the equivalent of me whistling past the graveyard, history proves to be a pretty good guide of what normally happens after the Fed increases interest rates. Bolstering my argument is data observed over the last seven Federal Reserve interest rate hike cycles from 1983 – 2006 (see table below). As the statistics show, stock prices increased an impressive +20.9% on average over Fed interest rate “Tightening Cycles.” It is entirely conceivable that the announcement of a December interest rate hike could increase short-term volatility. We saw this rate hike fear phenomenon a few months ago, and also a few years ago in 2013 (see also Will Rising Rates Murder Market?) when Federal Reserve Chairman Ben Bernanke threatened an end to quantitative easing (a.k.a., “Taper Tantrum”), but eventually people figured out the world was not going to end and stock prices ultimately moved higher.
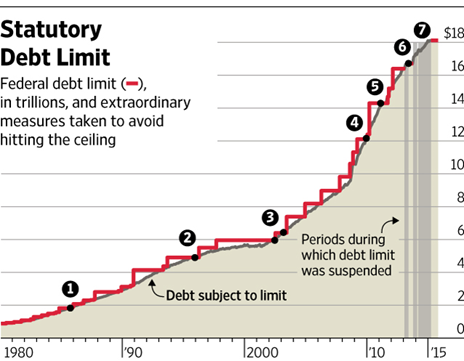
Besides increased comfort with Fed interest rate policies, another positive contributing factor to the financial market rebound was the latest Congressional approval of a two-year budget deal that prevents the government from defaulting on its debt. Not only does the deal suspend the $18.1 trillion debt limit through March 2017 (see chart below), but the legislation also lowers the chance of a government shutdown in December. Rather than creating a contentious battle for the fresh, incoming Speaker of the House (Paul Ryan), the approved budget deal will allow the new Speaker to start with a clean slate with which he can use to negotiate across a spectrum of political issues.
Source: Wall Street Journal
Remain Calm – Not Frightened
Humans, including all investors, are emotional beings, but the best investors separate fear from greed and are masters at making unemotional, objective decisions. Just as everything wasn’t a scary disaster when stocks declined during August and September, so too, the subsequent rise in October doesn’t mean everything is a bed of roses.
Every three months, thousands of companies share their financial report cards with investors, and so far with more than 65% of the S&P 500 companies reporting their results this period, corporate America is not making the honor roll. Collapsing commodity prices, including oil, along with the rapid appreciation in the value of the U.S. dollar (i.e., causing declines in relatively expensive U.S. exports), third quarter profit growth has declined -1%. If you exclude the energy sector from the equation, corporations are still not making the “Dean’s List,” however the report cards look a lot more respectable through this lens with profits rising +6% during the third quarter. A sluggish third quarter GDP (Gross Domestic Product) growth report of +1.5% is further evidence the economy has plenty of room to improve the country’s financial GPA.
Historically speaking, October has been a scary period, if you consider the 1929 and 1987 stock market crashes occurred during this Halloween month. Now that investors have survived this frightening period, we will see if the “Santa Claus Rally” will arrive early this season. Stock market treats have been sweet in recent weeks, but investors cannot lose sight of the long-term. With interest rates near generational lows, investors need to make sure they are efficiently investing their investment funds in a low-cost, tax-efficient, diversified manner, subject to personal time horizons and risk tolerances. Over the long-run, meeting these objectives will create a lot more treats than tricks.
Wade W. Slome, CFA, CFP®
Plan. Invest. Prosper.
DISCLOSURE: Sidoxia Capital Management (SCM) and some of its clients hold positions in certain exchange traded funds (ETFs) , but at the time of publishing, SCM had no direct position in any other security referenced in this article. No information accessed through the Investing Caffeine (IC) website constitutes investment, financial, legal, tax or other advice nor is to be relied on in making an investment or other decision. Please read disclosure language on IC Contact page.
Marathon Market Gets a Cramp

This article is an excerpt from a previously released Sidoxia Capital Management complimentary newsletter (October 1, 2015). Subscribe on the right side of the page for the complete text.
“Anyone can run a hundred meters, it’s the next forty-two thousand and two hundred that count.”
Investing is a lot like running a marathon…but it’s not a sprint to the retirement finish line. The satisfaction of achieving your long-term goal can be quite rewarding, but attaining ambitious objectives does not happen overnight. Along the hilly and winding course, there can be plenty of bumps and bruises mixed in with the elation of a runner’s high. While stocks have been running at a record pace in recent years, prices have cramped up recently as evidenced by the -2.6% decline of the S&P 500 stock index last month.
But the recent correction should be placed in the proper perspective as you approach and reach retirement. Since the end of the 2008 Financial Crisis the stock market has been racing ahead at a brisk rate, as you can see from the total return performance below (excluding 2015):

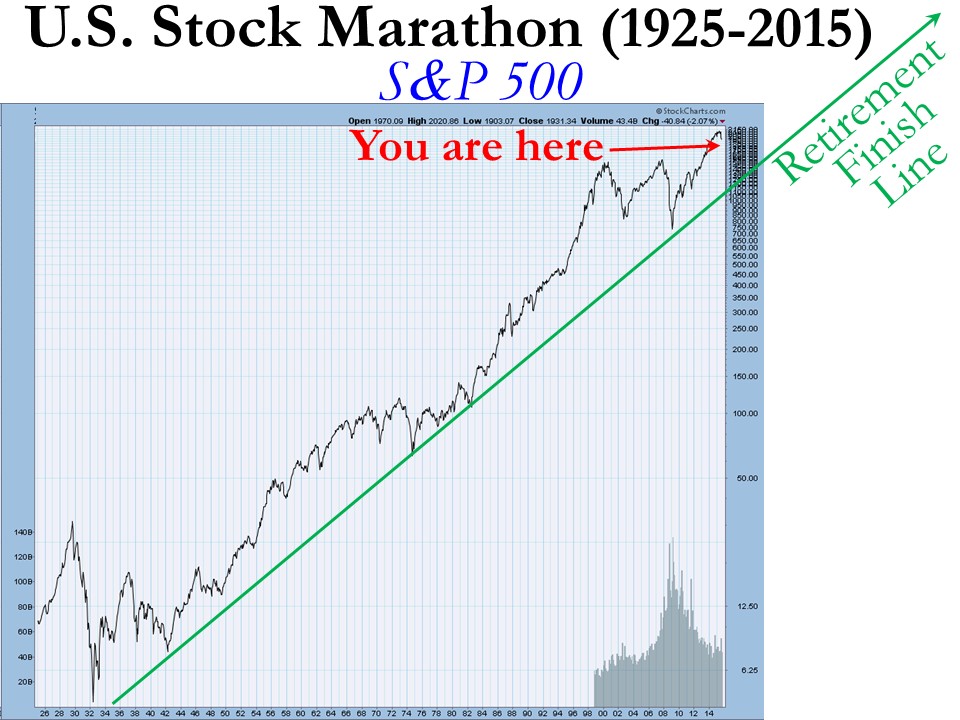
This performance is more indicative of a triumph than a catastrophe, but if you turned on the TV, listened to the radio, or surfed the web, you may come to a more frightening conclusion.
What’s behind the recent dip? These are some of the key concerns driving the recent price volatility:
- China: Slowing growth in China and collapse in Chinese stock market. China is suffering from a self-induced slowdown designed to mitigate corruption, prick the real estate bubble, and shift its export-driven economy to a more consumer-driven economy. These steps diminish short-term growth (albeit faster than U.S. growth), but nevertheless the measures should be constructive for longer-term growth.
- Interest Rates: Uncertainty surrounding the timing of a 0.25% target interest rate increase by the Federal Reserve. The move from 0% to 0.25% is like walking from the hardwood floor onto the rug…hardly noticeable. The inevitable move by the Fed has been widely communicated for months, and given where interest rates are today, the move will have a negligible impact on corporate borrowing costs. Like removing a Band-Aid, the initial action may cause some pain, but should be comfortably received shortly thereafter.
- Politics: Potential government shutdown / sequestration. The epic political saga will never end, however, as I highlighted in “Who Said Gridlock is Bad?,” political discourse in Washington has resulted in positive outcomes as it relates to our country’s fiscal situation (limited government spending and declining deficits). The government shutdown appears to have been averted for now, but it looks like we will be blanketed with brinkmanship nonsense again in a few months.
- Biotech/Pharmaceuticals: Politics over lofty drug prices and the potential impact of future regulation on the biotech sector. Given the current Congressional balance of power, any heavy-handed Democratic proposals is likely to face rigorous Republican opposition.
- Emerging Markets: Emerging market weakness, especially in Latin America (e.g., Brazil). These developments deserve close monitoring, but the growth in the three largest economic regions (U.S., Europe, and China) will have a much larger effect on the direction of global economic expansion.
- Middle East: Destabilized Middle East and Syria. Terrorist extremism and cultural animosity between various Middle East populations has existed for generations. There will be no silver bullet for a peaceful solution, so baby steps and containment are critical to maintain healthy global trade activity with minimal disruptions.
Worth noting, this current list of anxieties itemized above is completely different from six months ago (remember the Greece crisis?), and the list will change again six months into the future. Investing, like any competitive challenge, does not come easy…there is always something to worry about in the land of economics and geopolitics.
Here’s what the world’s top investor Warren Buffett said a few decades ago (1994) on the topic of politics and economics:
“We will continue to ignore political and economic forecasts which are an expensive distraction for investors and businessmen. Thirty years ago, no one could have foreseen the huge expansion of the Vietnam War, wage and price controls, two oil shocks, the resignation of a president, the dissolution of the Soviet Union, a one-day drop in the Dow of 508 points, or treasury bill yields fluctuating between 2.8% and 17.4%.”
In a world of 7.3 billion people and 196 countries there will never be a shortage of fear, uncertainty, and doubt (F.U.D.) – see events chart in The Bungee Market. In an ever-increasing, globally connected world, technology and the media continually amplify molehills into mountains, thereby making the next imagined Armageddon a simple click of a mouse or swipe of a smartphone away.
Today’s concerns are valid but in the vast majority of cases the issues are completely overblown, sensationalized and over-emphasized without context. Context is an integral part to investing, but unfortunately context usually cannot be explained in a short soundbite or headline. On the flip side, F.U.D. thrives in the realm of soundbites and headlines.
While investors may feel fatigued from a strong flow of headline headwinds, financial market race participants should take a break at the water stop to also replenish themselves with a steady tailwind of positive factors, including the following:
- Employment: The unemployment rate has been cut from a recession peak of 10.0% down to 5.1%, and the economy has been adding roughly +200,000 new monthly jobs on a fairly consistent basis. On top of that, there are a record 5.8 million job openings versus 3.7 million two years ago – a sign that the economy continues to hum along.
- Housing/Commercial Real Estate/Mortgage Rates: Housing prices have rebounded by about +30% from the 2012 lows; Housing starts have increased by +25% in the past year and 120% in the past four years; and 30-Year Fixed mortgage interest rates sit at 3.85% – a highly stimulative level within a spitting distance from record lows.
- Auto Sales: Surged to a post-recession record of 17.8 million units in August.
- Interest Rates: Massively stimulative and near generational lows, even if the Fed hikes its interest rate target by 0.25% in October, December or sometime in 2016.
- Capital Goods Orders: Up for three consecutive months.
- Rail Shipments/Truck Tonnage: Both these metrics are rising by about 3-4%.
- Retail Sales: Rising at a very respectable pace of 7% over the last six months.
- Low Energy & Commodity Prices: Inflation has remained largely in check thanks to plummeting commodity prices. Low oil and gas prices are benefiting consumers in numerous ways, including the contribution to car sales, home sales, and/or debt reduction.
While the -10% dip in stock prices from mid-August might feel like a torn knee ligament, long-term investors know -10% corrections historically occur about one-time per year, on average. So, even though you may be begging for a wheelchair, the best course of action is to take a deep breath, stick to your long-term investment plan, rebalance your portfolio if necessary, and continue staying on course towards your financial finish line.
Wade W. Slome, CFA, CFP®
Plan. Invest. Prosper.
DISCLOSURE: Sidoxia Capital Management (SCM) and some of its clients hold positions in certain exchange traded funds (ETFs) , but at the time of publishing, SCM had no direct position in any other security referenced in this article. No information accessed through the Investing Caffeine (IC) website constitutes investment, financial, legal, tax or other advice nor is to be relied on in making an investment or other decision. Please read disclosure language on IC Contact page.
Coast is Clear Until 2019

The economic recovery since the Great Financial Crisis of 2008-09 has been widely interpreted as the slowest recovery since World War II. Bill McBride of Calculated Risk captures this phenomenon incredibly well in his historical job loss chart (see red line in chart below):
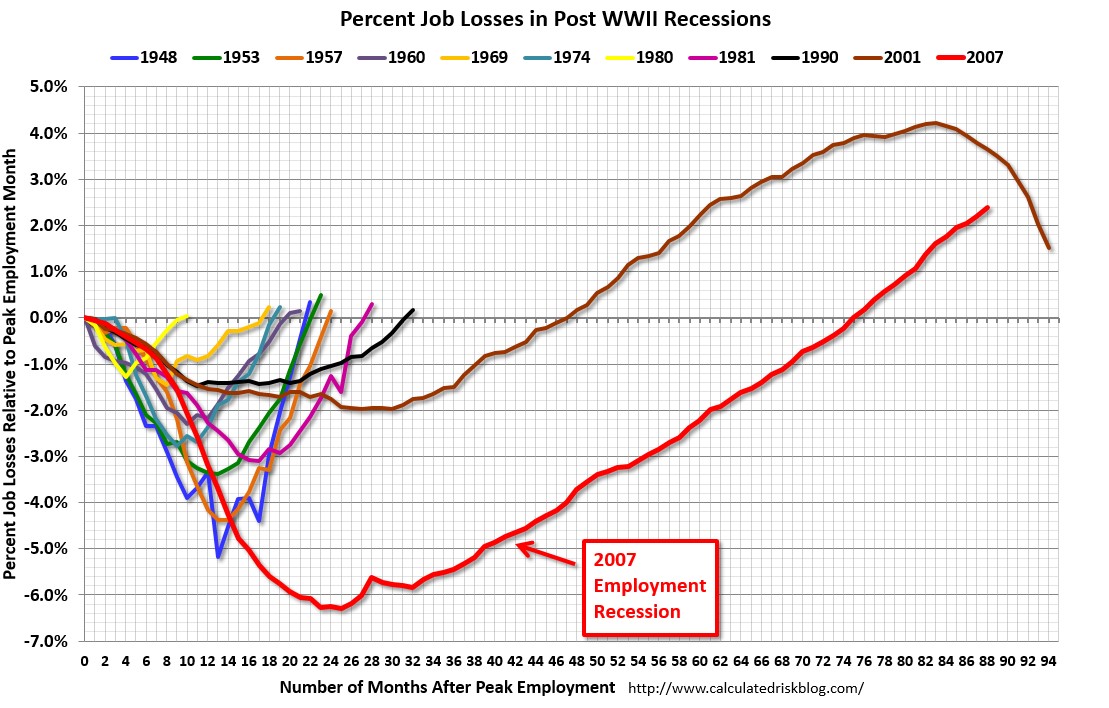
Source: Calculated Risk
History tells us that the economy traditionally suffers from an economic recession twice per decade, but we are closing in on seven years since the last recession with little evidence of impending economic doom.
So, are we due for another recession? Logic would dictate that since this recovery has been the slowest in a generation, the duration of this recovery should also be the longest. Strategist Ed Yardeni of Dr. Ed’s Blog uses data from historical economic cycles and CEI statistics (Coincident Economic Indicators) to make the same case. Based on his analysis, Yardeni does not see the next recession arriving until March 2019 (see chart below). If you take a look at the last five previous cycle peaks, recoveries generally last for an additional five and a half years (roughly 65 months). Since the last rebound to a cyclical peak occurred in October 2013, 65 months from then would imply the next downturn would begin in March 2019.
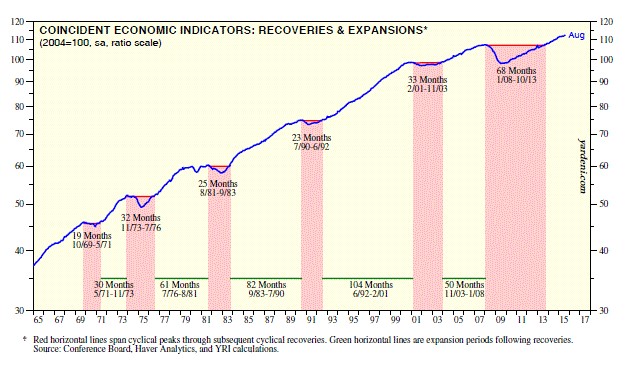
Source: Dr. Ed’s Blog
Typically, an economy loses steam and enters a recession after a phase of over-investment, tight labor conditions, and an extended period of tight central bank monetary policies. Over the last seven years, we have experienced quite the opposite. Corporations have been very slow to invest or hire new employees. For those employees hired, many of them are “under-employed” (i.e., working part-time), or in other words, these workers want more work hours. Our country’s slower-than-expected growth has created an output gap. Scott Grannis at Calafia Beach Pundit estimates this gap to approximate $2.8 trillion (see chart below). The CBO expects a smaller gap estimate of about $580 billion to narrow over the next few years. By Grannis’s calculations, there is a reservoir of 5 – 10 million jobs that could be tapped if the economy was operating more efficiently.
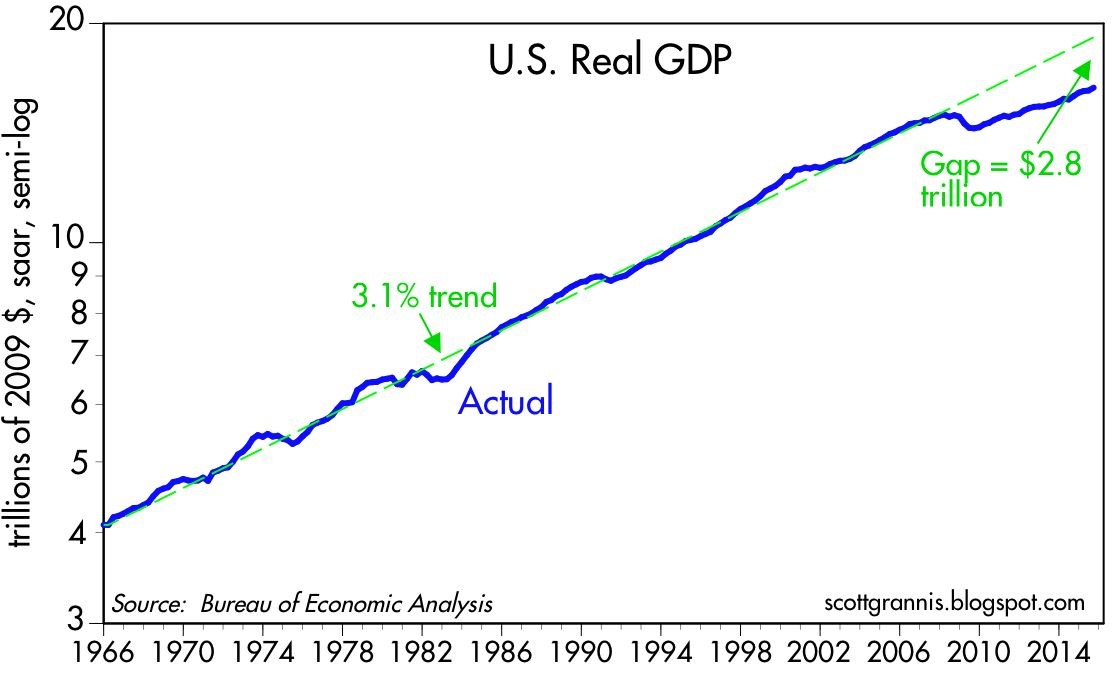
Source: Calafia Beach Pundit
Bolstering his argument, Grannis points out that the risk of a recession rises when there are significant capacity constraints and tight money. He sees the opposite happening – an enormous supply of unused capacity remains underutilized as he describes here:
“Today, money is abundant and resources are abundant. Even energy is abundant, because its price has fallen by over 50% in the past year or so. Corporate profits are near record highs, the supply of labor is virtually unconstrained, energy is suddenly cheap, and productive capacity is relatively abundant.”
While new uncertainties have been introduced (e.g., slowing China, potential government shutdown/sequestration, emerging market weakness), the reality remains there is always uncertainty. Even if you truly believe there is more uncertainty today relative to yesterday, the economy has some relatively strong shock absorbers to ride out the volatility.
There are plenty of potentially bad things to worry about, but if it’s a cyclical recession that you are worried about, then why don’t you grab a seat, order a coconut drink with an umbrella, and wait another three and a half years until you reach the circled date of March 2019 on your calendar.
Wade W. Slome, CFA, CFP®
Plan. Invest. Prosper.
DISCLOSURE: Sidoxia Capital Management (SCM) and some of its clients hold positions in certain exchange traded funds (ETFs) , but at the time of publishing, SCM had no direct position in any other security referenced in this article. No information accessed through the Investing Caffeine (IC) website constitutes investment, financial, legal, tax or other advice nor is to be relied on in making an investment or other decision. Please read disclosure language on IC Contact page.
Investors Take a Vacation

This article is an excerpt from a previously released Sidoxia Capital Management complimentary newsletter (August 3, 2015). Subscribe on the right side of the page for the complete text.
It’s summertime and the stock market has taken a vacation, and it’s unclear when prices will return from a seven month break. It may seem like a calm sunset walk along the beach now that Greek worries have temporarily subsided, but concerns have shifted to an impending Federal Reserve interest rate hike, declining commodity prices, and a Chinese stock market crash, which could lead to a painful sunburn.
If you think about it, stock investors have basically been on unpaid vacation since the beginning of the year, with the Dow Jones Industrial Index (17,690) down -0.7% for 2015 and the S&P 500 (2,104) up + 2.2% over the same time period (see chart below). Despite mixed results for the year, all three main stock indexes rebounded in July (including the tech-heavy NASDAQ +2.8% for the month) after posting negative returns in June. Overall for 2015, sector performance has been muddled. There has been plenty of sunshine on the Healthcare sector (+11.7%), but Energy stocks have been stuck in the doldrums (-13.4%), over the same timeframe.

Source: Yahoo! Finance
Chinese Investors Suffer Heat Stroke
Despite gains for U.S. stocks in July, the overheated Chinese stock marketcaused some heat stroke for global investors with the Shanghai Composite index posting its worst one month loss (-15%) in six years, wiping out about $4 trillion in market value. Before coming back down to earth, the Chinese stock market inflated by more than +150% from 2014.
Driving the speculative fervor were an unprecedented opening of 12 million monthly accounts during spring, according to Steven Rattner, a seasoned financier, investor, and a New York Times journalist. Margin accounts operate much like a credit card for individuals, which allowed these investors to aggressively gamble on the China market upswing, but during the downdraft investors were forced to sell stocks to generate proceeds for outstanding loan repayments. It’s estimated that 25% of these investors only have an elementary education and a significant number of them are illiterate. Further exacerbating the sell-off were Chinese regulators artificially intervening by halting trading in about 500 companies on the Shanghai and Shenzhen exchanges last Friday, equivalent to approximately 18% of all listings.
Although China, as the second largest economy on the globe, is much more economically important than a country like Greece, recent events should be placed into proper context. For starters, as you can see from the chart below, the Chinese stock market is no stranger to volatility. According to Fundstrat Global Advisors, the Shanghai composite index has experienced 10 bear markets over the last 25 years, and the recent downdraft doesn’t compare to the roughly -75% decline we saw in 2007-2008. Moreover, there is no strong correlation between the Chinese stock market. Only 15% of Chinese households own stocks, or measured differently, only 6% of household assets are held in stocks, says economic-consulting firm IHS Global Insight. More important than the question, “What will happen to the Chinese stock market?,” is the question, “What will happen to the Chinese stock economy?,” which has been on a perennial slowdown of late. Nevertheless, China has a 7%+ economic growth rate and the highest savings rate of any major country, both factors for which the U.S. economy would kill.

Source: Yardeni.com
Don’t Take a Financial Planning Vacation
While the financial markets continue to bounce around and interest rates oscillate based on guesswork of a Federal Reserve interest rate hike in September, many families are now returning from vacations, or squeezing one in before the back-to-school period. The sad but true fact is many Americans spend more time planning their family vacation than they do planning for their financial futures. Unfortunately, individuals cannot afford to take a vacation from their investment and financial planning. At the risk of stating the obvious, planning for retirement will have a much more profound impact on your future years than a well-planned trip to Hawaii or the Bahamas.
We live in an instant gratification society where “spend now, save later” is a mantra followed by many. There’s nothing wrong with splurging on a vacation, and to maintain sanity and family cohesion it is almost a necessity. However, this objective does not have to come at the expense of compromising financial responsibility – or in other words spending within your means. Investing is a lot like consistent dieting and exercising…it’s easy to understand, but difficult to sustainably execute. Vacations, on the other hand, are easy to understand, and easy to execute, especially if you have a credit card with an available balance.
It’s never too late to work on your financial planning muscle. As I discuss in a previous article (Getting to Your Number) , one of the first key steps is to calculate an annual budget relative to your income, so one can somewhat accurately determine how much money can be saved/invested for retirement. Circumstances always change, but having a base-case scenario will help determine whether your retirement goals are achievable. If expectations are overly optimistic, spending cuts, revenue enhancing adjustments, and/or retirement date changes can still be made.
When it comes to the stock market, there are never a shortage of concerns. Today, worries include a Greek eurozone exit (“Grexit”); decelerating China economic growth and a declining Chinese stock market; and the viability of Donald’s Trump’s presidential campaign (or lack thereof). While it may be true that stock prices are on a temporary vacation, your financial and investment planning strategies cannot afford to go on vacation.

Wade W. Slome, CFA, CFP®
Plan. Invest. Prosper.
DISCLOSURE: Sidoxia Capital Management (SCM) and some of its clients hold positions in certain exchange traded funds (ETFs), but at the time of publishing, SCM had no direct position in any other security referenced in this article. No information accessed through the Investing Caffeine (IC) website constitutes investment, financial, legal, tax or other advice nor is to be relied on in making an investment or other decision. Please read disclosure language on IC Contact page.
Supply & Demand: The Key to Oil, Stocks, and Pork Bellies

Commodity prices, including oil, are “crashing” according to the pundits and fears are building that this is a precursor to another stock market collapse. Are we on an irreversible path of repeating the bloodbath carnage of the 2008-2009 Great Recession?
Fortunately for investors, markets move in cycles and the fundamental laws of supply and demand hold true in both bull and bear markets, across all financial markets. Whether we are talking about stocks, bonds, copper, gold, currencies, or pork bellies, markets persistently move like a pendulum through periods of excess supply and demand. In other words, weakness in prices create stronger demand and less supply, whereas strength in prices creates weakening demand and more supply.
Since energy makes the world go round and the vast majority of drivers are accustomed to filling up their gas tanks, the average consumer is familiar with recent negative price developments in the crude oil markets. Eighteenth-century economist Adam Smith would be proud that the laws of supply and demand have help up just as well today as they did when he wrote Wealth of Nations in 1776.
It is true that overall stagnation in global economic demand in recent years, along with the strengthening of the U.S. dollar (because of better relative growth), has contributed to downward trending oil prices. It is also true that supply factors, such as Saudi Arabia’s insistence to maintain production and the boom in U.S. oil production due to new fracking technologies (see chart below), have arguably had a larger negative impact on the more than -50% deterioration in oil prices. Fears of additional Iranian oil supply hitting the global oil markets as a result of the Iranian nuclear deal have also added to the downward pressure on prices.
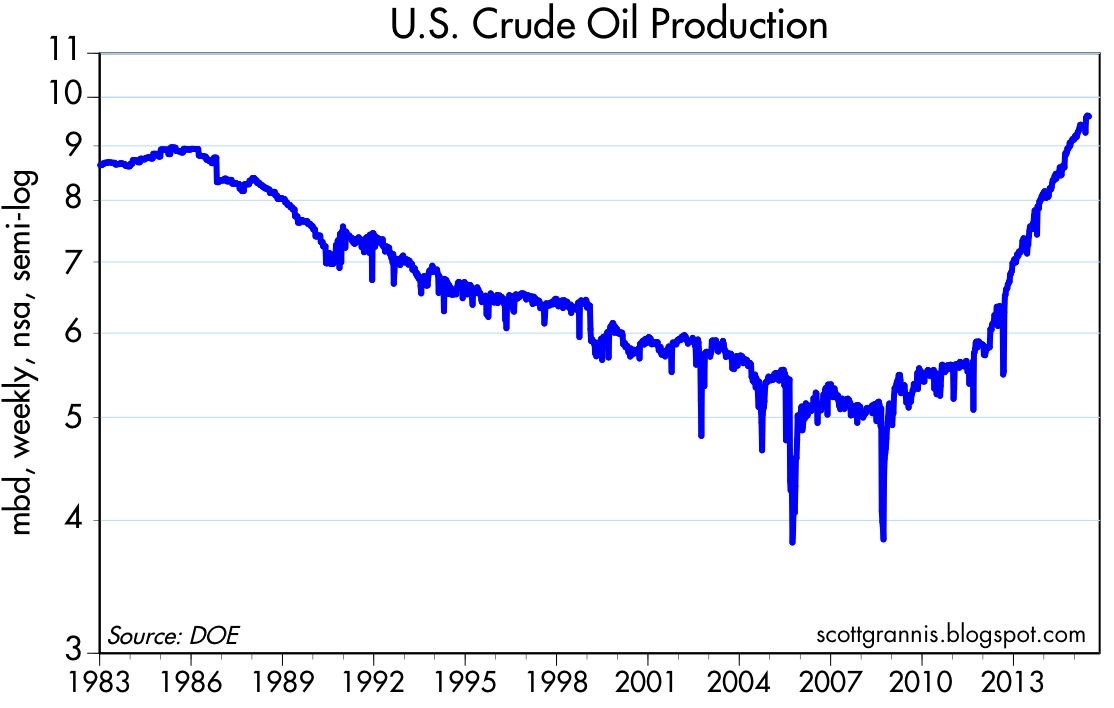
Source: Scott Grannis
What is bad for oil prices and the oil producers is good news for the rest of the economy. Transportation is the lubricant of the global economy, and therefore lower oil prices will act as a stimulant for large swaths of the global marketplace. Here in the U.S., consumer savings from lower energy prices have largely been used to pay down debt (deleverage), but eventually, the longer oil prices remain depressed, incremental savings should filter into our economy through increased consumer spending.
But prices are likely not going to stay low forever because producers are responding drastically to the price declines. All one needs to do is look at the radical falloff in the oil producer rig count (see chart below). As you can see, the rig count has fallen by more than -50% within a six month period, meaning at some point, the decline in global production will eventually provide a floor to prices and ultimately provide a tailwind.
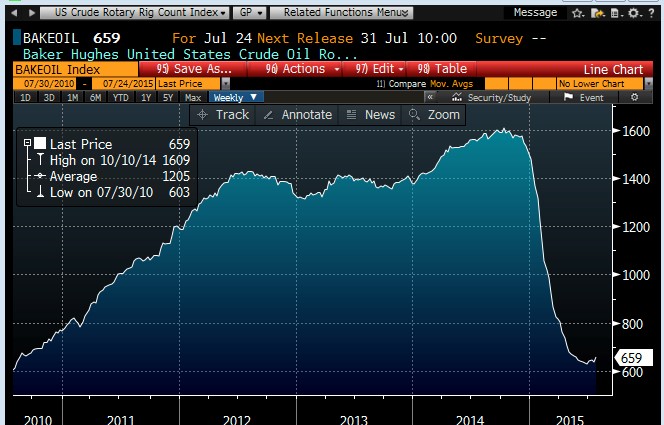
Source: Scott Grannis
If we broaden our perspective beyond just oil, and look at the broader commodity complex, we can see that the recent decline in commodity prices has been painful, but nowhere near the Armageddon scenario experienced during 2008-2009 (see chart below – gray areas = recessions).
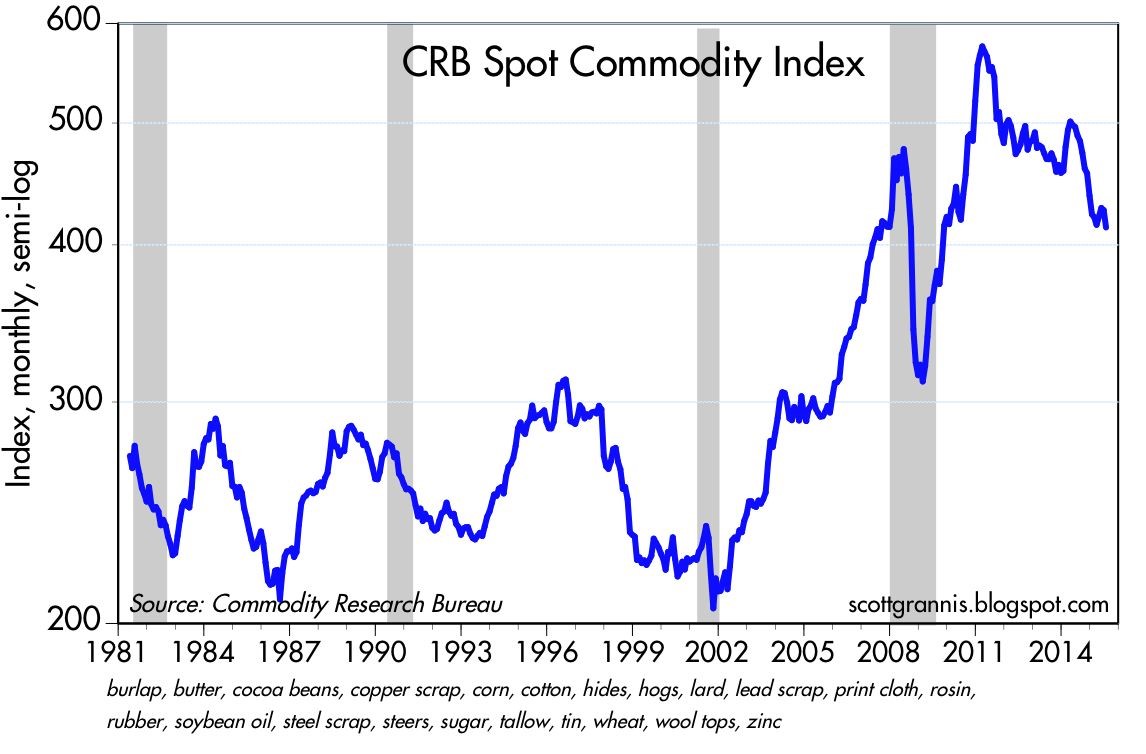
Source: Scott Grannis
Although this conversation has focused on commodities, the same supply-demand principles apply to the stock market as well. Stock market prices as measured by the S&P 500 index have remained near record levels, but as I have written in the past, the records cannot be attributed to the lackluster demand from retail investors (see ICI fund flow data).
Although U.S. stock fundamentals remain relatively strong (e.g., earnings, interest rates, valuations, psychology), much of the strength can be explained by the constrained supply of stocks. How has stock supply been constrained? Some key factors include the trillions in dollars of supply soaked up by record M&A activity (mergers and acquisition) and share buybacks.
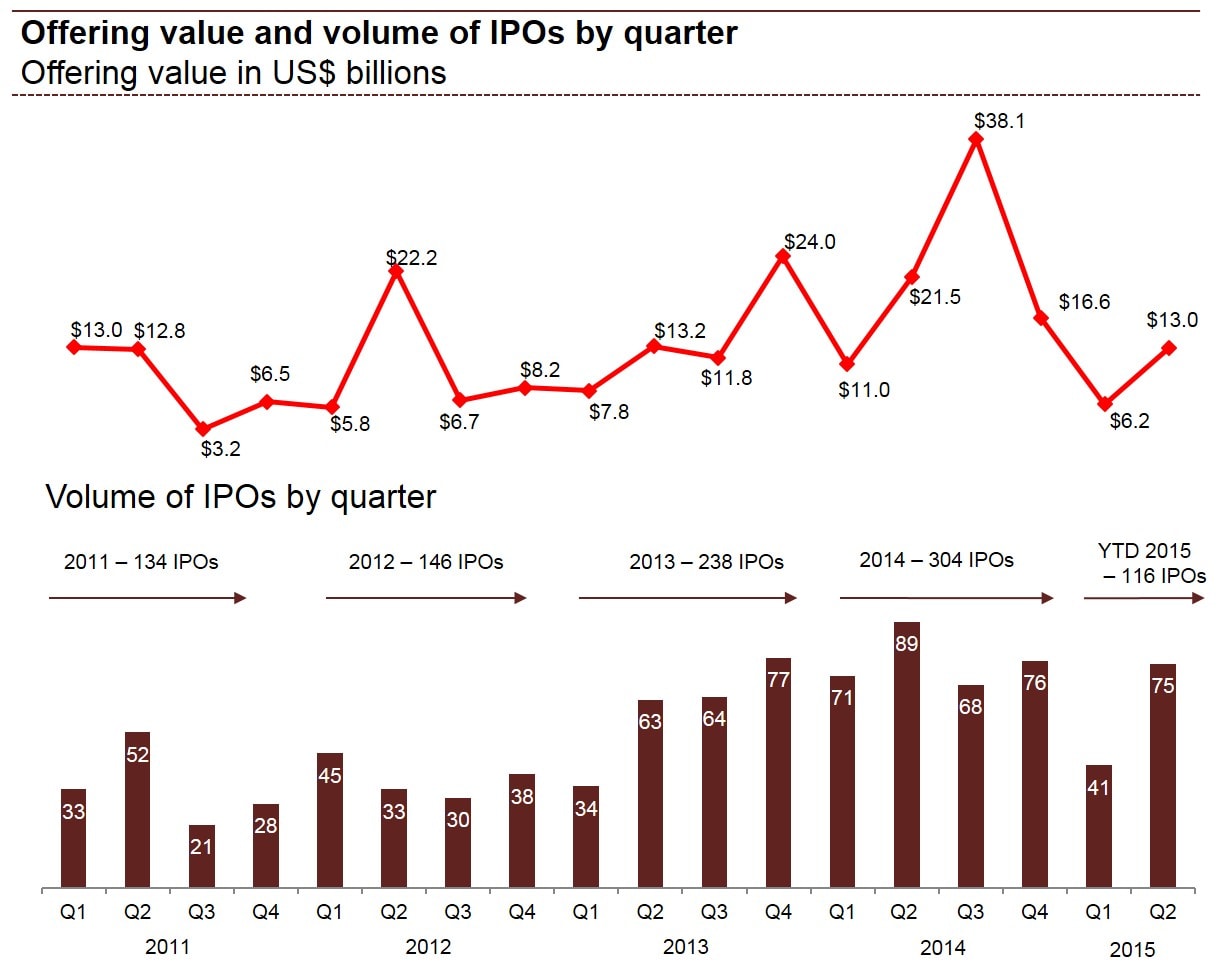
In addition to the declining stock supply from M&A and share buybacks, there has been limited supply of new IPO issues (initial public offerings) coming to market, as evidenced by the declines in IPO dollar and unit volumes in the first half of 2015, as compared to last year. More specifically, first half IPO dollar volmes were down -41% to $19.2 billion and the number of 2015 IPOs has declined -27% to 116 from 160 for the same time period.
Price cycles vary dramatically in price and duration across all financial markets, including stocks, bonds, oil, interest rates, currencies, gold, and pork bellies, among others. Not even the smartest individual or most powerful computer on the planet can consistently time the short-term shifts in financial markets, but using the powerful economic laws of supply and demand can help you profitably make adjustments to your investment portfolio(s).
See Also – The Lesson of a Lifetime (Investing Caffeine)
Wade W. Slome, CFA, CFP®
Plan. Invest. Prosper.
DISCLOSURE: Sidoxia Capital Management (SCM) and some of its clients hold positions in certain exchange traded funds (ETFs), but at the time of publishing, SCM had no direct position in any other security referenced in this article. No information accessed through the Investing Caffeine (IC) website constitutes investment, financial, legal, tax or other advice nor is to be relied on in making an investment or other decision. Please read disclosure language on IC Contact page.
Greece: The Slow Motion, Multi-Year Train Wreck

This article is an excerpt from a previously released Sidoxia Capital Management complimentary newsletter (July 1, 2015). Subscribe on the right side of the page for the complete text.
Watching Greece fall apart over the last five years has been like watching a slow motion train wreck. To many, this small country of 11 million people that borders the Mediterranean, Aegean, and Ionian Seas is known more for its Greek culture (including Zeus, Parthenon, Olympics) and its food (calamari, gyros, and Ouzo) than it is known for financial bailouts. Nevertheless, ever since the financial crisis of 2008-2009, observers have repeatedly predicted the debt-laden country will default on its €323 billion mountain of obligations (see chart below – approximately $350 billion in dollars) and subsequently exit the 19-member eurozone currency membership (a.k.a.,”Grexit”).

Source: MoneyMorning.com and CNN
Now that Greece has failed to repay less than 1% of its full €240 billion bailout obligation – the €1.5 billion payment due to the IMF (International Monetary Fund) by June 30th – the default train is coming closer to falling off the tracks. Whether Greece will ultimately crash itself out of the eurozone will be dependent on the outcome of this week’s surprise Greek referendum (general vote by citizens) mandated by Prime Minister Alexis Tsipras, the leader of Greece’s left-wing Syriza party. By voting “No” on further bailout austerity measures recommended by the European Union Commission, including deeper tax increases and pension cuts, the Greek people would effectively be choosing a Grexit over additional painful tax increases and deeper pension cuts.
Ouch!
And who can blame the Greeks for being a little grouchy? You might not be too happy either if you witnessed your country experience an economic decline of greater than 25% (see Greece Gross Domestic Product chart below); 25% overall unemployment (and 50% youth unemployment); government worker cuts of greater than 20%; and stifling taxes to boot. Sure, Greeks should still shoulder much of the blame. After all, they are the ones who piled on $100s of billions of debt and overspent on the pensions of a bloated public workforce, and ran unsustainable fiscal deficits.

Source: TradingEconomics.com
For any casual history observers, the current Greek financial crisis should come as no surprise, especially if you consider the Greeks have a longstanding habit of not paying their bills. Over the last two centuries or so, since the country became independent, the Greek government has spent about 90 years in default (almost 50% of the time). More specifically, the Greeks defaulted on external sovereign debt in 1826, 1843, 1860, 1894 and 1932.
The difference between now and past years can be explained by Greece now being a part of the European Union and the euro currency, which means the Greeks actually do have to pay their bills…if they want to remain a part of the common currency. During past defaults, the Greek central bank could easily devalue their currency (the drachma) and fire up the printing presses to create as much currency as needed to pay down debts. If the planned Greek referendum this week results in a “No” vote, there is a much higher probability that the Greek government will need to dust off those drachma printing presses.
“Perspective People”
Protest, riots, defaults, changing governments, and new currencies make for entertaining television viewing, but these events probably don’t hold much significance as it relates to the long-term outlook of your investments and the financial markets. In the case of Greece, I believe it is safe to say the economic bark is much worse than the bite. For starters, Greece accounts for less than 2% of Europe’s overall economy, and about 0.3% of the global economy.
Since I live out on the West Coast, the chart below caught my fancy because it also places the current Greek situation into proper proportion. Take the city of L.A. (Los Angeles – red bar) for example…this single city alone accounts for almost 3x the size of Greece’s total economy (far right on chart – blue bar).
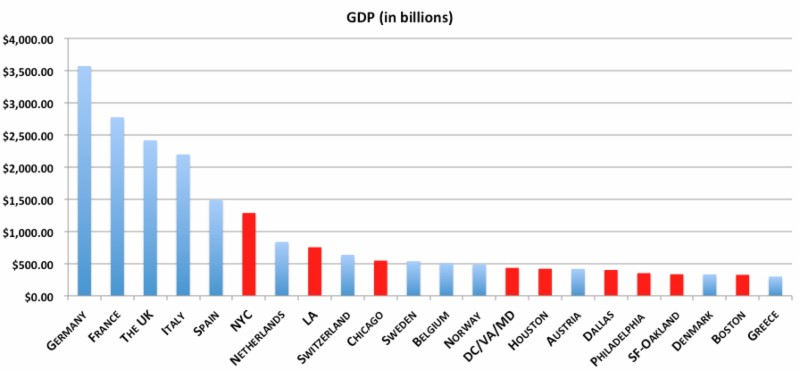
Give Me My Money!
It hasn’t been a fun year for Greek banks. Depositors, who have been flocking to the banks, withdrew about $45 billion in cash from their accounts, over an eight month period (see chart below). Before the Greek government decided to mandatorily close the banks in recent days and implement capital controls limiting depositors to daily ATM withdrawals of only $66.
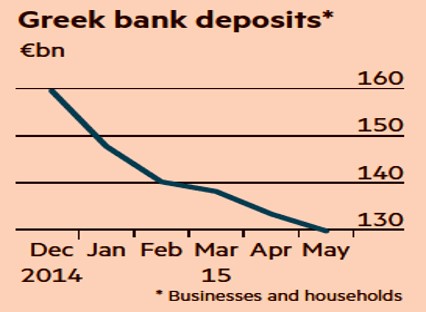
Source: The Financial Times
But once again, let’s put the situation into context. From an overall Greek banking sector perspective, the four largest Greek Banks (Bank of Greece, Piraeus Bank, Eurobank Ergasias, Alpha Bank) account for about 90% of all Greek banking assets. Combined, these banks currently have an equity market value of about $14 billion and assets on the balance sheets of $400 billion – these numbers are obviously in flux. For comparison purposes, Bank of America Corp. (BAC) alone has an equity market value of $179 billion and $2.1 trillion in assets.
Anxiety Remains High
Skeptical bears will occasionally acknowledge the miniscule-ness of Greece, but then quickly follow up with their conspiracy theory or domino effect hypothesis. In other words, the skeptics believe a contagion effect of an impending Grexit will ripple through larger economies, such as Italy and Spain, with crippling force. Thus far, as you can see from the chart below, Greece’s financial problems have been largely contained within its borders. In fact, weaker economies such as Spain, Portugal, Ireland, and Italy have fared much better – and actually improving in most cases. In recent days, 10-year yields on government bonds in countries like Portugal, Italy, and Spain have hovered around or below 3% – nowhere near the peak levels seen during 2008 – 2011.

Source: Business Insider
Other doubting Thomases compare Greece to situations like Lehman Brothers, Long Term Capital Management, and the subprime housing market, in which underestimated situations snowballed into much worse outcomes. As I explain in one of my newer articles (see Missing the Forest for the Trees), the difference between Greece and the other financial collapses is the duration of this situation. The Greek circumstance has been a 5-year long train wreck that has allowed everyone to prepare for a possible Grexit. Rather than agonize over every news headline, if you are committed to the practice of worrying, I would recommend you focus on an alternative disaster that cannot be found on the front page of all newspapers.
There is bound to be more volatility ahead for investors, and the referendum vote later this week could provide that volatility spark. Regardless of the news story du jour, any of your concerns should be occupied by other more important worrisome issues. So, unless you are an investor in a Greek bank or a gyro restaurant in Athens, you should focus your efforts on long-term financial goals and objectives. Ignoring the noisy news flow and constructing a diversified investment portfolio across a range of asset classes will allow you to avoid the harmful consequences of the slow motion, multi-year Greek train wreck.
Wade W. Slome, CFA, CFP®
Plan. Invest. Prosper.
DISCLOSURE: Sidoxia Capital Management (SCM) and some of its clients hold positions in certain exchange traded funds (ETFs) and BAC, but at the time of publishing, SCM had no direct position in Bank of Greece, Piraeus Bank, Eurobank Ergasias, Alpha Bank or any other security referenced in this article. No information accessed through the Investing Caffeine (IC) website constitutes investment, financial, legal, tax or other advice nor is to be relied on in making an investment or other decision. Please read disclosure language on ICContact page.
Digesting Stock Gains

This article is an excerpt from a previously released Sidoxia Capital Management complementary newsletter (June 1, 2015). Subscribe on the right side of the page for the complete text.
Despite calls for “Sell in May, and go away,” the stock market as measured by both the Dow Jones Industrial and S&P 500 indexes grinded out a +1% gain during the month of May. For the year, the picture looks much the same…the Dow is up around +1% and the S&P 500 +2%. After gorging on gains of +30% in 2013 and +11% in 2014, it comes as no surprise to me that the S&P 500 is taking time to digest the gains. After eating any large pleasurable meal, there’s always a chance for some indigestion – just like last month. More specifically, the month of May ended as it did the previous six months…with a loss on the last trading day (-115 points). Providing some extra heartburn over the last 30 days were four separate 100+ point decline days. Realized fears of a Greek exit from the eurozone would no doubt have short-term traders reaching for some Tums antacid. Nevertheless, veteran investors understand this is par for the course, especially considering the outsized profits devoured in recent years.
The profits have been sweet, but not everyone has been at the table gobbling up the gains. And with success, always comes the skeptics, many of whom have been calling for a decline for years. This begs the question, “Are we in a stock bubble?” I think not.
Bubble Bites
Most asset bubbles are characterized by extreme investor/speculator euphoria. There are certainly small pockets of excitement percolating up in the stock market, but nothing like we experienced in the most recent burstings of the 2000 technology and 2006-07 housing bubbles. Yes, housing has steadily improved post the housing crash, but does this look like a housing bubble? (see New Home Sales chart)

Source: Dr. Ed’s Blog
Another characteristic of a typical asset bubble is rabid buying. However, when it comes to the investor fund flows into the U.S. stock market, we are seeing the exact opposite…money is getting sucked out of stocks like a Hoover vacuum cleaner. Over the last eight or so years, there has been almost -$700 billion that has hemorrhaged out of domestic equity funds – actions tend to speak louder than words (see chart below):
 Source: Investment Company Institute (ICI)
The shift to Exchange Traded Funds (ETFs) offered by the likes of iShares and Vanguard doesn’t explain the exodus of cash because ETFs such as S&P 500 SPDR ETF (SPY) are suffering dramatically too. SPY has drained about -$17 billion alone over the last year and a half.
With money flooding out of these stock funds, how can stock prices move higher? Well, one short answer is that hundreds of billions of dollars in share buybacks and trillions in mergers and acquisitions activity (M&A) is contributing to the tide lifting all stock boats. Low interest rates and stimulative monetary policies by central banks around the globe are no doubt contributing to this positive trend. While the U.S. Federal Reserve has already begun reversing its loose monetary policies and has threatened to increase short-term interest rates, by any objective standard, interest rates should remain at very supportive levels relative to historical benchmarks.
Besides housing and fund flows data, there are other unbiased sentiment indicators that indicate investors have not become universally Pollyannaish. Take for example the weekly AAII Sentiment Survey, which shows 73% of investors are currently Bearish and/or Neutral – significantly higher than historical averages.
The Consumer Confidence dataset also shows that not everyone is wearing rose-colored glasses. Looking back over the last five decades, you can see the current readings are hovering around the historical averages – nowhere near the bubblicious 2000 peak (~50% below).

Source: Bespoke
Recession Reservations
Even if you’re convinced there is no imminent stock market bubble bursting, many of the same skeptics (and others) feel we’re on the verge of a recession – I’ve been writing about many of them since 2009. You could choke on an endless number of economic indicators, but on the common sense side of the economic equation, typically rising unemployment is a good barometer for any potentially looming recession. Here’s the unemployment rate we’re looking at now (with shaded periods indicating prior recessions):

As you can see, the recent 5.4% unemployment rate is still moving on a downward, positive trajectory. By most peoples’ estimation, because this has been the slowest recovery since World War II, there is still plenty of labor slack in the market to keep hiring going.
An even better leading indicator for future recessions has been the slope of the yield curve. A yield curve plots interest rate yields of similar bonds across a range of periods (e.g., three-month bill, six-month bill, one-year bill, two-year note, five-year note, 10-year note and 30-year bond). Traditionally, as short-term interest rates move higher, this phenomenon tends to flatten the yield curve, and eventually inverts the yield curve (i.e., short-term interest rates are higher than long-term interest rates). Over the last few decades, when the yield curve became inverted, it was an excellent leading indicator of a pending recession (click here and select “Animate” to see amazing interactive yield curve graph). Fortunately for the bulls, there is no sign of an inverted yield curve – 30-year rates remain significantly higher than short-term rates (see chart below).

Stock market skeptics continue to rationalize the record high stock prices by pointing to the artificially induced Federal Reserve money printing buying binge. It is true that the buffet of gains is not sustainable at the same pace as has been experienced over the last six years. As we continue to move closer to full employment in this economic cycle, the rapid accumulated wealth will need to be digested at a more responsible rate. An unexpected Greek exit from the EU or spike in interest rates could cause a short-term stomach ache, but until many of the previously mentioned indicators reach dangerous levels, please pass the gravy.
Wade W. Slome, CFA, CFP®
Plan. Invest. Prosper.
DISCLOSURE: Sidoxia Capital Management (SCM) and some of its clients hold positions in SPY and other certain exchange traded funds (ETFs), but at the time of publishing, SCM had no direct position in any other security referenced in this article. No information accessed through the Investing Caffeine (IC) website constitutes investment, financial, legal, tax or other advice nor is to be relied on in making an investment or other decision. Please read disclosure language on IC Contact page.
Yellen is “Yell-ing” About High Stock Prices!

Earlier this week, Janet Yellen, chair of the U.S. Federal Reserve, spoke at the Institute for New Economic Thinking conference at the IMF headquarters in Washington, D.C. In addition to pontificating about the state of the global economy and the direction of interest rates, she also decided to chime in with her two cents regarding the stock market by warning stock values are “quite high.” She went on to emphasize “there are potential dangers” in the equity markets.
Unfortunately, those investors who have hinged their investment careers on the forecasts of economists, strategists, and Fed Chairmen have suffered mightily. Already, Yellen’s soapbox rant about elevated stock prices is being compared to former Fed Chairman Alan Greenspan’s “Irrational Exuberance” speech, which I have previously discussed on numerous occasions (see Irrational Exuberance Déjà Vu).
Greenspan’s bubble warning talk was given on December 5, 1996 when the NASDAQ closed around 1,300 (it closed at 5,003 this week). Greenspan specifically said the following:
“But how do we know when irrational exuberance has unduly escalated asset values, which then become subject to unexpected and prolonged contractions as they have in Japan over the past decade?”
After his infamous speech, the NASDAQ index almost quadrupled in value to 5,132 in the ensuing three years before cratering by approximately -78%,
Greenspan’s successor, economics professor Ben Bernanke, didn’t fare much better than the previous Fed Chairmen. Unlike many, I give full credit where credit is due. Bernanke deserves extra credit for his nimble but aggressive actions that helped prevent a painful recession from expanding into a protracted and lethal depression.
With that said, as late as May 2007, Bernanke noted Fed officials “do not expect significant spillovers from the subprime market to the rest of the economy.” Moreover, in 2005, near the peak in housing prices, Bernanke said the probability of a housing bubble was “a pretty unlikely possibility.” Bernanke went on to add housing price increases, “largely reflect strong economic fundamentals.” Greenspan concurred with Bernanke. Just a year prior, Greenspan noted that the increase in home values was “not enough in our judgment to raise major concerns.” History has proven how Bernanke and Greenspan could not have been more wrong.
If you still believe Yellen is the bee’s knees when it comes to the investing prowess of economists, perhaps you should review Long Term Capital Management (LTCM) debacle. In the midst of the 1998 Asian financial crisis, Robert Merton and Myron Scholes, two world renowned Nobel Prize winners almost single handedly brought the global financial market to its knees. Merton and Scholes used their lifetime knowledge of economics to create complex computerized investment algorithms. Everything worked just fine until LTCM lost $500 million in one day, which required a $3.6 billion bailout from a consortium of banks.
NASDAQ 5,000…Bubble Repeat?
Janet Yellen’s recent prognostication about the valuation of the U.S. stock market happens to coincide with the NASDAQ index breaking through the 5,000 threshold, a feat not achieved since the piercing of the technology bubble in the year 2000. Investing Caffeine readers and investors of mine understand today’s NASDAQ index is much different than the NASDAQ index of 15 years ago (see also NASDAQ Redux), especially when it comes to valuation. The folks at Bespoke put NASDAQ 5,000 into an interesting context by adding the important factor of inflation to the mix. Even though the NASDAQ index is within spitting distance of its all-time high of 5,132 (reached in 2000), the index would actually need to rally another +40% to reach an all-time “inflation adjusted” closing high (see chart below).

Source: Bespoke Investment Group
Economists and strategists are usually articulate, and their arguments sound logical, but they are notorious for being horribly bad at predicting the future, Janet Yellen included. I agree valuation is an all-important factor in determining future stock market returns. Howeer, by Robert Shiller, Janet Yellen, and a host of other economists relying on one flawed metric (CAPE PE), they have not only been wildly wrong year after year, but they are recklessly neglecting many other key factors (see also Shiller CAPE Smells Like BS).
I freely admit stocks will eventually go down, most likely a garden variety -20% recessionary decline in prices. While from a historical standpoint we are overdue for another recession (about two recessions per decade), this recovery has been the slowest since World War II, and the yield curve is currently not flashing any warning signals. When the eventual stock market decline happens, it likely will not be driven by high valuations. The main culprit for a bear market will be a decline in earnings – high valuations just act as gasoline on the fire. Janet Yellen will continue to offer her opinions on many aspects of the economy, but if she steps on her soapbox again and yells about stock market valuations, you will be best served by purchasing a pair of earplugs.
Wade W. Slome, CFA, CFP®
Plan. Invest. Prosper.
DISCLOSURE: Sidoxia Capital Management (SCM) and some of its clients hold positions in certain exchange traded funds (ETFs), but at the time of publishing, SCM had no direct position in any other security referenced in this article. No information accessed through the Investing Caffeine (IC) website constitutes investment, financial, legal, tax or other advice nor is to be relied on in making an investment or other decision. Please read disclosure language on IC Contact page.
Ceasefires & Investor Quagmires

This article is an excerpt from a previously released Sidoxia Capital Management complementary newsletter (March 1, 2015). Subscribe on the right side of the page for the complete text.
Considering the following current event headlines, who would have guessed the stock market is trading near record, all-time highs and the NASDAQ index breaking 5,000 for the first time since the year 2000?
- Russia Lies Over Ukraine Ceasefire
- ISIS Beheadings and Jihadi John
- Strong Dollar, Weak Global Economy
- Fed’s Yellen: Rate Rise & Inflation
- Iranian Negotiations & Nuclear Weapons
- Grexit: The Likelihood of Greece’s Exit from the Euro
- The Chinese Bubble Pops
- Ebola and the Fear Epidemic
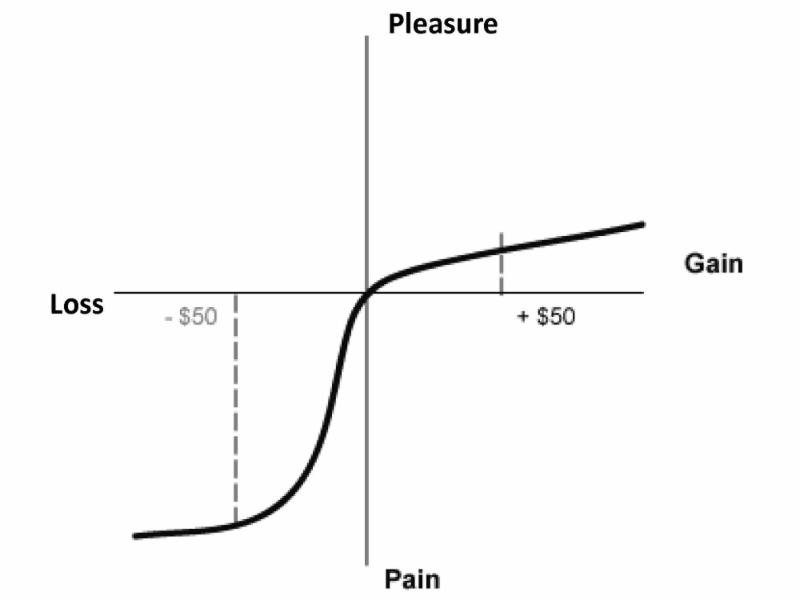
After reading all these depressing stories, I feel more like taking a Prozac pill than I do venturing into the investing world. Unfortunately, in the media world, the overarching motto driving the selection of published stories is, “If it bleeds, it leads!” Plainly and simply, bad news sells. The media outlets prey on our human behavioral shortcomings. Specifically, people feel the pain from losses at a rate more than double the feelings of pleasure (see Controlling the Lizard Brain and chart below).
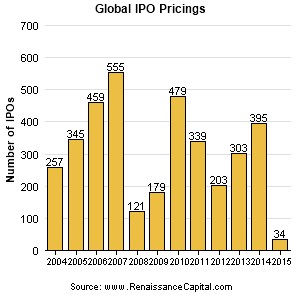
This phenomenon leaves Americans and the overall investing public choking on the daily doom and gloom headlines. Investor skepticism caused by the 2008-2009 financial crisis is evidenced by historically low stock ownership statistics and stagnant equity purchase flow data. Talk of another stock bubble has been introduced again now that the NASDAQ is approaching 5,000 again, but we are not seeing signs of this phenomenon in the IPO market (Initial Public Offering) – see chart below. IPOs are on the rise, but the number of filings is more than -50% below the peak of 845 IPOs seen in the late 1990s when former Federal Reserve Chairman Alan Greenspan made his famous “irrational exuberance” speech (see also Irrational Exuberance Deja Vu and chart below).
Uggh! 0.08% Really?
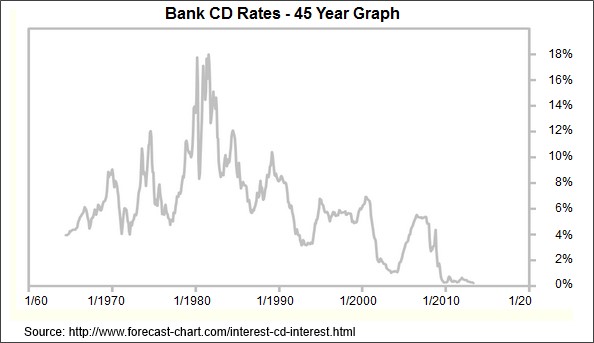
Compounding the never-ending pessimism problem is the near-0% interest rate environment. Times are long gone when you could earn 18% on a certificate of deposit (see chart below). Today, you can earn 0.08% on a minimum $10,000 investment in a Bank of America (BAC) Certificate of Deposit (CD). Invest at that rate for more than a decade and you will have almost accumulated a $100 (~1%) – probably enough for a single family meal…without tip. To put these paltry interest rates into perspective, the U.S. stock market as measured by the S&P 500 index was up a whopping +5.5% last month and the Dow Jones Industrials climbed +5.6% (+968 points to 18,133). Granted, last month’s S&P 500 percentage increase was the largest advance since 2011, but if I wanted to earn an equivalent +5.5% return by investing in that Bank of America CD, it would take me to age 100 years old before I earned that much!
Globally, the interest rate picture doesn’t look much prettier. In fact, the negative interest rate bonds offered in Switzerland and other neighboring countries, including France and Germany, have left investors in these bonds with guaranteed losses, if held to maturity (see also Draghi Beer Goggles).
Money Seeking Preferred Treatment
Investors and followers of mine have heard me repeatedly declare that “money goes where it is treated best.” When many investments are offering 0% (or negative yields), it comes as no surprise to me that dividend paying stocks have handily outperformed the overall bond market in recent years. Hard to blame someone investing in certain stocks offering between 2-6% in dividends when the alternative is offered at or near 0%.
While at Sidoxia we are still finding plenty of opportunities in the equity markets, I want to extend the reminder that not everyone can (or should) increase their equity allocation because of personal time horizon and risk tolerance constraints. Regardless, the current, restricting global financial markets are highlighting the scarcity of investment alternatives available.
As we will continue to be bombarded with more cease fires, quagmires and other bleeding headlines, investors will be better served by ignoring the irrelevant headlines and instead create a long-term financial plan with an asset allocation designed to meeting their personal goals. By following this strategy, you can let the dooms-dayers bleed while you succeed.

Wade W. Slome, CFA, CFP®
Plan. Invest. Prosper.
DISCLOSURE: Sidoxia Capital Management (SCM) and some of its clients hold positions in certain exchange traded funds (ETFs) and BAC, but at the time of publishing, SCM had no direct position in any other security referenced in this article. No information accessed through the Investing Caffeine (IC) website constitutes investment, financial, legal, tax or other advice nor is to be relied on in making an investment or other decision. Please read disclosure language on IC Contact page.