Posts tagged ‘valuation’
The Treadmill Market – Jogging in Place

This article is an excerpt from a previously released Sidoxia Capital Management complementary newsletter (April 1, 2014). Subscribe on the right side of the page for the complete text.
After the stock market raced ahead to about a +30% gain last year, it became clear this meteoric trend was not sustainable into perpetuity. Correct investing should be treated more like a marathon than a sprint. After dashing ahead by more than +100% over the last handful of years, 2014 stock prices took a breather by spending the first quarter jogging in place. Like a runner on the treadmill, year-to-date returns equated to a -0.7% for the Dow Jones Industrial Average index, and +1.3% for the S&P index. Digesting the large gains from previous years, despite making no discernable forward progress this quarter, is a healthy exercise that builds long-term portfolio endurance. As far as I’m concerned, nothing in life worthwhile comes easy, and the first three months of the year have demonstrated this principle.
As I’ve written in the past (see Series of Unfortunate Events), there is never a shortage of issues to worry about. The first few months of 2014 have been no exception. Vladimir Putin’s strong armed military backed takeover of Crimea, coupled with the Federal Reserve’s unwinding $30 billion of the $85 billion of its “Quantitative Easing” bond buying program (i.e. tapering) have contributed to investors’ nervousness. When the “Fairy Godmother of the Bull Market,” Federal Reserve Chair Janet Yellen, hinted at potentially raising interest rates in about 12 months, the mood soured further.
The unseasonably cold winter back east (a.k.a., Polar Vortex) has caused some additional jitters due to the dampening effects on economic conditions. More specifically, economic growth as measured by GDP (Gross Domestic Product) is expected to come in around a meager +2.0% rate during the first quarter of 2014, before picking up later in the year.
And if that isn’t enough, best-selling author Michael Lewis, whose books include Money Ball, The Blind Side, and Liar’s Poker, just came out on national television and sparked a debate with his controversial statement that the “stock market is rigged.” (read and listen more here)
Runners High
But as always, not everything is gloom and doom. Offsetting the temporary price fatigue, resilient record corporate profits have supported the surprising market stamina. Like a runner’s high, corporations are feeling elated about historically elevated profit margins. As you can see from the chart below, the reason it’s prudent for most to have some U.S. equity exposure is due to the clear, upward multi-decade trend of U.S. corporate earnings.
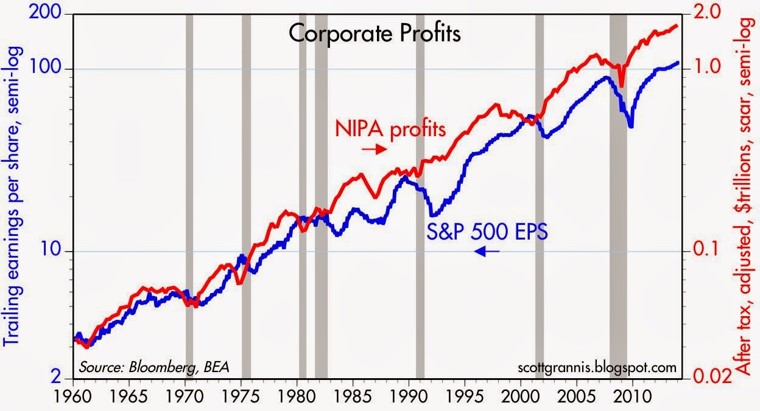
Source: Calafia Beach Plundit (gray areas are recessions)
While the skeptics wait for these game-ending dynamics to take root, core economic fundamentals in areas like these remain strong:I didn’t invent the idea of profits impacting the stock market, but the concept is simple: stock prices generally follow earnings over long periods of time (see It’s the Earnings, Stupid). In other words, as profits accelerate, so do stock prices – and the opposite holds true (decelerating earnings leads to price declines). This direct relationship normally holds over the long-run as long as the following conditions are not in place: 1) valuations are stretched; 2) a recession is imminent; and/or 3) interest rates are spiking. Fortunately for long-term investors, there is no compelling evidence of these factors currently in place.
Employment Adrenaline
The employment outlook received a boost of adrenaline last month. Despite the slight upward nudge in the unemployment rate to 6.7%, total nonfarm payroll jobs increased by +175,000 in February versus a +129,000 gain in January and an +84,000 gain in December. Not only was last month’s increase better than expectations, but the net figures calculated over the previous two months were also revised higher by +25,000 jobs. As you can see below, the improvement since 2009 has been fairly steady, but as the current rate flirts with the Fed’s 6.5% target, Chair Yellen has decided to remove the quantitative objective. The rising number of discouraged workers (i.e., voluntarily opt-out of job searching) and part-timers has distorted the numbers, rendering arbitrary numeric targets less useful.
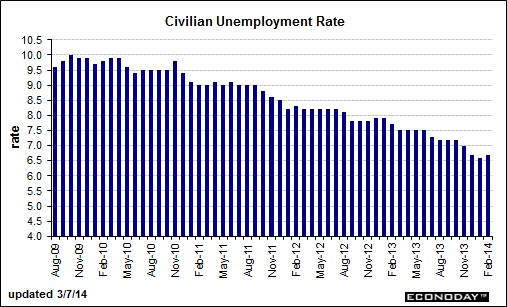
Source: Barron’s Online
Housing Holding Strong
In the face of the severe winter weather, the feisty housing market remains near multi-year highs as shown in the 5-month moving average housing start figure below. With the spring selling season upon us, we should be able to better gauge the impact of cold weather and higher mortgage rates on the housing market.
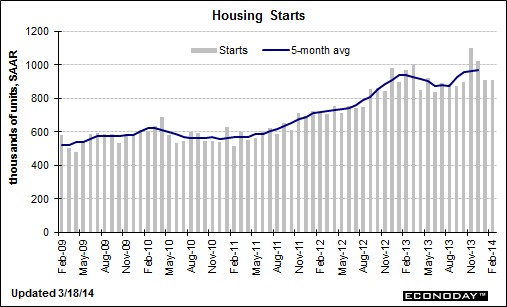
Source: Barron’s Online
Even though stock market investors found themselves jogging in place during the first quarter of the year, long-term investors are building up endurance as corporate profits and the economy continue to consistently grow in the background. Successful investors must realize stock prices cannot sustainably sprint for long periods of time without eventually hitting a wall and collapsing. Those who recognize investing as a marathon sport, rather than a mad dash, will be able to jump off the treadmill and ultimately reach their financial finish line.
Wade W. Slome, CFA, CFP®
Plan. Invest. Prosper.
DISCLOSURE: Sidoxia Capital Management (SCM) and some of its clients hold long positions in certain exchange traded funds (ETFs), but at the time of publishing SCM had no direct position in any other security referenced in this article. No information accessed through the Investing Caffeine (IC) website constitutes investment, financial, legal, tax or other advice nor is to be relied on in making an investment or other decision. Please read disclosure language on IC Contact page.
Investing, Housing, and Speculating

We all know there was a lot of speculation going on in the housing market during 2005-2007 as risk-loving adventurists loaded up on NINJA loans (No Income, No Job, and No Assets) and subprime CDS (Credit Default Swap) securities. But there is a different kind of speculation going on now, and it isn’t tied directly to housing. Instead of buying a house with no down payment and a no interest loan, speculators are leaping into other hazardous areas of danger. Like a frog jumping from lily pad to lily pad, speculators are now hopping around onto money-chasing industries, including biotech, social media, Bitcoin, and alternative energy.
As French novelist Jean-Baptise Alphonse Karr noted, “The more things change, the more they stay the same.” Irrespective of the painful consequences of the bubble-bursting aftermaths, human behavior and psychology addictively succumb to the ever-seductive emotion of greed. Over the last 15 years, massive fortunes have been gained and lost while chasing frothy financial dreams in areas like technology, housing, and gold.
Most get-rich-quick dream chasers have no idea of how to invest in or value a stock, but they sure know a good story when they hear one. Chasing top performing stocks is lot like jumping off a bridge – anyone can do it, and it feels exhilarating until you hit the ground. However, there is a better way to create wealth. Despite rampant speculation, most individuals understand the principles behind buying a house, which if applied to stocks, can make you a superior investor, and assist you in avoiding dangerous, speculative investments.
Here are some valuable housing insights to improve your stock buying:
#1.) Price is the Almighty Variable: Successful real estate investors don’t make their fortunes by chasing properties that double or triple in value. Buying a rusty tool shed for $1 million makes about as much sense as Facebook paying $19 billion (1,000 x’s the estimated 2013 annual revenues) for a money-losing company, WhatsApp. Better to buy real estate when there is blood in the street. Like the stock market, housing is cyclical. Many traders believe that price patterns are more important than the actual price. If squiggly, technical price moving averages (see Technical Analysis article) make so much money for stock-renting speculators, then how come day traders haven’t used their same crossing-lines and Point & Figure software in the housing market? Yes, it’s true that the real estate transactions costs and illiquidity can be costly for real estate buyers, but 6% load fees, lockup periods, 20% hedge fund fees, and 9% margin rates haven’t stopped stock speculators either.
#2). Cash is King: It doesn’t take a genius to purchase a rental property – I know because practically half the people I know in Southern California own rental properties. For example, if I buy a rental property for $1 million cash, is it a good purchase? Well, it depends on how much after-tax cash I can collect by renting it out? If I can only net $3,000 per month (3.6% annualized return), and be responsible for replacing roofs, fixing toilets, and evicting tenants, then perhaps I would be better off by collecting 6.5% from a low-cost, tax-efficient exchange traded real estate fund, without having to suffer from all the headaches that physical real estate investing brings. Forecasting future asset price appreciation is tougher, but the point is, understanding the underlying cash flow dynamics of a company is just as important as it is for housing purchases.
#3). Debt/Leverage Cuts in Both Directions: Adding debt (or leverage) to a housing or stock investment can be fantastic if prices go up, and disastrous if prices go down. Putting a 20% down payment on a $1 million house works out wonderfully, if the price of the house increases to $1.2 million. My $200,000 down payment is now worth $400,000, or up +100%. The same math works in reverse. If the price of the home drops to $800,000, then my $200,000 down payment is now worth $0, or down -100% (ouch). Margin debt on an equity brokerage account works in a similar fashion, but usually a 50% down payment is needed (less risky than real estate). That’s why I always chuckle when many real estate investors tell me they steer clear of stocks because they are “too risky”.
#4). Growth Matters: If you buy a home for $1 million, is it likely to be worth more if you add a kitchen, tennis court, swimming pull, third floor, and putting green? In short, the answer is yes. The same principle applies to stocks. All else equal, if a company based in Los Angeles, establishes new offices in New York, London, Beijing, and Rio de Janeiro, and then acquires a profitable competitor at a discounted price, chances are the company will be much more valuable after the additions. The key concept here is that asset values are not static. Asset valuations are impacted in both directions, whether we are talking about positive growth opportunities or negative disruptions.
Overall, speculatively chasing performance is tempting, but if you don’t want your financial foundation to crumble, then build your successful investment future by sticking to the fundamentals and financial basics.
Wade W. Slome, CFA, CFP®
Plan. Invest. Prosper.
DISCLOSURE: Sidoxia Capital Management (SCM) and some of its clients hold long positions in certain exchange traded funds (ETFs), but at the time of publishing SCM had no direct discretionary position in FB, Bitcoin, or any other security referenced in this article. No information accessed through the Investing Caffeine (IC) website constitutes investment, financial, legal, tax or other advice nor is to be relied on in making an investment or other decision. Please read disclosure language on IC Contact page.
Sports, Stocks, & the Magic Quadrants
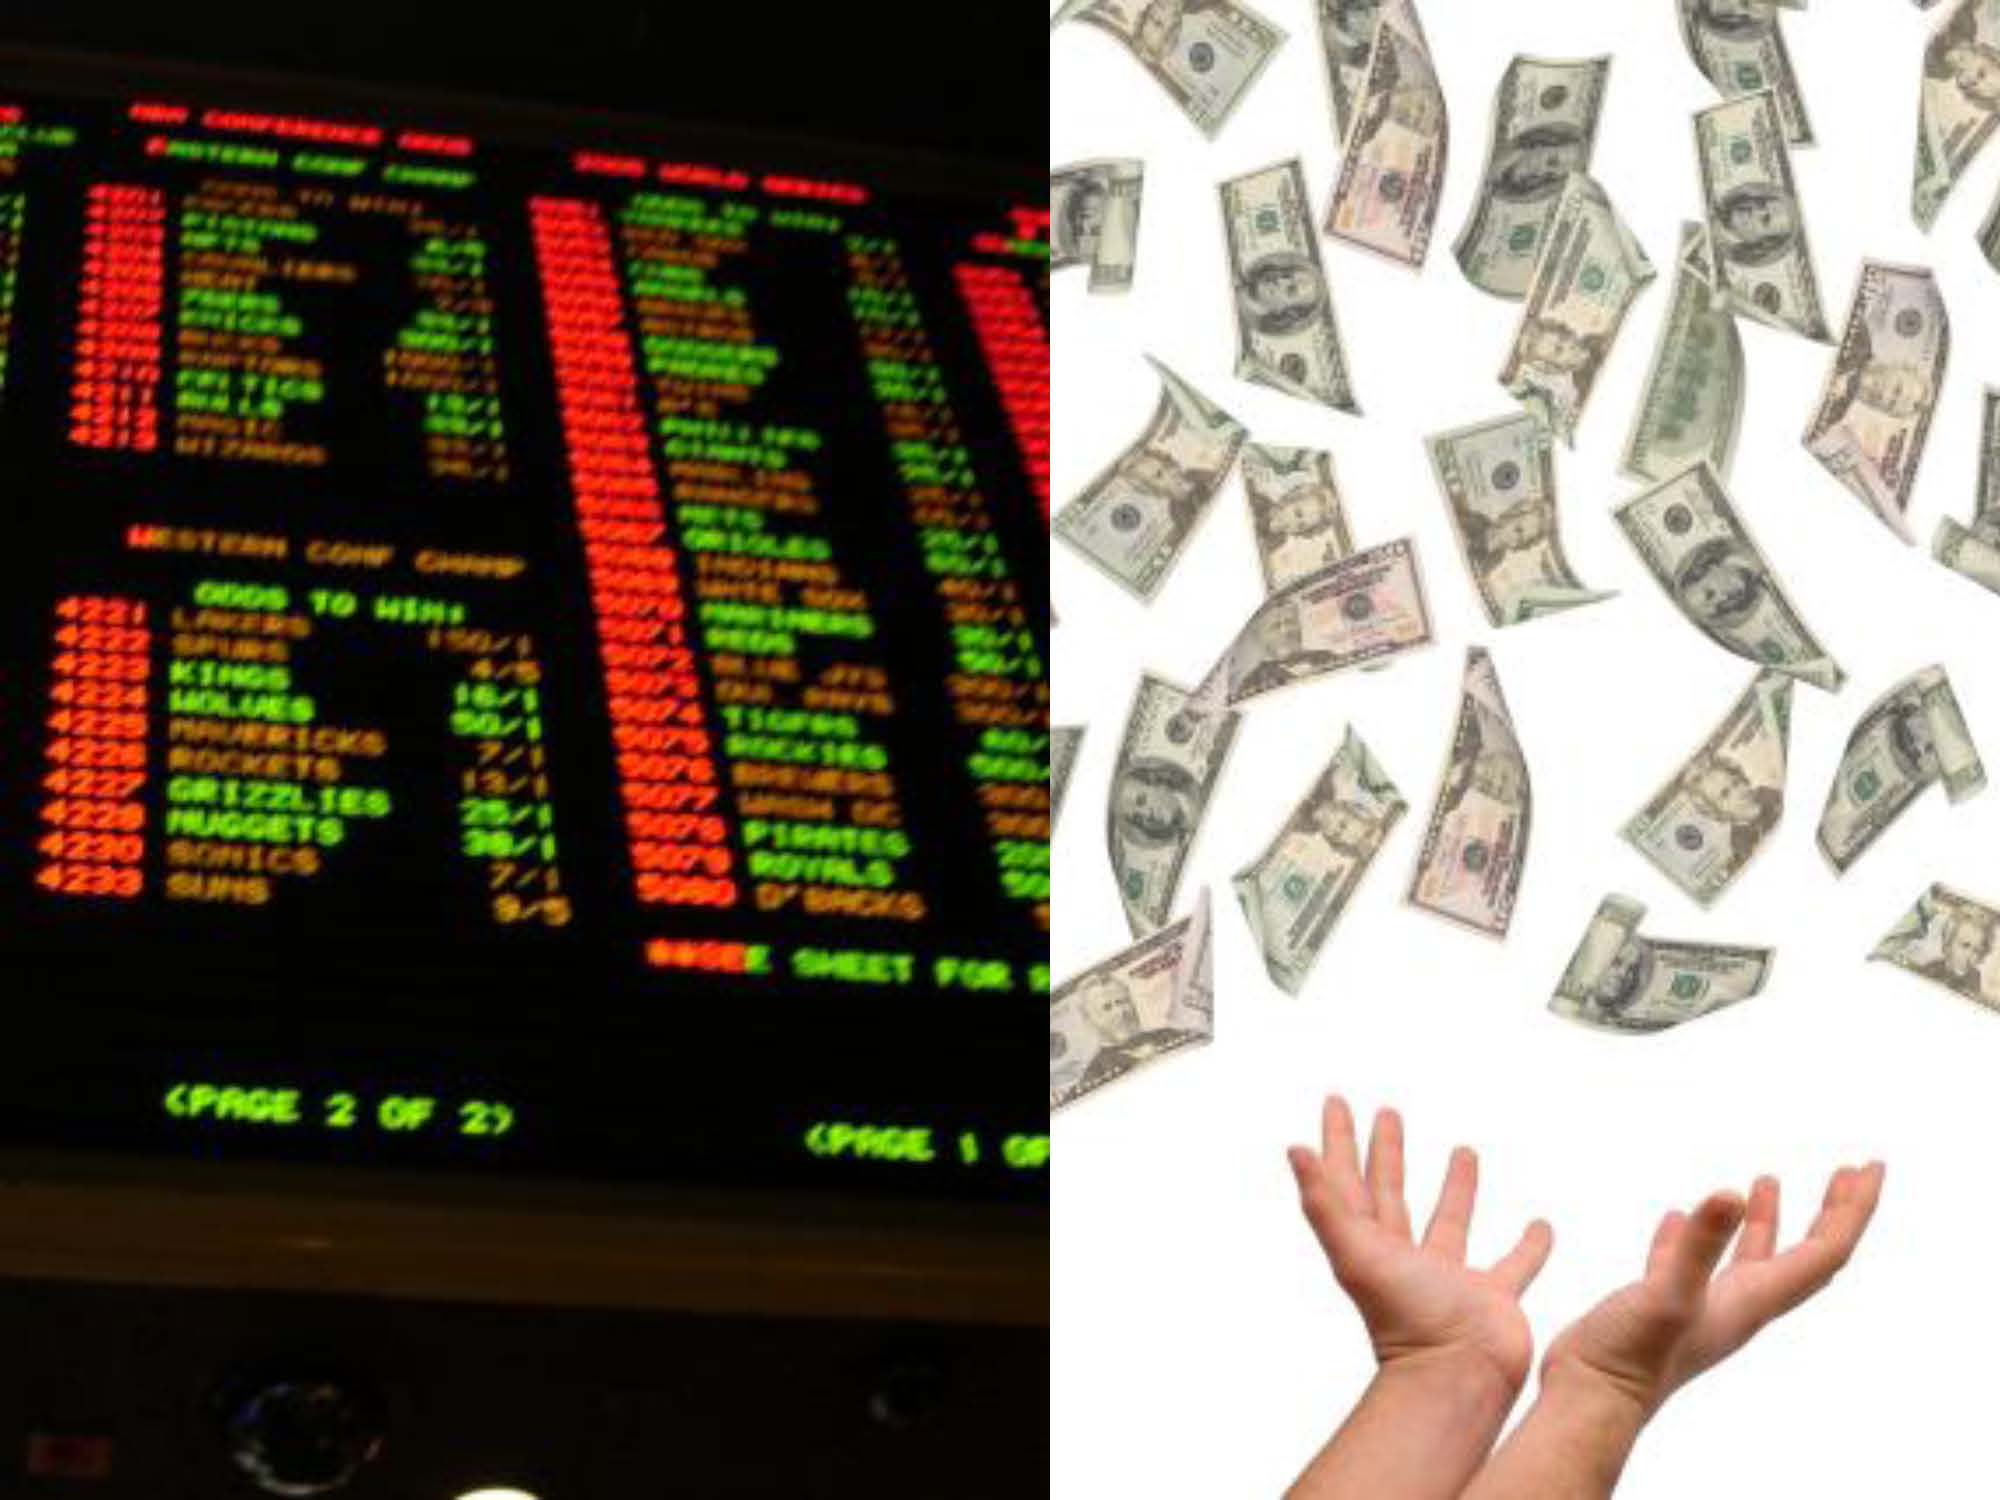
Picking stocks is a tricky game and so is sports betting. With the NFL and NCAA football seasons swinging into full gear, understanding the complexity of making money in the stock market can be explained in terms of professional sports-betting. Anybody who has traveled to Las Vegas and bet on a sporting event, understands that choosing a winner of a game simply is not enough…you also need to forecast how many points you think a certain team will win by (see also What Happens in Vegas, Stays on Wall Street). In the world of sports, winning/losing is measured by point spreads. In the world of stocks, winning/losing is measured by valuation (e.g., Price/Earnings ratios).
To make my point, here is a sports betting example from a handful years back:
Florida Gators vs. Charleston Southern Buccaneers (September 2009): Without knowing a lot about the powerhouse Southern Buccaneers squad from South Carolina, 99% of respondents, when asked before the game who would win, would unanimously select Florida – a consistently dominant, national franchise, powerhouse program. The question becomes a little trickier when participants are asked, “Will the Florida Gators win by more than 63 points?” Needless to say, although the Buccs kept it close in the first half, and only trailed by 42-3 at halftime, the Gators still managed to squeak by with a 62-3 victory. Worth noting, had you selected Florida, the overwhelming favorite, the 59 point margin of victory would have resulted in a losing wager (see picture below).

If investing and sports betting were easy, everybody would do it. The reason sports betting is so challenging is due to very intelligent statisticians and odds-makers that create very accurate point spreads. In the investing world, a broad swath of traders, market makers, speculators, investment bankers, and institutional/individual investors set equally efficient valuations.
The goal in investing is very similar to sports betting. Successful professionals in both industries are able to consistently identify inefficiencies and then exploit them. Inefficiencies occur for a bettor when point spreads are too high or low, while investors identify inefficient prices in the marketplace (undervalued or overvalued).
To illustrate my point, let’s take a look at Sidoxia’s “Magic Quadrant“:
 A-B-Cs & 1-2-3s
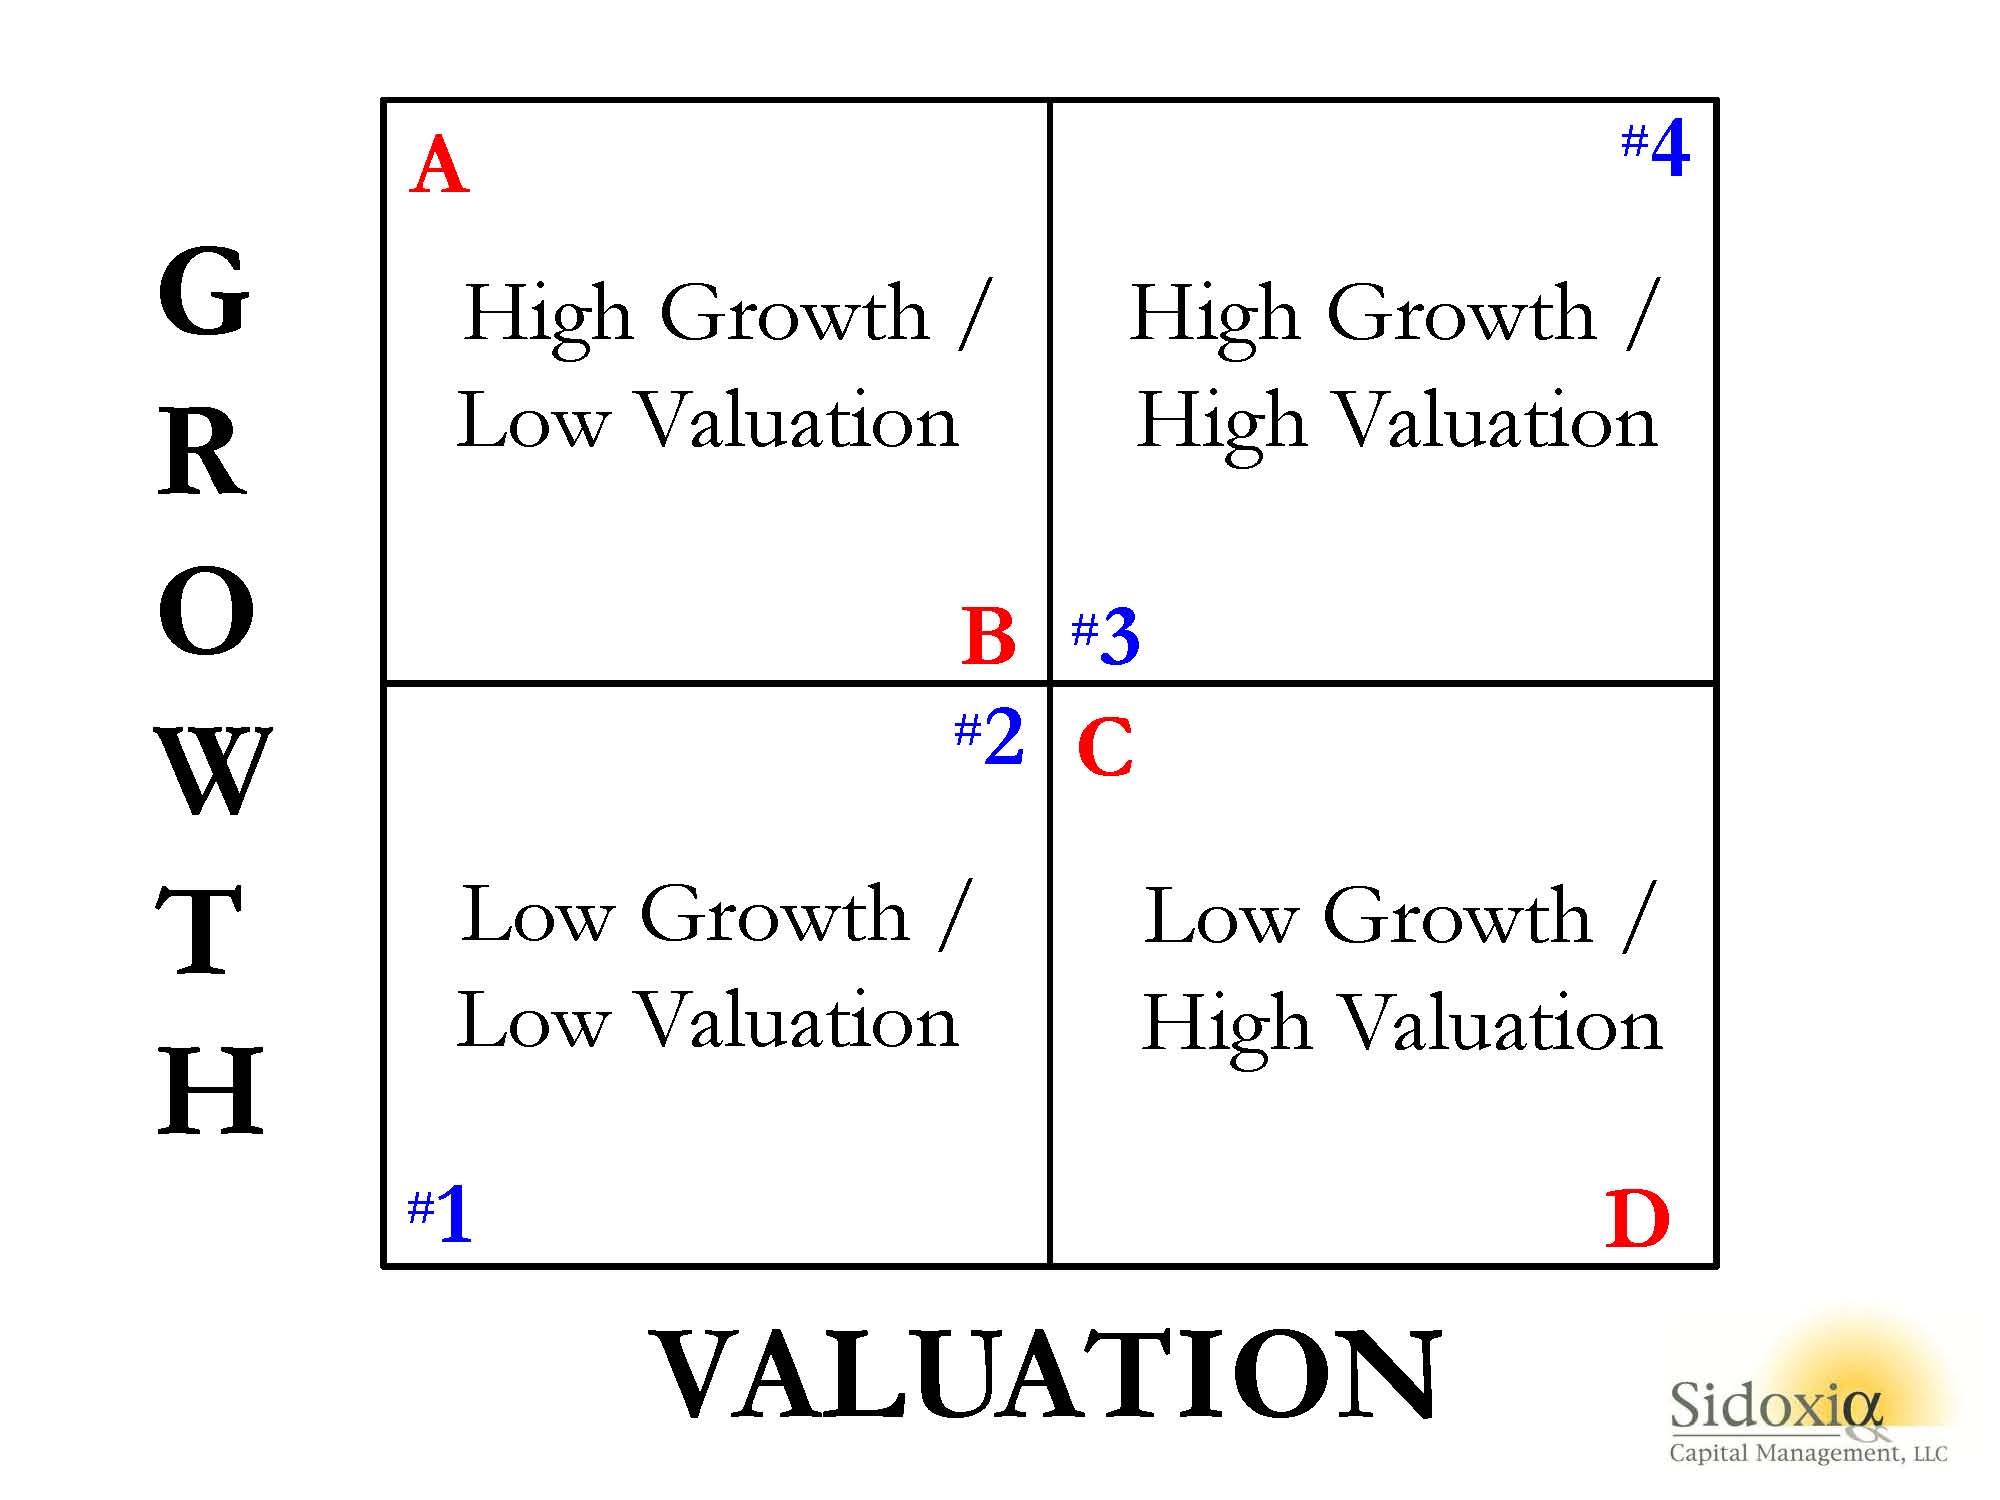
What Sidoxia’s “Magic Quadrant” demonstrates is a framework for evaluating stocks. By devoting a short period of time reviewing the quadrants, it becomes apparent fairly quickly that Stock A is preferred over Stock B, which is preferred over Stock C, which is preferred over Stock D. In each comparison, the former is preferred over the latter because the earlier letters all have higher growth, and lower (cheaper) valuations. The same relative attractive relationships cannot be applied to stocks #1, #2, #3, and #4. Each successive numbered stock has higher growth, but in order to obtain that higher growth, investors must pay a higher valuation. In other words, Stock #1 has an extremely low valuation with low growth, while Stock #4 has high growth, but an investor must pay an extremely high valuation to own it.
While debating the efficiency of the stock market can escalate into a religious argument, I would argue the majority of stocks fall in the camp of #1, #2, #3, or #4. Or stated differently, you get what you pay for. For example, investors are paying a much higher valuation (~100x 2014 P/E) for Tesla Motors, Inc (TSLA) for its rapid electric car growth vs. paying a much lower valuation (~10x 2014 P/E) for Pitney Bowes Inc (PBI) for its mature mail equipment business.
The real opportunities occur for those investors capable of identifying companies in the upper-left quadrant (i.e., Stock A) and lower-right quadrant (i.e., Stock D). If the analysis is done correctly, investors will load up on the undervalued Stock A and aggressively short the expensive Stock D. Sidoxia has its own proprietary valuation model (Sidoxia Holy Grail Ranking – SHGR or a.k.a. “SUGAR”) designed specifically to identify these profitable opportunities.
The professions of investing and sports betting are extremely challenging, however establishing a framework like Sidoxia’s “Magic Quadrants” can help guide you to find inefficient and profitable investment opportunities.
Wade W. Slome, CFA, CFP®
Plan. Invest. Prosper.
DISCLOSURE: Sidoxia Capital Management (SCM) and some of its clients hold positions in certain exchange traded funds (ETFs), but at the time of publishing, SCM had no direct position in TSLA, PBI, or any other security referenced in this article. No information accessed through the Investing Caffeine (IC) website constitutes investment, financial, legal, tax or other advice nor is the information to be relied on in making an investment or other decision. Please read disclosure language on IC Contact page.
Stocks Take a Breather after Long Sprint

Like a sprinter running a long sprint, the stock market eventually needs to take a breather too, and that’s exactly what investors experienced this week as they witnessed the Dow Jones Industrial Average face its largest drop of 2013 (down -2.2%) – and also the largest weekly slump since 2012. Runners, like financial markets, sooner or later suffer fatigue, and that’s exactly what we’re seeing after a relatively unabated +27% upsurge over the last nine months. Does a -2% hit in one week feel pleasant? Certainly not, but before the next race, the markets need to catch their breath.
By now, investors should not be surprised that pitfalls and injuries are part of the investment racing game – something Olympian Mary Decker Slaney can attest to as a runner (see 1984 Olympic 3000m final against Zola Budd). As I have pointed out in previous articles (Most Hated Bull Market), the almost tripling in stock prices from the 2009 lows has not been a smooth, uninterrupted path-line, but rather investors have endured two corrections averaging -20% and two other drops approximating -10%. Instead of panicking by locking in damaging transaction costs, taxes, and losses, it is better to focus on earnings, cash flows, valuations, and the relative return available in alternative asset classes. With generationally low interest rates occurring over recent periods, the available subset of attractive investment opportunities has narrowed (see Confessions of a Bond Hater), leaving many investing racers to default to stocks.
Recent talk of potential Federal Reserve bond purchase “tapering” has led to a two-year low in bond prices and caused a mini spike in interest rates (10-year Treasury note currently yielding +2.83%). At the margin, this trend makes bonds more attractive (lower prices), but as you can see from the chart below, interest rates are still relatively close to historically low yields. For the time being, this still makes domestic equities an attractive asset class.
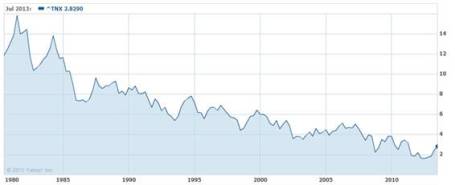
Source: Yahoo! Finance
Price Follows Earnings
The simple but true axiom that stock prices follow earnings over the long-run is just as true today as it was a century ago. Interest rates and price-earnings ratios can also impact stock prices. To illustrate my argument, let’s talk baseball. Wind, rain, and muscle (interest rates, PE ratios, political risk, etc.) are factors impacting the direction of a thrown baseball (stock prices), but gravity is the key factor influencing the ultimate destination of the baseball. Long-term earnings growth is the equivalent factor to gravity when talking about stock prices.
To buttress my point that stock prices following long-term earnings, consider the fact that S&P 500 annualized operating earnings bottomed in 2009 at $39.61. Since that point, annualized earnings through the second quarter of 2013 (~94% of companies reported results) have reached $99.30, up +151%. S&P 500 stock prices bottomed at 666 in 2009, and today the index sits at 1655, +148%. OK, so earnings are up +151% and stock prices are up +148%. Coincidence? Perhaps not.
If we take a closer look at earnings, the deceleration of earnings growth is unmistakable (see Financial Times chart below), yet the S&P 500 index is still up +16% this year, excluding dividends. In reality, predicting multiple expansion or contraction is nearly impossible. For example, earnings in the S&P 500 grew an incredible +15% in 2011, yet stock prices were anemically flat for that year, showing no price appreciation (+0.0%). Since the end of 2011, earnings have risen a meager +3%, however stock prices have catapulted +32%. Is this multiple expansion sustainable? Given stock P/E ratios remain in a reasonable 15-16x range, according to forward and trailing earnings, there is some room for expansion, but the low hanging fruit has been picked and further double-digit price appreciation will require additional earnings growth.
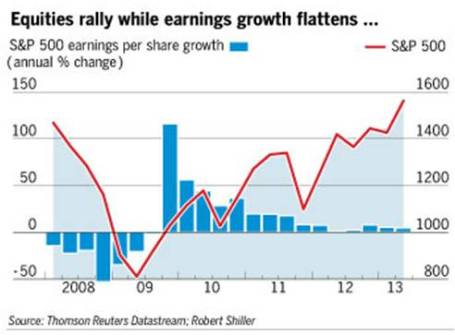
Source: Financial Times
But stocks should not be solely looked through a domestic lens…there is another 95% of the world’s population slowly embracing capitalism and democracy to fuel future dynamic earnings growth. At Sidoxia (www.Sidoxia.com), we are finding plenty of opportunities outside our U.S. borders, including alternative asset classes.
The investment race continues, and taking breathers is part of the competition, especially after long sprints. Rather than panic, enjoy the respite.
Wade W. Slome, CFA, CFP®
Plan. Invest. Prosper.
DISCLOSURE: Sidoxia Capital Management (SCM) and some of its clients hold positions in certain exchange traded funds (ETFs), but at the time of publishing, SCM had no direct position in any other security referenced in this article. No information accessed through the Investing Caffeine (IC) website constitutes investment, financial, legal, tax or other advice nor is to be relied on in making an investment or other decision. Please read disclosure language on IC Contact page.
The Challenge of Defining Growth vs. Value

“A challenge only becomes an obstacle when you bow to it.”
― Ray Davis (Famous General in the Marines)
In the investing world, one major challenge is defining the differences between “growth” vs. “value”. Warren Buffett said it best when he described growth and value as two separate sides of the same coin. In general, low or declining growth will be valued less than a comparable company with faster growth. Often, most companies go through a life cycle just like a human would (see Equity Life Cycle). In other words, companies frequently start small, grow larger, mature, and then die. Of course, some companies never grow, or because of lack of funding or outsized losses, end up suffering an early death. It’s tough to generalize with companies, because some businesses are more cat-like than human. For example, Apple Inc. (AAPL) may not have had nine lives, but the stock has been left for dead several times during its lifespan, before managing to resurrect itself from value status to growth darling (with a little assistance from Steve Jobs). Whether Tim Cook can lead Apple back to the Promised Land of growth remains to be seen, but many investors still see value.
Fluctuating price and earnings trends over a company’s life cycle frequently create confusion surrounding the proper categorization of a stock as growth or value. The other frustrating aspect to this debate is the absence of a universally accepted definition of growth and value. A few specialty companies have chosen to address this challenge. Russell Investments in Seattle, Washington is a leader in the benchmark/index creation field. Russell tackles the definitional issue by creating quantitatively based definitions, tediously explained in a thrilling 44-page paper titled, “Construction and Methodology.” Here is an exhilarating excerpt:
“Russell Investments uses a ‘non-linear probability’ method to assign stocks to the growth and value style valuation indexes. Russell uses three variables in the determination of growth and value. On the value side, book-to-price is used, while on the growth side, the I/B/E/S long-term growth variable was replaced by two variables- I/B/E/S forecast medium-term growth (2 yr) and sales per share historical growth (5 yr).”
As I bite my tongue in sarcasm, I like to point out that these methodologies constantly change – Russell most recently changed their methodology in 2011. What’s more, there are numerous other indexing companies that define growth and value quite differently (e.g., Standard & Poor’s, Lipper, MSCI, etc.).
Like religious beliefs that are viewed quite differently and are prone to passionate arguments, so too can be the debates over growth vs. value categorization. I’ve been brainwashed by numerous great investors (see Investor Hall Fame), and underpinning my philosophy is the belief that price follows earnings (see It’s the Earnings Stupid). As a result, I am constantly on the lookout for attractively priced stocks that have strong growth prospects. If Russell or S&P looked under the hood of my client portfolios, I’m certain they would find a healthy mix of growth and value stocks, as they define it. If they looked in Warren Buffett’s portfolio, arguably similar conclusions could be made. Most observers call Buffett a value investor, but over Buffett’s career, he has owned some of the greatest growth stocks of all-time (e.g., Coca Cola (KO), American Express Co (AXP), and Procter & Gamble (PG)).
At the end of the day, expectations embedded in the value of share prices determine future appreciation or depreciation, depending on how actual results register relative to those expectations. If stock prices are too high (as measured by the P/E, Price/Free-Cash-Flow, or other valuation metrics), slowing growth can lead to sharp and painful price declines. On the flip side, cheap or reasonably priced stocks can experience significant price appreciation if earnings and cash flows sustainably improve or accelerate.
In my view, the greatest stock pickers think about investing like sports handicapping (see What Happens in Vegas, Stays in Las Vegas). The key isn’t buying fast growth (high P/E) or slow growth (low P/E) companies, but rather discovering which stocks are mispriced. Finding heavily shorted stocks that are poised for growth, or discovering unloved stocks with underappreciated potential are both ways to make money.
While defining growth vs. value is certainly difficult, the more important challenge is calibrating a company’s future growth expectations and determining the fair price to pay for a stock based on those prospects. Investing entails many difficulties, but categorizing investors or stocks as growth or value is a less important challenge than honing forecasting and valuation skills. Investing is challenging enough without worrying about superfluous growth vs. value definitions.
Wade W. Slome, CFA, CFP®
Plan. Invest. Prosper.
DISCLOSURE: Sidoxia Capital Management (SCM) and some of its clients hold positions in certain exchange traded funds (ETFs), and AAPL, but at the time of publishing SCM had no direct position in KO, AXP, PG, MHP, or any other security referenced in this article. No information accessed through the Investing Caffeine (IC) website constitutes investment, financial, legal, tax or other advice nor is to be relied on in making an investment or other decision. Please read disclosure language on IC Contact page.
Vice Tightens for Those Who Missed the Pre-Party

The stock market pre-party has come to an end. Yes, this is the part of the bash in which an exclusive group is invited to enjoy the fruits of the festivities before the mobs arrive. That’s right, unabated access to the nachos; no lines to the bathroom; and direct access to the keg. For those of us who were invited to the stock market pre-party (or crashed it on their own volition), the spoils have been quite enjoyable – about a +128% rebound for the S&P 500 index from the bottom of 2009, and a +147% increase in the NASDAQ Composite index over the same period (excluding dividends paid on both indexes).
Although readers of Investing Caffeine have received a personal invitation to the stock market pre-party since I launched my blog in early 2009, many have shied away, out of fear the financial market cops may come and break-up the party.
Rather than partake in stock celebration over the last four years, many have chosen to go down the street to the bond market party. Unlike the stock market party, the fixed-income fiesta has been a “major-rager” for more than three decades. However, there are a few signs that this party has gotten out-of-control. For example, crowds of investors are lined up waiting to squeeze their way into some bond indulgence; after endless noise, neighbors are complaining and the cops are on their way to shut the party down; and PIMCO’s Bill Gross has just jumped off the roof to do a cannon-ball into the pool.
Even though the stock-market pre-party has been a blast, stock prices are still relatively cheap based on historical valuation measurements, meaning there is still plenty of time for the party to roll on. How do we know the party has just started? After five years and about a half a trillion dollars hemorrhaging out of domestic funds (see Calafia Beach Pundit), there are encouraging signs that a significant number of party-goers are beginning to arrive to the party. More specifically, as it relates to stocks, a fresh $10 billion has flowed into domestic equity mutual funds during this January (see ICI chart below). This data is notoriously volatile, and can change dramatically from month-to-month, but if this month’s activity is any indication of a changing mood, then you better hurry to the stock party before the bouncer stops letting people in.
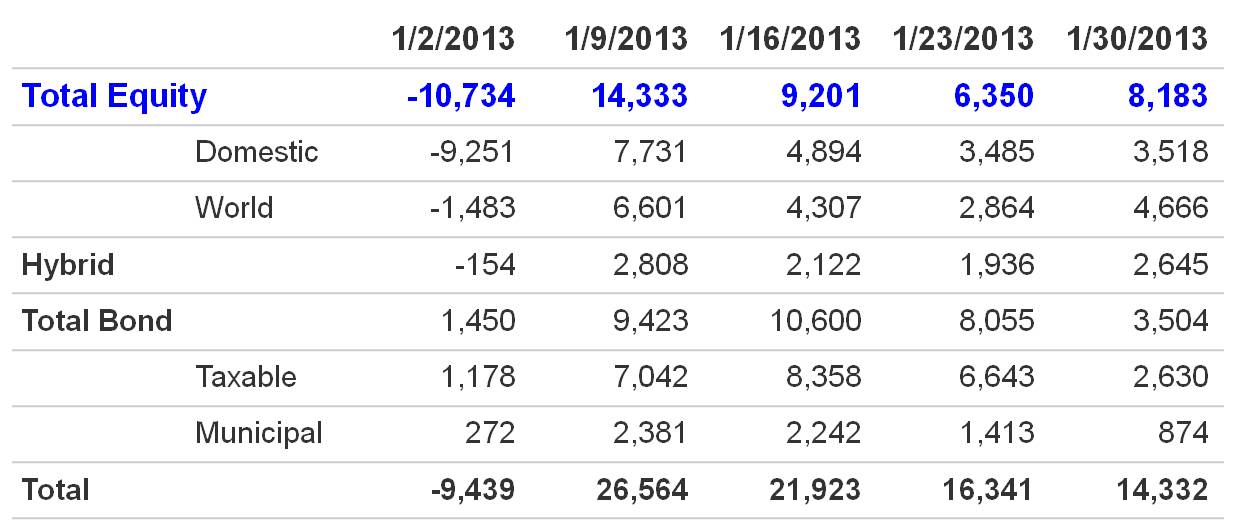
Source: Investment Company Institute (ICI)
Vice Begins to Tighten on Party Outsiders

Many stock market outsiders have either been squeezed into the bond market, hidden in cash, or hunkered down in a bunker with piles of gold. While some of these asset classes have done okay since early 2009, all have underperformed stocks, but none have performed worse than cash. For those doubters sitting on the equity market sidelines, the pain of the vice squeezing their portfolios has only intensified, especially as the economy and employment picture slowly improves (see chart below) and stock prices persist directionally upward. For years, fear-mongering stock skeptics have warned of an imploding dollar, exploding inflation, a run-away deficit/debt, a reckless money-printing Federal Reserve, and political gridlock. Nevertheless, none of these issues have been able to kill this equity bull market.
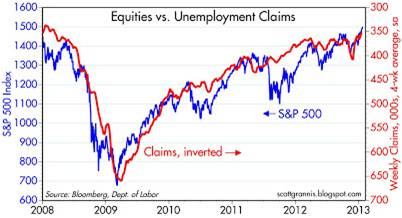
Source: Calafia Beach Pundit
But for those willing and able investors to enter the stock party today, one must realize this party will only get riskier over time. As we exit the pre-party and enter into the main event, you never know who may join the party, including some uninvited guests who may steal money, get sick on the carpet, participate in illegal activities, and/or ruin the fun by clashing with guests. We have already been forced to deal with some of these uninvited guests in recent years, including the “flash crash,” debt ceiling debate, European financial crisis, fiscal cliff, and lastly, sequestration is about to arrive as well (right after parking his car).
New investors can still objectively join the current equity party, but it is necessary to still be cognizant of not over-staying your welcome. However, for those party-pooping doubters who already missed the pre-party, the vice will continue to tighten, leaving stock cynics paralyzed as they watch additional missed opportunities enjoyed by the rest of us.
Wade W. Slome, CFA, CFP®
Plan. Invest. Prosper.
DISCLOSURE: Sidoxia Capital Management (SCM) and some of its clients hold positions in certain exchange traded funds (ETFs), but at the time of publishing SCM had no direct position in HLF, Japanese ETFs, or any other security referenced in this article. No information accessed through the Investing Caffeine (IC) website constitutes investment, financial, legal, tax or other advice nor is to be relied on in making an investment or other decision. Please read disclosure language on IC Contact page.
Risk of “Double-Rip” on the Rise

Okay, you heard it here first. I’m officially anointing my first new 2013 economic term of the year: “Double-Rip!” No, the biggest risk of 2013 is not a “double-dip” (the risk of the economy falling back into recession), but instead, the larger risk is of a double-rip – a sustained expansion of GDP after multiple quarters of recovery. I know, this sounds like heresy, given we’ve had to listen to perma-bears like Nouriel Roubini, Peter Schiff, John Mauldin, Mohamed El-Erian, Bill Gross, et al shovel their consistently wrong pessimism for the last 14 quarters. However, those readers who have followed me for the last four years of this bull market know where I’ve stood relative to these unwavering doomsday-ers. Rather than endlessly rehash the erroneous gospel spewed by this cautious clan, you can decide for yourself how accurate they’ve been by reviewing the links below and named links above:
Roubini calling for double-dip in 2012
Roubini calling for double-dip in 2011
Roubini calling for double-dip in 2010
Roubini calling for double-dip in 2009
If we switch from past to present, Bill Gross has already dug himself into a deep hole just two weeks into the year by tweeting equity markets will return less than 5% in 2013. Hmmm, I wonder if he’d predict the same thing now that the market is up about +4.5% during the first 18 days of the year?
Why Double-Rip Over Double-Dip?

How can stocks rip if economic growth is so sluggish? If forced to equate our private sector to a car, opinions would vary widely. We could probably agree the U.S. economy is no Ferrari. Faster growing countries like China, which recently reported 4th quarter growth of +7.9% (up from +7.4% in 3rd quarter), have lapped us complacent, right-lane driving Americans in recent years. But speed alone should not be investors’ only key objective. If speed was the number one priority, the only places investors would be placing their money would be in countries like Rwanda, Turkmenistan, and Libya (see Business Insider article). However, freedom, rule of law, and entrepreneurial spirit are other important investment factors to be considered. The U.S. market is more like a Toyota Camry – not very flashy, but it will reliably get you from point A to point B in an efficient and safe manner.
Beyond lackluster economic growth, corporate profit growth has slowed remarkably. In fact, with about 10% of the S&P 500 index companies reporting 4th quarter earnings thus far, earnings growth is expected to rise a measly 2.5% from a year ago (from a previous estimate of 3.0% growth). With this being the case, how can stock prices go up? Shrewd investors understand the stock market is a discounting mechanism of future fundamentals, and therefore stocks will move in advance of future growth. It makes sense that before a turn in the economy, the brakes will often be activated before accelerating into another fast moving straight-away.
In addition, valuation acts like shock absorbers. With generational low interest rates and a below-average forward 12-month P/E (Price-Earnings) ratio of 13x’s, this stock market car can absorb a significant amount of fundamental challenges. The oft quoted message that “In the short run, the market is a voting machine but in the long run it is a weighing machine,” from value icon Benjamin Graham holds as true today as it did a century ago. The recent market advance may be attributed to the voters, but long-term movements are ultimately tied to the sustainable scales of sales, earnings, and cash flows.
If that’s the case, how can someone be optimistic in the face of the slowing growth challenges of this year? What 2013 will not have is the drag of election uncertainty, the fiscal cliff, Superstorm Sandy, and an end-of-the-world Mayan calendar concern. This is setting the stage for improved fundamentals as we progress deeper into the year. Certainly there will be other puts and takes, but the absence of these factors should provide some wind under the economy’s sails.
What’s more, history shows us that indeed stock prices can go up quite dramatically (more than +325% during the 1990s) when consensus earnings forecasts continually get trimmed. We have seen this same dynamic since mid-2012 – earnings forecasts have come down and stock prices have gone up. Strategist Ed Yardeni captures this point beautifully in a recent post on his Dr. Ed’s Blog (see charts below).
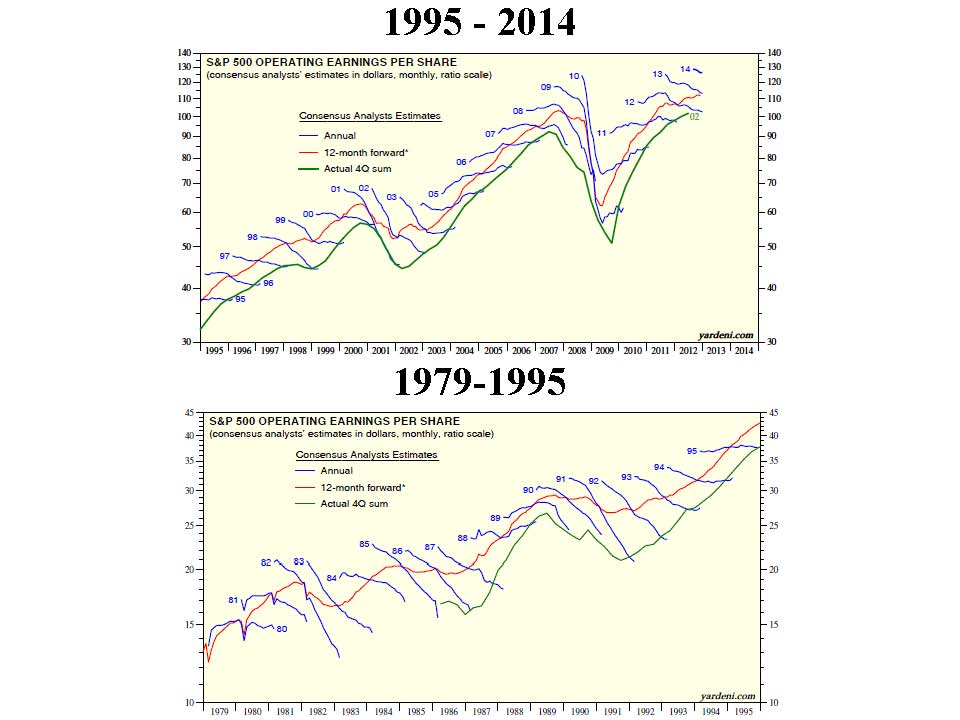
CLICK TO ENLARGE – Source: Dr. Ed’s Blog
What Will Make Me Bearish?
Am I a perma-bull, incessantly wearing rose-colored glasses that I refuse to take off? I’ll let you come to your own conclusion. When I see a combination of the following, I will become bearish:
#1. I see the trillions of dollars parked in near-0% cash start coming outside to play.
#2. See Pimco’s Bill Gross and Mohammed El-Erian on CNBC fewer than 10 times per week.
#3. See money flow stop flooding into sub-3% bonds (Scott Grannis) and actually reverse.
#4. Observe a sustained reversal in hemorrhaging of equity investments (Scott Grannis).
#5. Yield curve flattens dramatically or inverts.
#6. Nouriel and his bear buds become bullish and call for a “triple-rip” turn in the equity markets.
#7. Smarter, more-experienced investors than I, á la Warren Buffett, become more cautious. I arrogantly believe that will occur in conjunction with some of the previously listed items.
Despite my firm beliefs, it is evident the bears won’t go down without a fight. If you are getting tired of drinking the double-dip Kool-Aid, then perhaps it’s time to expand your bullish horizons. If not, just wait 12 months after a market rally, and buy yourself a fresh copy of the Merriam-Webster dictionary. There you can locate and learn about a new definition…double-rip!
Read Also: Double-Dip Guesses are “Probably Wrong”
Wade W. Slome, CFA, CFP®
Plan. Invest. Prosper.
DISCLOSURE: Sidoxia Capital Management (SCM) and some of its clients hold positions in certain exchange traded funds (ETFs), but at the time of publishing SCM had no direct position in Fiat, Toyota, or any other security referenced in this article. No information accessed through the Investing Caffeine (IC) website constitutes investment, financial, legal, tax or other advice nor is to be relied on in making an investment or other decision. Please read disclosure language on IC Contact page.
Sleeping Through Bubbles and Decade Long Naps

We have lived through many investment bubbles in our history, and unfortunately most investors sleep through the early wealth-creating inflation stages. Typically, the average investor wakes up later to a hot idea once every man, woman, and child has identified the clear trend…right as the bubble is about burst. Sadly, the masses do a great job of identifying financial bubbles at the end of a cycle, but have a tougher time realizing the catastrophic consequences of exiting a tired winner. Or as strategist Jim Stack states, “Bubbles, for the most part, are invisible to those trapped inside the bubble.” The challenge of recognizing bubbles explains why they are more easily classified as bubbles after a colossal collapse occurs. For those speculators chasing a precise exit point on a bubblicious investment, they may be better served by waiting for the prick of the bubble, then take a decade long nap before revisiting the fallen angel investment idea.
Even for the minority of pundits and investors who are able to accurately identify these financial bubbles in advance, a much smaller number of these professionals are actually able to pinpoint when the bubble will burst. Take for example Alan Greenspan, the ex-Federal Reserve Chairman from 1987 to 2006. He managed to correctly identify the technology bubble in late-1996 when he delivered his infamous “irrational exuberance” speech, which questioned the high valuation of the frothy, tech-driven stock market. The only problem with Greenspan’s speech was his timing was massively off. Stated differently, Greenspan was three years premature in calling out the pricking of the bubble, as the NASDAQ index subsequently proceeded to more than triple from early 1997 to early 2000 (the index exploded from about 1,300 to over 5,000).
One of the reasons bubbles are so difficult to time during their later stages is because the deflation period occurs so quickly. As renowned value investor Howard Marks fittingly notes, “The air always goes out a lot faster than it went in.”
Bubbles, Bubbles, Everywhere
Financial bubbles do not occur every day, but thanks to the psychological forces of investor greed and fear, bubbles do occur more often than one might think. As a matter of fact, famed investor Jeremy Grantham claims to have identified 28 bubbles in various global markets since 1920. Definitions vary, but Webster’s Dictionary defines a financial bubble as the following:
A state of booming economic activity (as in a stock market) that often ends in a sudden collapse.
Although there is no numerical definition of what defines a bubble or collapse, the financial crisis of 2008 – 2009, which was fueled by a housing and real estate bubble, is the freshest example in most people minds. However, bubbles go back much further in time – here are a few memorable ones:
Dutch Tulip-Mania: Fear and greed have been ubiquitous since the dawn of mankind, and those emotions even translate over to the buying and selling of tulips. Believe it or not, some 400 years ago in the 1630s, individual Dutch tulip bulbs were selling for the same prices as homes ($61,700 on an inflation adjusted basis). This bubble ended like all bubbles, as you can see from the chart below.

Source: The Stock Market Crash.net
British Railroad Mania: In the mid-1840s, hundreds of companies applied to build railways in Britain. Like all bubbles, speculators entered the arena, and the majority of companies went under or got gobbled up by larger railway companies.
Roaring 20s: Here in the U.S., the Roaring 1920s eventually led to the great Wall Street Crash of 1929, which finally led to a nearly -90% plunge in the Dow Jones Industrial stock index over a relatively short timeframe. Leverage and speculation were contributors to this bust, which resulted in the Great Depression.
Nifty Fifty: The so-called Nifty Fifty stocks were a concentrated set of glamour stocks or “Blue Chips” that investors and traders piled into. The group of stocks included household names like Avon (AVP), McDonald’s (MCD), Polaroid, Xerox (XRX), IBM and Disney (DIS). At the time, the Nifty Fifty were considered “one-decision” stocks that investors could buy and hold forever. Regrettably, numerous of these hefty priced stocks (many above a 50 P/E) came crashing down about 90% during the1973-74 period.
Japan’s Nikkei: The Japanese Nikkei 225 index traded at an eye popping Price-Earnings (P/E) ratio of about 60x right before the eventual collapse. The value of the Nikkei index increased over 450% in the eight years leading up to the peak in 1989 (from 6,850 in October 1982 to a peak of 38,957 in December 1989).

Source: Thechartstore.com
The Tech Bubble: We all know how the technology bubble of the late 1990s ended, and it wasn’t pretty. PE ratios above 100 for tech stocks was the norm (see table below), as compared to an overall PE of the S&P 500 index today of about 14x.

Source: Wall Street Journal – March 14, 2000
The Next Bubble
What is/are the next investment bubble(s)? Nobody knows for sure, but readers of Investing Caffeine know that long-term bonds are one fertile area. Given the generational low in yields and rates, and the near doubling of long-term Treasury prices over the last twelve years, it can be difficult to justify heavy allocations of inflation losing bonds for long time-horizon investors. Gold, another asset class that has increased massively in price (over 6-fold rise since about 2000) and attracted swaths of speculators, is another target area. However, as we discussed earlier, timing bubble bursts is extremely challenging. Nevertheless, the great thing about long-term investing is that probabilities and valuations ultimately do matter, and therefore a diversified portfolio skewed away from extreme valuations and speculative sectors will pay handsome dividends over the long-run.
Many traders continue to daydream as they chase performance through speculative investment bubbles, looking to squeeze the last ounce of an easily identifiable trend. As the lead investment manager at Sidoxia Capital Management, I spend less time sucking the last puff out of a cigarette, and spend more time opportunistically devoting resources to less popular growth trends. As demonstrated with historical examples, following the trend du jour eventually leads to financial ruin and nightmares. Avoiding bubbles and pursuing fairly priced growth prospects is the way to achieve investment prosperity…and provide sweet dreams.
Wade W. Slome, CFA, CFP®
Plan. Invest. Prosper.
DISCLOSURE: Sidoxia Capital Management (SCM) and some of its clients hold positions in certain exchange traded funds (ETFs) and are short TLT, but at the time of publishing SCM had no direct positions in AVP, MCD, XRX, IBM, DIS, or any other security referenced in this article. No information accessed through the Investing Caffeine (IC) website constitutes investment, financial, legal, tax or other advice nor is to be relied on in making an investment or other decision. Please read disclosure language on IC Contact page.
Sifting Through the Earnings Rubble

An earthquake of second quarter earnings results have rocked the markets (better than expected earnings but sluggish revenues), and now investors are left to sift through the rubble. With thousands of these earnings reports rolling in (and many more in the coming weeks), identifying the key investment trends across sectors, industries, and geographies can be a challenging responsibility. If this was an easy duty, I wouldn’t have a job! Fortunately, having a disciplined process to sort through the avalanche of quarterly results can assist you in discovering both potential threats and opportunities.
But first things first: You will need some type of reliable screening tool in order to filter find exceptional stocks. According to Reuters, there are currently more than 46,000 stocks in existence globally. Manually going through this universe one stock at a time is not physically or mentally feasible for any human to accomplish, over any reasonable amount of time. I use several paid-service screening tools, but there are plenty of adequate free services available online as well.
Investing with the 2-Sided Coin

As Warren Buffett says, “Value and growth are two sides of the same coin.” Having a disciplined screening process in place is the first step in finding those companies that reflect the optimal mix between growth and value. I am willing to pay an elevated price (i.e., higher P/E ratio) for a company with a superior growth profile, but I want a more attractive value (i.e., cheaper price) for slower growth companies. I am fairly agnostic between the mix of the growth/value weighting dynamics, as long as the risk-reward ratio is in my favor.
Since I firmly believe that stock prices follow the long-term trajectory of earnings and cash flows, I fully understand the outsized appreciation opportunities that can arise from the “earnings elite” – the cream of the crop companies that are able to sustain abnormally high earnings growth. Or put in baseball terms, you can realize plenty of singles and doubles by finding attractively priced growth companies, but as Hall of Fame manager Earl Weaver says, “You win many more games by hitting a three-run homer than you do with sacrifice bunts.” The same principles apply in stock picking. Legendary growth investor Peter Lynch (see also Inside the Brain of an Investing Genius) is famous for saying, “You don’t need a lot of good hits every day. All you need is two to three goods stocks a decade.”
Some past successful Sidoxia Capital Management examples that highlight the tradeoff between growth and value include Wal-Mart stores (WMT) and Amazon.com (AMZN). Significant returns can be achieved from slower, mature growth companies like Wal-Mart if purchased at the right prices, but multi-bagger home-run returns (i.e., more than doubling) require high octane growth from the likes of global internet platform companies. Multi-bagger returns from companies like Amazon, Apple Inc. (AAPL), and others are difficult to find and hold in a portfolio for years, but if you can find a few, these winners can cure a lot of your underperforming sins.
Defining Growth
Fancy software may allow you to isolate those companies registering superior growth in sales, earnings, and cash flows, but finding the fastest growing companies can be the most straightforward part. The analytical heavy-lifting goes into effect once an investor is forced to determine how sustainable that growth actually is, while simultaneously determining which valuation metrics are most appropriate in determining fair value. Some companies will experience short-term bursts of growth from a single large contract; from acquisitions; and/or from one-time asset sale gains. Generally speaking, this type of growth is less valuable than growth achieved by innovative products, service, and marketing.
The sustainability of growth will also be shaped by the type of industry a company operates in along with the level of financial leverage carried. For instance, in certain volatile, cyclical industries, sequential growth (e.g. the change in results over the last three months) is the more relevant metric. However for most companies that I screen, I am looking to spot the unique companies that are growing at the healthiest clip on a year-over-year basis. These recent three month results are weighed against the comparable numbers a year ago. This approach to analyzing growth removes seasonality from the equation and helps identify those unique companies capable of growing irrespective of economic cycles.
Given that we are a little more than half way through Q2 earnings results, there is still plenty of time to find those companies reporting upside fundamental earnings surprises, while also locating those quality companies unfairly punished for transitory events. Now’s the time to sift through the earnings rubble to find the remaining buried stock gems.
Wade W. Slome, CFA, CFP®
Plan. Invest. Prosper.
DISCLOSURE: Sidoxia Capital Management (SCM) and some of its clients own certain exchange traded funds and WMT, AMZN, AAPL, but at the time of publishing SCM had no direct position in any other security referenced in this article. No information accessed through the Investing Caffeine (IC) website constitutes investment, financial, legal, tax or other advice nor is to be relied on in making an investment or other decision. Please read disclosure language on IC “Contact” page.
Box Wine, Facebook and PEG Ratios

I’m no wine connoisseur, but I do know I would pay more for a bottle of Dom Pérignon champagne than I would pay for a container of Franzia box wine. In the world of stocks, the quality disparity is massive too. In order to navigate the virtually infinite number of stocks, we need to have an instrument in our toolbox that can assist us in accurately comparing stocks across the quality spectrum. Thank goodness we have the handy PEG ratio (Price/Earnings to Growth) that elegantly marries the price paid for a stock (as measured by the P/E ratio) with the relative quality of the stock (as measured by its future earnings growth rate).

Famed investor Peter Lynch (see Inside the Brain of an Investing Genius) understood the PEG concept all too well as he used this tool religiously in valuing and analyzing different companies. Given that Lynch earned a +29% annual return from 1977-1990, I’ll take his word for it that the PEG ratio is a useful tool. As highlighted by Lynch (and others), the key factor in using the PEG ratio is to identify companies that trade with a PEG ratio of less than 1. All else equal, the lower the ratio, the better potential for future price appreciation. Facebook Vs. Eastman Kodak
To illustrate the concept of how a PEG ratio can be used to compare stocks with two completely different profiles, let’s start by answering a few questions. Would a rational investor pay the same price (i.e., Price-Earnings [P/E] ratio) for a company with skyrocketing profits as they would for a company going into bankruptcy? Look no further than the lofty expected P/E multiple to be afforded to the shares of the widely anticipated Facebook (FB) initial public offering (IPO). That same rational investor is unlikely to pay the same P/E multiple for a money losing company like Eastman Kodak Co. (EKDKQ.PK) that faces product obsolescence. The contrasting values for these two companies are stark. Some pundits are projecting that Facebook shares could fetch upwards of a 100x P/E ratio, while not too long ago, Kodak was trading at a P/E ratio of 4x. Plenty of low priced stocks have outperformed expensive ones, but remember, just because a “value” stock may have a lower absolute P/E ratio in the recent past, does not mean it will be a better investment than a “growth” stock sporting a higher P/E ratio (see Fallacy of High P/Es).
Price, Earnings, and Dividends
As I’ve written in the past, a key determinant of future stock prices is future earnings growth (see It’s the Earnings Stupid). The higher the P/E multiple, the more important future earnings growth becomes. The lower the future growth, the more important valuation and dividends become.
We can look at various money-making scenarios that incorporate these factors. If my goal were to double my money in 5 years (i.e., earn a 100% return), there are numerous ways to skin the profit-making cat. Here are four examples:
1) Buy a non-dividend paying stock of a company that achieves earnings growth of 15%/year and maintains its current P/E ratio over time.
2) Buy a stock of a company that has a 5% dividend and achieves earnings growth of 11%/year and maintains its current P/E ratio over time.
3) Buy a value stock with a 5% dividend that achieves earnings growth of 5%/year and increase its P/E ratio by 10% each year.
4) Buy a non-dividend paying growth stock that achieves earnings growth of 20%/year and decreases its P/E ratio by about 5% each year.
I think you get the idea, but as you can see, in addition to earnings growth, dividends and valuation do play a significant role in how an investor can earn excess returns.
Lynch’s Adjusted PEG
Peter Lynch added a slight twist to the traditional PEG analysis by accounting for the role of dividends in the denominator of the PEG equation:
PEG (adjusted by Lynch) = PE Ratio/(Earnings Growth Rate + Dividend Yield)
This “adjusted PEG” ratio makes intuitive sense under various perspectives. For starters, if two different companies both had a PEG ratio of 0.8, but one of the two stocks paid a 3% dividend, Lynch’s adjusted PEG would register in at a more attractive level of 0.6 for the dividend paying stock.
Looked at under a different lens, let’s suppose there are two lemonade stands that IPO their stocks at the same time, and both companies use the exact same business model. Moreover, let us assume the following:
• Lemonade stand #1 has a P/E of 14x and growth rate of 15%.
• Lemonade stand #2 has a P/E of 12x and growth rate of 8%, but it also pays a dividend of 3%.
Given this information, which one of the two lemonade stands would you invest in? Many investors see the lower P/E of Lemonade stand #2, coupled with a nice dividend, as the more attractive opportunity of the two. But as we can see from Lynch’s “adjusted PEG” ratio, Lemonade stand #1 actually has the lower, more attractive value (.9 or 14/15 vs 1.1 or 12/(8+3)).
This analysis may be delving into the weeds a bit, but this framework is critical nonetheless. Valuation and earnings projections should be essential components of any investment decision, and with record low interest rates, dividend yields are playing a much more important role in the investment selection process. Regardless of your purchase decision thought process, whether deciding between Dom Perignon and box wine, or Facebook and Kodak shares, having the PEG ratio at your disposal should help you make wise and lucrative decisions.
Wade W. Slome, CFA, CFP®
Plan. Invest. Prosper.
DISCLOSURE: Sidoxia Capital Management (SCM) and some of its clients own certain exchange traded funds, but at the time of publishing SCM had no direct position in FB, EKDKQ.PK, or any other security referenced in this article. No information accessed through the Investing Caffeine (IC) website constitutes investment, financial, legal, tax or other advice nor is to be relied on in making an investment or other decision. Please read disclosure language on IC “Contact” page.


