Posts tagged ‘unemployment’
Animal Spirits to Animal Hibernation

Investor mood or sentiment can change rather quickly. Immediately after the 2024 presidential elections, positive animal spirits catapulted the stock market higher due to hopes of stimulating tax cuts and deregulation legislation. However, those warm and fuzzy feelings soured last month, as investor focus shifted to on-again, off-again tariff talks, and stagflation concerns, which have converted animal spirits into gloomy feelings of hibernation.
As a result, the advancing bull market took a breather and transformed into a weary bear during March. For the month, the S&P 500 (-5.8%), NASDAQ (-8.2%), and the Dow Jones Industrial Average (-4.2%) all fell significantly in the wake of tariffs, inflation, and recession worries.
Lovely Liberation Day or Tariff Trouble?
Since the President took office in January, he has announced, reversed, and implemented tariffs across a wide range of countries and sectors, including China, Canada, Mexico, the EU, Colombia, Venezuela, steel, aluminum, oil, automobiles, digital services taxes, and more.
The day of reckoning begins on April 2nd, designated Liberation Day by the president. This is when the president and the White House officially announce global reciprocal tariffs on foreign countries in an attempt to reverse the nation’s large trade deficit (see chart below) and bring manufacturing back to the United States. For example, if Germany subsidizes BMW cars sold in the U.S. while simultaneously placing tariffs (i.e., additional taxes) on American Ford Explorers sold in Germany, the president wants to impose equivalent reciprocal tariffs on those same BMWs sold in the U.S. in an effort to level the trading playing field. On the surface, a $131 billion trade deficit sounds very significant, but when compared to a $30 trillion economy (Gross Domestic Product – GDP), this negative trade balance represents less than 0.5% of GDP – effectively a rounding error. I have previously written how tariffs represent more of a molehill than a mountain (see Tariff Sheriff), in part because consumer spending and services make up the vast majority of our country’s economic activity, whereas trade and manufacturing are relatively smaller segments.

Source: Trading Economics
Driving home the point that tariffs are more bark than bite, Senior White House trade and manufacturing counselor Peter Navarro recently stated the 2025 tariffs could add $700 billion annually to U.S. revenues, including $100 billion from the recently announced 25% auto tariffs. Many economists believe this collection estimate is too optimistic. However, even if this target is achievable, $700 billion only represents a measly 2% of overall GDP.
Tariffs = Recession or Stagflation?
With the recent stock market downdraft and growing concerns related to tariffs, some economists and pundits are raising the probability of a recession and the possibility of inflation accompanying an economic downturn (i.e., stagflation).
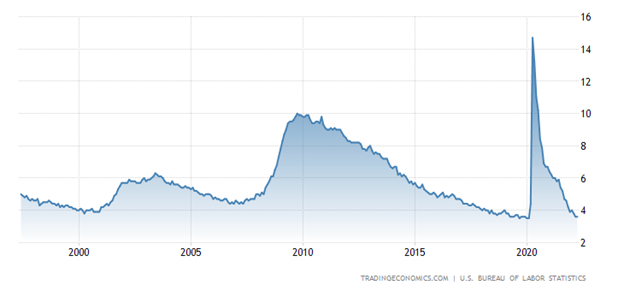
Economic data should clear some of the fog. Fresh employment numbers will be released this Friday, which should shine some light on the health of the economy. Irrespective of this month’s results, the most recent 4.1% unemployment rate (see chart below), though slightly higher over the last two years, does not strongly indicate a recession.

Source: Trading Economics
Other “hard” data, such as GDP, also suggest a slowing economy rather than a recession. For instance, a recent survey of 14 economists estimates the economy is growing at a paltry +0.3% rate in Q1 – 2025 versus +2.3% in Q4 – 2024. Data is continually changing, but if a looming recession were imminent, corporate earnings would likely be trending downward, not upwards, as evident in the chart below.

Source: Yardeni Research
Tariff Inflation Has Yet to Arrive
There is no doubt tariffs function as a tax hike on consumers because U.S. companies that pay the tariffs on imported goods are eventually forced to raise prices to maintain profit margins or limit margin degradation.
Nonetheless, inflation did not spike under President Trump’s first term. Even if the president’s new policies result in more aggressive tariff actions this go-around, inflation will likely remain in check due to the point mentioned earlier – imported goods represent a small percentage of overall consumer and business purchases.
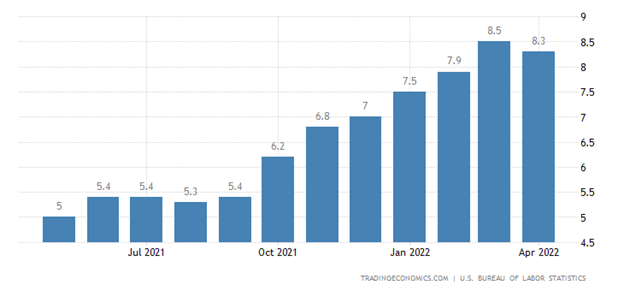
Tariff implementation is just beginning, so only time will tell how pervasive inflation will become. However, what we do know now is that inflation has declined dramatically over the last couple of years and has not yet spiked (see Consumer Price Index chart below).

Source: Calafia Beach Pundit
Where Could I Be Wrong?
I have explained how some of the lagging “hard” data does not signal recession or stagflation, but what could I be missing? For starters, some of the leading “soft” data (e.g., surveys) indicate various cracks in the economic foundation are forming. Take the recent Consumer Confidence data (see chart below), which has weakened dramatically from pre-COVID and even post-COVID levels.

Source: Trading Economics
It’s not just consumers who are feeling uneasy about the economic environment; businesses are as well. Another soft data point flashing red is the NFIB Small Business Uncertainty index, which recently reported its second-highest reading in 48 years (see chart below). Even if my argument that tariffs are too small to materially impact the economy holds, if the psychological effects of tariff uncertainty paralyzes consumer and business economic activity to a standstill, then tariffs could indeed become a substantial factor.

Source: National Federation of Independent Business (NFIB)
What Comes Next After Liberation Day?
Liberation Day is unlikely to trigger an immediate and sustained V-shaped recovery in the stock market because international trading partners will be forced to announce retaliatory tariffs in response to President Trump’s reciprocal tariffs, potentially leading to additional reactionary tariffs by the U.S.
Additionally, the reciprocal tariffs announced on April 2nd will likely serve as a starting point for subsequent negotiations with trading partners. Without a comprehensive resolution, investor sentiment will likely remain somewhat unresolved and unsettled. Regardless of your views on the size and impact of tariffs, Liberation Day will at least bring some clarity and reduce the uncertainty surrounding the current murky and chaotic environment.
The multi-year bull market continued its charge after the presidential election, but investor sentiment has weakened the bull run due to tariff uncertainty. In response, the excited bull has temporarily turned into a sleepy bear. Depending on how these tariff events unfold, we will soon find out whether Liberation Day will awaken the bear to hunt for bulls or send it into deep hibernation.
Wade W. Slome, CFA, CFP®
Plan. Invest. Prosper.
This article is an excerpt from a previously released Sidoxia Capital Management complimentary newsletter (April 1, 2025). Subscribe Here to view all monthly articles.
DISCLOSURE: Sidoxia Capital Management (SCM) and some of its clients hold positions in certain exchange traded funds (ETFs), but at the time of publishing had no direct position in F or any other security referenced in this article. No information accessed through the Investing Caffeine (IC) website constitutes investment, financial, legal, tax or other advice nor is to be relied on in making an investment or other decision. Please read disclosure language on the IC Contact page.
Past Elections Status Quo Means No Need for Woe

Scarier than Halloween, the current presidential election is causing people on both sides of the political aisle to be frightened by the idea of their candidate potentially losing. Uncertainty is generally petrifying to investors, resulting in downward pressure on stock prices, but with less than a week until election day, the stock market is providing more treats than tricks. Sweetness has come in the form of a stock market up +20% in 2024 (up 8 out of 10 months this year), and only off -3% from its record high reached a few weeks ago. For the month, investors experienced modest declines as they braced for the election results. The S&P 500 dropped -1.0%, the Dow Jones Industrial Average -1.3%, and NASDAQ -0.5%.
Regardless of whether the red team or blue team wins the presidential election, the good news is history reminds us the end result has little effect on the long-term results of the stock market. As you can see from the chart below, over the last century, stock prices have gone up under both Republican and Democrat presidents. As Mark Twain famously stated, “History doesn’t repeat itself, but it often rhymes.” If that’s the case, past elections teach us, there is no need to fear the status quo of a Republican or Democrat president.

Source: Yardeni Research (Yardeni.com)
More recently, over the last 26 years, the stock market has been up significantly under each president, regardless of political party. Here are the results of the S&P 500 under the last three presidents:
- President Barack Obama(November 4, 2008 – November 8, 2016 – Democrat): +137%
- President Donald Trump(November 8, 2016 – November 3, 2020 – Republican): +51%
- President Joe Biden (November 3, 2020 – Present – Democrat): +63%
No matter who wins the White House, they will be inheriting a relatively strong economy. Consider the following tailwinds benefitting the new president:
- Strong Economy: The broadest measurement of economic activity, Gross Domestic Product (GDP), registered a healthy +2.8% growth rate for Q3
- Resilient Jobs Market: The just-reported unemployment rate of 4.1% today is representative of a strong but slowing job market. The unemployment rate has climbed modestly since troughing in 2023, but unemployment is still relatively low compared to historic levels much higher.
- Declining Inflation: As I pointed out last month (see Rate Cut Adrenaline) inflation has been on a fairly consistent downward trajectory over the last two years, which has allowed the Federal Reserve to cut interest rates by 0.50% in September. Moreover, based on the current economic environment, the Fed has signaled more stimulative interest rate cuts are likely ahead – economic strategists and pundits are predicting another 0.25% cut at the next Federal Reserve meeting that occurs over the two days following the elections.
- Record Corporate Profits (see chart below): The United States economy is the envy of the world, and the reason why is evident by the 65-year chart below showing record corporate profits and GDP. If you were an entrepreneur, where would you choose to start your company? China? Japan? UK? Russia? There’s plenty of room for improvements in our country’s policies, but there’s a reason the U.S. dominates in creating the largest and most profitable multi-trillion companies in the world.

Source: Calafia Beach Pundit
One area for improvement in the U.S. revolves around our fiscal debt and deficits. Our government simply spends too much money and doesn’t collect enough (tax receipts) to cover those expenses (see chart below). Another lesson to learn from our government’s excessive spending over the last four decades is that the glut of expenditures can’t be blamed on any one political party – the slope of spending is consistently up and to the right for all serving politicians.

Source: Calafia Beach Pundit
As I have mentioned in the past, stocks do not perpetually move up forever. However, regardless of the election outcome, we know from history that up-markets (bull markets) occur about 85% of the time, if we look at the last 100 years (see chart below). Analysis by Dimensional Fund Advisors shows that from 1926 – 2023, bull markets have lasted 994 months versus much shorter bear markets of 177 months.

Source: Dimensional Fund Advisors
It is very possible that stock prices may take a breather or correct under various election outcomes, but if we follow the historic status quo, there will be no long-term reason for woe.
Wade W. Slome, CFA, CFP®
Plan. Invest. Prosper.
This article is an excerpt from a previously released Sidoxia Capital Management complimentary newsletter (November 1, 2024). Subscribe Here to view all monthly articles.
DISCLOSURE: Sidoxia Capital Management (SCM) and some of its clients hold positions in individual stocks , certain exchange traded funds (ETFs), but at the time of publishing had no direct position in any other security referenced in this article. No information accessed through the Investing Caffeine (IC) website constitutes investment, financial, legal, tax or other advice nor is to be relied on in making an investment or other decision. Please read disclosure language on IC Contact page.
Bad News is Good News?

Remember that global pandemic back in 2020 called COVID-19 that killed over 350,000 people in the U.S.? That same year, the unemployment rate reached a sky-high level of 14.9% (vs. 3.9% most recently) and the economy went into recession with GDP (Gross Domestic Product) declining by -2.2%. With the whole population locked in their homes and 9.4 million businesses closed, this debacle doesn’t sound like a real great environment for the stock market. What did the stock market actually do in 2020? The S&P 500 surged +16.3% (see chart below). Bad economic news turned out to be good news for stocks.

On the flip side, during 2022, the economy was firing on all cylinders. GDP was advancing at a reasonable +1.9% growth rate, and the unemployment rate stood at a near generationally low rate of 3.6%. What did the stock market do? It fell -19%. This time around, good economic news meant bad news for stock prices, primarily because the Federal Reserve was slamming the brakes on the economy by increasing the Federal Funds interest rate target.
These examples are powerful reminders that the direction of economic trends does not necessarily move in tandem with the direction of the stock market. Just this last month, investors experienced this same phenomenon when GDP growth figures were revised lower from +1.6% to +1.3%, and pending home sales dropped by -7.7% to the lowest level in four years during the pandemic. What did the stock market do last month? The S&P climbed +4.8% and the NASDAQ soared +6.9%. Once again, bad news has equaled good news due to higher hopes for Fed interest rate cuts.
For the year, the S&P has already appreciated a very respectable +10.6%. This stellar performance has come despite heated election concerns, persistent wars overseas, nervousness over the Federal Reserve’s monetary policy, and wild volatility in the cryptocurrency markets.
Fighting against these headwinds has been the tsunami of corporate investing dollars piling into the Artificial Intelligence (AI) spending tidal wave. I have been writing about this trend for a while (see AI World) and NVIDIA Corp (NVDA) confirmed this trend a couple weeks ago, when the AI juggernaut reported its fiscal first quarter financial results. Not only did NVIDIA more than triple its revenue above $26 billion for the three-month period compared to last year, but the company also increased its net profit by more than seven-fold to almost $15 billion for the quarter, in addition to announcing a 10-for-1 stock split (see chart below).

What these examples teach you is that it is a fruitless effort for investors to try to time the market based on economic news headlines. Yet, every day you turn on the television or comb through the avalanche of news headlines through various media outlets, there is always some Armageddon story about an impending market crash, or some other speculative, get-rich-quick scheme. As Warren Buffett states, “Investing is like dieting. Easy to understand, but difficult to execute.”
In other words, there is no simple solution to investing. It requires patience, discipline, and financial emotional wherewithal to allow the power of long-term compounding to grow your retirement nest egg. Short-term news cycle headlines shouldn’t drive portfolio decision-making, but rather your personal objectives, goals, and risk tolerance. These items are not static, and can change over time, therefore it’s important to revisit your asset allocation periodically as financial circumstances and life events change your objectives.
Of course, improving economic news can also lead to rising stock prices, just as deteriorating economic news can result in declining prices. Regardless, attempting to time the market is a fool’s errand. Rather than trying to maneuver in and out of the stocks, long-term investors should focus more intently on the four key factors that drive the direction of the stock market: corporate profits, interest rates, valuations, and investor sentiment (see also Don’t Be a Fool, Follow the Stool). If you understand the stock market doesn’t logically follow the daily headlines, and instead you follow the key fundament factors driving equity markets, then your investment portfolio should be blessed with plenty of good news.
Wade W. Slome, CFA, CFP®
Plan. Invest. Prosper.
This article is an excerpt from a previously released Sidoxia Capital Management complimentary newsletter (June 3, 2024). Subscribe Here to view all monthly articles.
DISCLOSURE: Sidoxia Capital Management (SCM) and some of its clients hold positions in individual stocks , certain exchange traded funds (ETFs), including NVDA,, but at the time of publishing had no direct position in any other security referenced in this article. No information accessed through the Investing Caffeine (IC) website constitutes investment, financial, legal, tax or other advice nor is to be relied on in making an investment or other decision. Please read disclosure language on IC Contact page.
Mission Accomplished?

The Federal Reserve has a “dual mandate” designed to “foster economic conditions that achieve both stable prices and maximum sustainable employment.” The “dual mandate” is obviously a moving target, but it appears for now, based on the Fed’s explicit goals, Fed Chairman, Jerome Powell, has accomplished the central bank’s mission. More specifically, inflation, according to the just-reported BEA’s (Bureau of Economic Analysis) GDP Price Deflator statistics, has plummeted dramatically to the Fed’s goal of 2.0% from the sky-high inflation number of 9.1% a year ago (see chart below). Meanwhile, the economy continues to grow (+2.0% GDP growth in the 2nd quarter), and the long-awaited recession boogeyman has yet to appear.
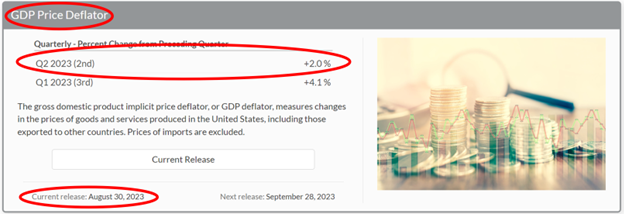
Source: Bureau of Economic Analysis
Rate Pig Moving Through Economic Python
How has inflation plunged so quickly? For starters, in addition to the Fed’s restrictive policy of reducing the balance sheet, since the beginning of last year, the Fed has also effectively slammed the brakes on the economy by taking their target interest rate from 0% to 5.5%. The pace and scale of the interest rate increases have been reduced this year, however it is possible there might be more rate hikes ahead (currently, pundits are betting for no more rate increases this year, although a boost in November is possible if economic data accelerates). Like a pig working its way through the economic python, the large interest rate increases naturally take a while to work their way through the consumer, commercial, and government credit markets.
To put things in better perspective, a study done earlier this year showed the average 30-year monthly mortgage payment for a $500,000 home was higher by more than $800 (up +44%) versus a year ago! But wait, it’s not just consumers feeling the pinch of higher rates. Businesses and governments in all shapes and sizes have felt the pain as well from higher borrowing costs. Post-COVID supply chain constraints and disruptions have eased too, which have helped choke down the high inflation numbers. In the background, let’s not also forget about the disinflationary benefits of ever-expanding technology adoption coupled with the related productivity advantages (see also AI Revolution).
As a result of these dynamics, we are now starting to see cracks appear in our country’s employment foundation as this month’s JOLTs (Job Openings and Labor Turnover – see black line in chart below) and ADP monthly job additions data, which both came in disappointingly low compared to forecasts. Chairman Powell must be ecstatic inflation has plummeted, while the unemployment rate remains near multi-decade lows, and Gross Domestic Product (GDP) growth continues expanding (i.e., no recession in sight).
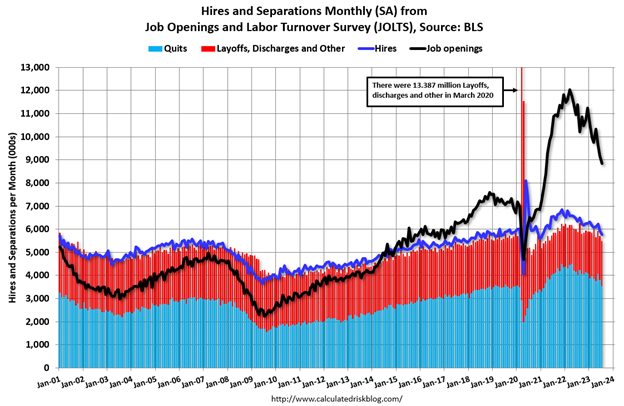
Source: Calculated Risk and U.S. Bureau of Labor Statistics
Hot Summer, Hot Stocks
Economic activity clearly can and will change, but the stock market has been like the weather this summer…hot. However, after experiencing up-months in six out of the first seven months of 2023, the S&P 500 index decided to take a small breather this month. For August, the S&P slipped -1.8%, but the month was a tale of two cities. By the middle of the month, the index had fallen by roughly -6% on fears of potentially more aggressive interest rate hikes by the Federal Reserve due to better than anticipated economic data. In other words, inflation fears were on the rise and the 10-Year Treasury Note yield temporarily climbed to a 52-week high. By the end of the month, economic data cooled, interest rates dropped a little, and stock prices rebounded smartly by +4.0% to finish the month on a strong note.
For the year, the S&P’s remain strongly positive, up +17.4%. As I have written in the past, the seven largest companies in the S&P 500 index (a.k.a., The Magnificent 7: Apple Inc.; Microsoft Corp.; Alphabet Inc.; Amazon.com, Inc.; NVIDIA Corp.; Tesla, Inc.; and Meta Platforms, Inc.) have contributed to a significant portion of the year’s gains – the average Magnificent 7 stock has skyrocketed an eye-popping +99.0% with NVIDIA being the largest winner, more than tripling in value during the first eight months of the year.
The Federal Reserve can admit they were late to the game in taming out-of-control inflation, but Fed Chair Powell has been swift in moving to preserve his legacy as an inflation fighter. Now that inflation is coming under control and the economy is beginning to cool, Powell needs to make sure he doesn’t murder the economy into recession with overzealous future interest rate increases. Time will tell if the mission has already been accomplished, but so far, the Fed has been delicately balancing an economic soft landing and stock market investors like it.
Wade W. Slome, CFA, CFP®
Plan. Invest. Prosper.
This article is an excerpt from a previously released Sidoxia Capital Management complimentary newsletter (September 1, 2023). Subscribe Here to view all monthly articles.
DISCLOSURE: Sidoxia Capital Management (SCM) and some of its clients hold positions in AAPL, MSFT, GOOGL, AMZN, NVDA, TSLA, META, and certain exchange traded funds (ETFs), but at the time of publishing had no direct position in any other security referenced in this article. No information accessed through the Investing Caffeine (IC) website constitutes investment, financial, legal, tax or other advice nor is to be relied on in making an investment or other decision. Please read disclosure language on IC Contact page.
Heartburn Pains After Digesting Market Gains

After gorging on +9% gains in the stock market (S&P 500 index) during July, investors suffered some heartburn pain in August (-4%). The indigestion really kicked in after Federal Reserve Chairman, Jerome Powell, gave a frank and candid outlook during his annual monetary policy speech at Jackson Hole, Wyoming. His key takeaways were that further interest rate increases are necessary to control and bring down inflation. And these economically-slowing measures, coupled with the Fed’s $95 billion in quantitative tightening policies (QT), will according to the Fed Chairman, “bring some pain to households and businesses. These are the unfortunate costs of reducing inflation. But a failure to restore price stability would mean far greater pain.”
But not everything is causing stomach pains. Yes, inflation is elevated (the rate declined to 8.5% in July from 9.1%), but there are multiple signs that overall prices are peaking. For example, gasoline prices have declined for 11 consecutive weeks to pre Russia-Ukraine invasion levels around $3.81/gallon nationally. There are also signs that housing prices, rent, used car prices, and other commodities like wheat, beef, and copper are all declining in price, as well. Even Bitcoin and other cryptocurrencies are joining in the deflation parade.
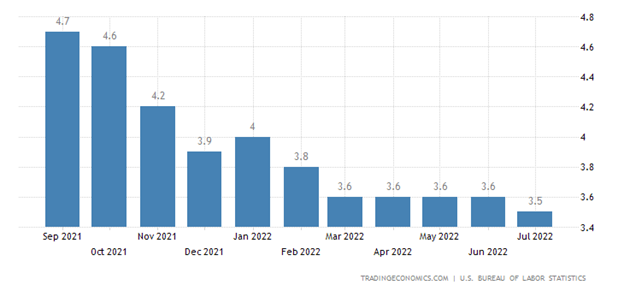
And while the Fed is doing its darnedest to bring a halt to gut-wrenching inflation, the job market remains on fire (see chart below). The unemployment rate registered in at a near a generational-low of 3.5% last month, but we will receive a fresh, new figure this week to see if this trend continues.
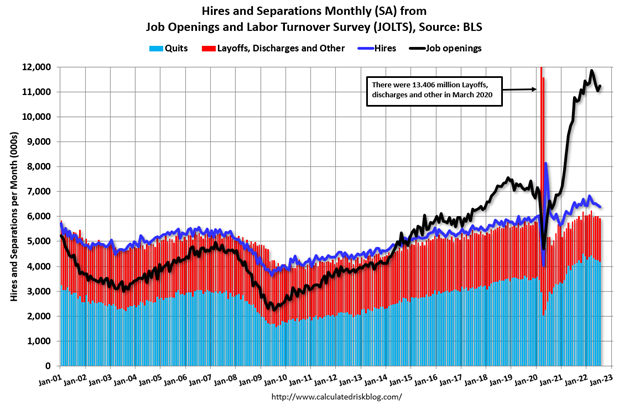
The economy’s ravenous appetite for workers can also be found in the just-released JOLTS job opening data (see chart below), which shows there are 11.2 million job openings, a total that is almost double the number of available workers (5.7 million).
Stimulus – Trillion Style
The subject of politics is not my strong suit, so perhaps only time will tell whether the net result of two large pieces of government legislation totaling more than $1 trillion (Inflation Reduction Act and Student Loan Forgiveness) will accelerate growth in the economy (Real GDP) or hasten the pace of inflation.
More specifically, the $565 billion Inflation Reduction Act is designed with the intent of investing in clean energy and healthcare initiatives, while negotiating lower pharmaceutical prices with drug companies, and raising tax revenues. The key measures planned in the legislation to fund the spending and forecasted deficit reduction are a minimum corporate tax, the termination of the carried interest tax loophole, and a doubling of the IRS (Internal Revenue Service) budget to hunt down tax dodgers.
With respect to the Student Loan Forgiveness Plan, the cost of the bill is estimated to be between $469 billion to $519 billion over a 10-year budget window, according to the University of Pennsylvania. The debt cancellation will apply to lower income individuals (earning less than $125,000 annually) with the potential of erasing debt of $10,000 – $20,000 per eligible person.
While the government passes various investing, spending, and tax-raising initiatives, corporations continue to crank out record results (see profit charts below), despite talks of an impending recession (see last month’s article, Recession or Mental Depression?).
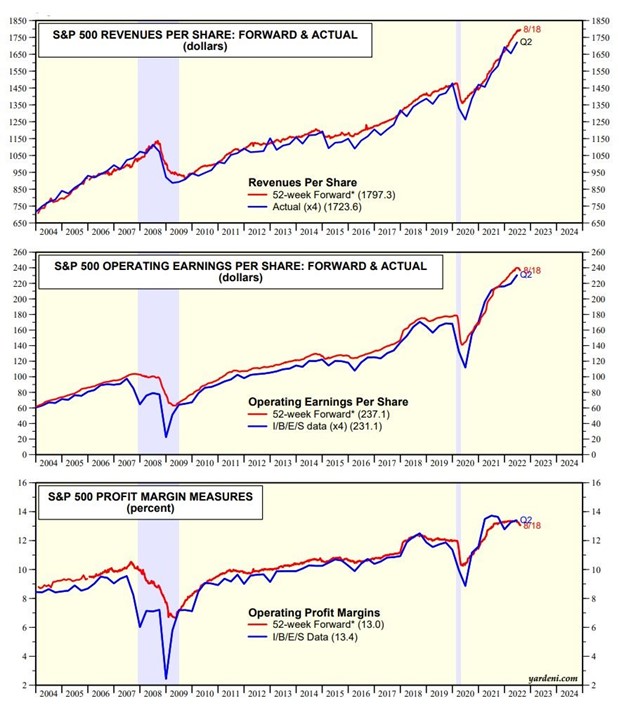
Pessimists point to the economic strength as only temporary, as they brace for the Fed’s interest rate hiking medicine to take larger effect on the patient. Optimists point to the durability of corporate profits, relatively low interest rates (3.13% yield on the 10-Year Treasury Note), positive Q3 – GDP growth estimates of +1.6%, and reasonable valuations (17x Forward Price/Earnings ratio), given the evidence of peaking and declining inflation.
In view of all the current countervailing factors, the near-term volatility will likely create a lot of stomach-churning uneasiness. However, in the coming months, if it becomes clearer the Fed is closer to the end of its rate-hiking cycle and inflation subsides, you might be gleefully enjoying your tasty gains rather than complaining of financial heartburn and headache pains.

Wade W. Slome, CFA, CFP®
Plan. Invest. Prosper.
DISCLOSURE: Sidoxia Capital Management (SCM) and some of its clients hold positions and certain exchange traded funds (ETFs), but at the time of publishing had no direct position in BRKA/B or any other security referenced in this article. No information accessed through the Investing Caffeine (IC) website constitutes investment, financial, legal, tax or other advice nor is to be relied on in making an investment or other decision. Please read disclosure language on IC Contact Page.
Bad Weather Coming: Hurricane or Drizzle?

It was a stormy month in the stock market, but the sun eventually came out and the Dow Jones Industrial Average rallied more than 2,300+ points before eking out a small gain (up +0.04%) and the S&P 500 index also posted an incremental increase (+0.005%). But there are clouds on the horizon. Although the economy is currently very strong (i.e., record corporate profits and a generationally low unemployment rate of 3.6% – see chart below), some forecasters are predicting a recession during 2023 as a result of the Federal Reserve pumping the brakes on the economy by increasing interest rates, in addition to elevated inflation, supply chain disruptions, COVID lockdowns in China, and a war between Russia and Ukraine.
UNEMPLOYMENT RATE (1997 – 2022)
But like weather forecasters, economists are perpetually unreliable. While some doomsday-er economists are expecting a deeply destructive hurricane (deep recession), others are only seeing a mild drizzle (soft landing) developing. The truth is, nobody knows for certain at this point, but what we do know is that the correction in stock prices this year (-13% now and -20% two weeks ago) has already significantly discounted (factored in) a mild recession. In other words, even if a mild recession were to occur in the coming months or quarters, there may be very little reaction or negative consequences for investors. Similarly, if inflation begins to be peaking as it appears to be doing (see chart below), and the Fed can orchestrate a soft landing (i.e., raise interest rates and reduce balance sheet debt without crippling the economy), then substantial rewards could accrue to stock market investors. On the flip side, if the economy were to go into a deep recession, history would suggest this stormy forecast might result in another -10% to -15% of chilliness.
INFLATION RATE (%)
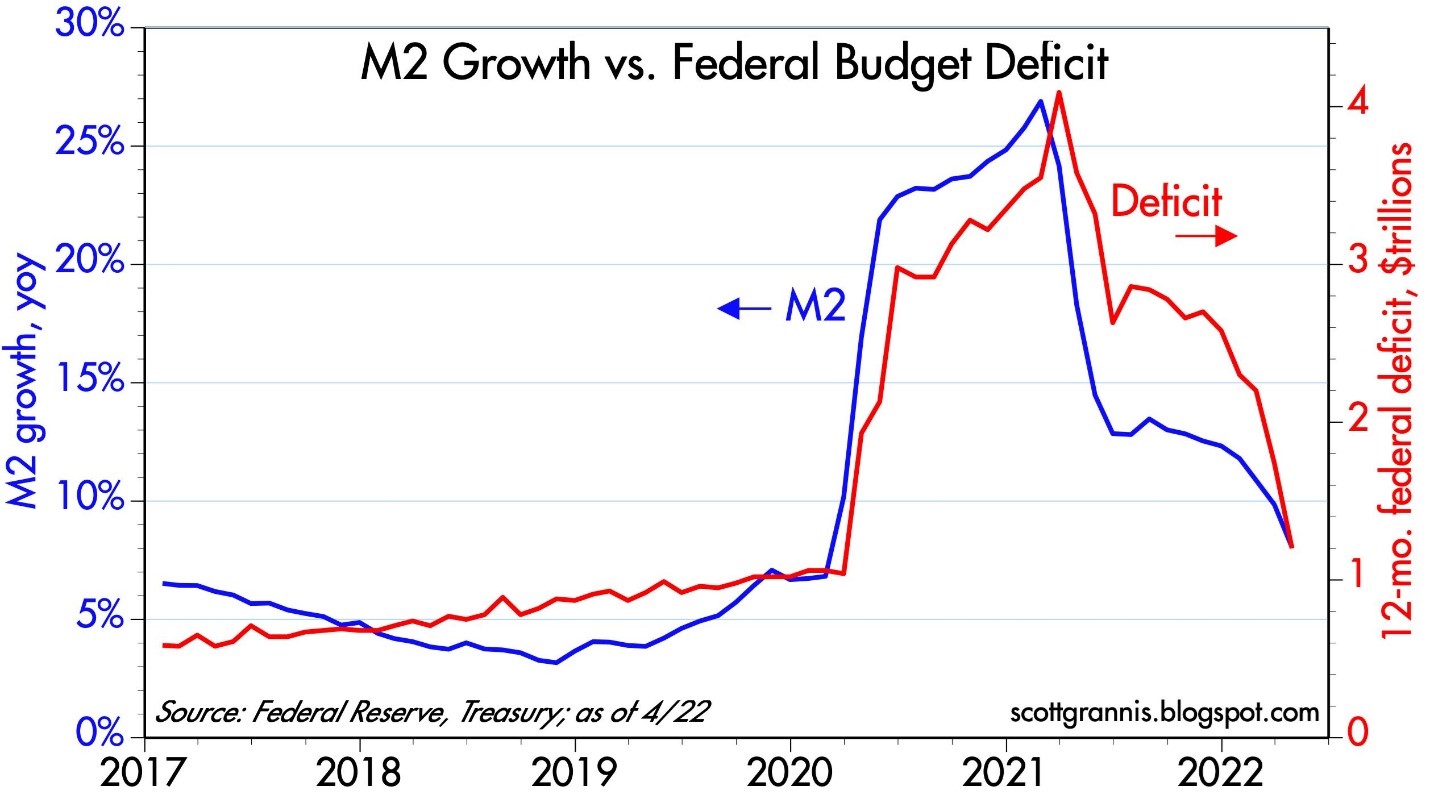
Due to trillions of dollars in increased stimulus spending and Federal Reserve Quantitative Easing (bond buying), we experienced an explosion in the government deficit and surge in money supply growth (i.e., the root cause for swelling inflation). Arguably, some or all of these accommodations were useful in surviving through the worst parts of the COVID pandemic, however, we are paying the price now in sky-high food costs, explosive gasoline prices, and expanding credit card bills. The good news is the deficit is plummeting (see chart below) due to a reduction in spending (due in part to no Build Back Better infrastructure spending legislation) and soaring income tax receipts from a strengthening economy and capital gains in the stock market.
MONEY SUPPLY GROWTH% (M2) VS. GOVERNMENT DEFICIT
For many investors, getting used to large multi-year gains has been very comfortable, but interpreting downward gyrations in the stock market can be very confusing and counterintuitive. In short, attempting to decipher the reasons behind the short-term zigs and zags of the market is a fool’s errand. Not many people predicted a +48% gain in the stock market during a global pandemic (2020-2021), just like not many people predicted a short-lived -20% reduction in the stock market during 2022 as we witnessed record-high corporate profits and unemployment rates hovering near generational lows (3.6%).
Stock market veterans understand that stock prices can go down when current economic news is sunny but future expectations are too high. Experienced investors also understand stock prices can go up when the current economic news may be getting too cloudy but future expectations are too low.
Apparently, the world’s greatest investor of all-time thinks that all this gloomy recession talk is creating lots of stock market bargains, which explains why Buffett has invested $51 billion of his cash at Berkshire Hathaway as the stock market has gotten a lot more inexpensive this year. So, while the economy will likely face a number of headwinds going into 2023, it doesn’t mean a hurricane is coming and you need to hide in a bunker. If you pull out your umbrella and rain gear, just like smart investors do during all previous challenging economic cycles, the drizzle from the storm clouds will eventually pass and blue skies shall reappear.

Wade W. Slome, CFA, CFP®
Plan. Invest. Prosper.
This article is an excerpt from a previously released Sidoxia Capital Management complimentary newsletter (June 1, 2022). Subscribe on the right side of the page for the complete text.
DISCLOSURE: Sidoxia Capital Management (SCM) and some of its clients hold positions and certain exchange traded funds (ETFs), but at the time of publishing had no direct position in BRK.B/A or any other security referenced in this article. No information accessed through the Investing Caffeine (IC) website constitutes investment, financial, legal, tax or other advice nor is to be relied on in making an investment or other decision. Please read disclosure language on IC Contact page.
New Year’s Resolutions and Vaccine Distributions

Many people were ready to flush 2020 down the toilet after the novel coronavirus (COVID-19) global pandemic dominated the daily headlines, but panic eventually turned into optimism. With last year and a new year celebration now behind us, the annual tradition of creating a New Year’s resolution to better one’s life will be a challenge for many in 2021. Why? Well, from a financial perspective, the stock market, as measured by the S&P 500 index, finished the year at another mind-boggling, all-time record high (+16% for the year), making 2020 a tough act to follow.
One area of the stock market performed exceptionally well. With millions of employees, students, and bored Americans locked down for much of the year, demand for computers, mobile phones, and internet-connected televisions swelled. Due to a flood of sales into devices, gadgets, equipment, and software, technology stocks became huge beneficiaries in 2020. The performance of this sector can be gauged by the results of the tech-heavy NASDAQ index, which skyrocketed an astounding +44%.
Countering the Confusion

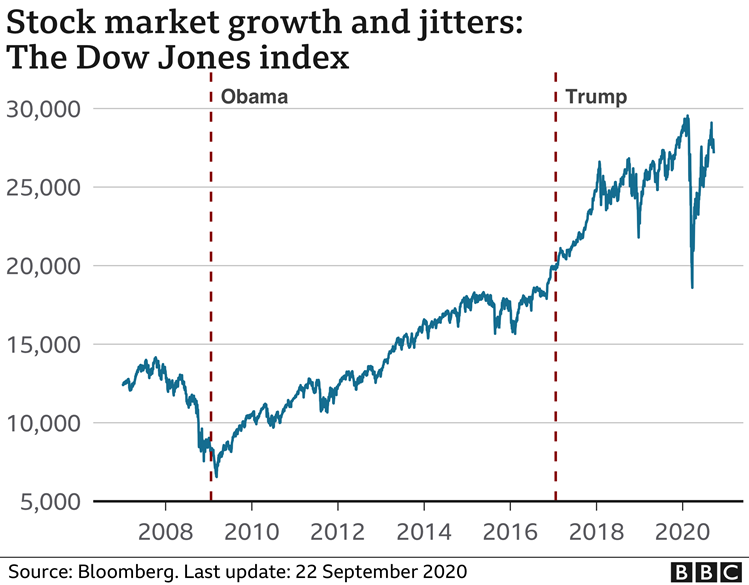
Given this unexpected surge in stock prices, many casual observers are asking how is it possible the Dow Jones Industrial Average capped off a year above the 30,000 level (best ever) after a year when 80 million people contracted COVID-19 and almost 2 million humans died from the virus?
This month, we will try to answer this confusing question. We shall explore the factors behind the unprecedented collapse early in the year and the subsequent recovery in stock prices surrounding this perplexing virus.
We’ve experienced a lot over the last year: death, destruction, an emotionally divisive presidential election, social distancing, face-coverings, Amazon deliveries, Netflix binging, DoorDash food deliveries, hand-sanitizer stocking, toilet-paper runs, and endless pants-less Zoom video sessions. After all this insanity, here are some reasons for why your and my investment accounts and 401(k) balances still managed to appreciate significantly last year:
- A COVID Cure: Although roughly only 4 million doses of the COVID-19 vaccine have been administered to date (after a 20 million goal), the government has contracted for the delivery of 400 million vaccine doses from Pfizer Inc. (PFE) and Moderna Inc. (MRNA) by summertime. With these two FDA (Food and Drug Administration) approvals alone, these doses should be enough to vaccinate all but about 60 million of the roughly 260 million adult Americans who are eligible to be inoculated. Even better, each of these cures appear to be over 90% effective. What’s more, in the not-too-distant future, additional relief is on its way in the form of further vaccine approvals by the likes of Johnson & Johnson (JNJ), Novavax Inc. (NVAX), AstraZeneca (AZN), and the Sanofi (SNY) / GlaxoSmithKline (GSK).
- Fed Firemen to the Rescue: As the COVID flames are blazing with record numbers of cases, hospitalizations, and deaths, the Federal Reserve firemen have come to an economic rescue by providing accommodative monetary policies. By effectively setting the benchmark Fed Funds Rate to 0% (see chart below), our central bank is not only stimulating loan activity for businesses, but also lowering the cost of mortgages and credit cards for consumers. In addition, the Fed has been providing support to financial markets and invigorating the economy through its asset purchases. More specifically, the Fed outlined its activities in its most recent December statement:
“The Federal Reserve will continue to increase its holdings of Treasury securities by at least $80 billion per month and of agency mortgage-backed securities by at least $40 billion per month until substantial further progress has been made toward the Committee’s maximum employment and price stability goals.“

- Economic Recovery is Well on its Way: In addition to the unmatched monetary policy stimulus from the Federal Reserve, we have also experienced an unparalleled $4 trillion in fiscal stimulus to trigger a sharp rebound in economic activity (see red line in chart below). There have been multiple rounds of PPP (Paycheck Protection Program) loans given to small businesses, millions of direct checks distributed to unemployed individuals, along with a host of other programs covering the healthcare, education, and infrastructure industries. As a result of these measures, coupled with the vaccines unleashing massive amounts of pent-up demand, pundits are forecasting above-trendline economic GDP growth in 2021 approximately 4% – 5% (e.g., Merrill Lynch +4.6%, Goldman Sachs +5.9%, and the Federal Reserve +3.7% to +5.0%).
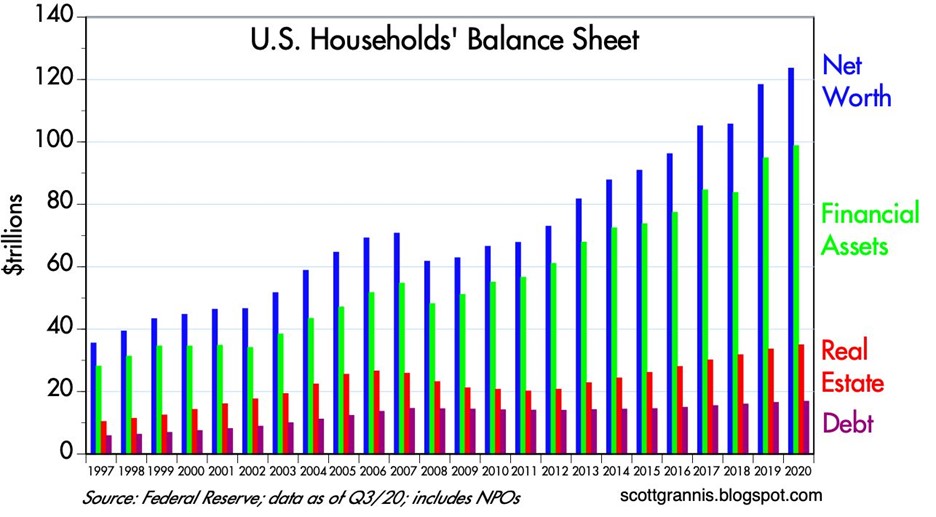
As part of the recovery, the banner year in stocks has also helped catapult consumer household balance sheets to over $120 trillion dollars, while simultaneously reducing debt (leverage) ratios (see chart below).
Flies in the Ointment
It’s worth noting that not all is well in COVID-land. Unemployment rates remain at elevated recessionary levels and industries such as travel, leisure, and restaurants persist in devastation by the pandemic. Politically, the hotly contested 2020 presidential election has largely been resolved, but a Georgia runoff vote this week for two Senate seats could swing full control of Congress to the Democrats. With the stock market at fresh new highs, a Democrat sweep in Georgia would likely be interpreted as a mandate for President-elect Biden to increase taxes for many people and businesses. Under this scenario, a temporary downdraft in the market should come as no surprise to any investor. However, any potential tax hikes on corporations and the wealthy should be accompanied with more infrastructure spending and fiscal spending, which could offset the drag of taxes to varying degrees.
Although Sidoxia Capital Management is still finding plenty of opportunities in the stock market while considering these record low interest rates (yield on 10-year Treasury Note of only 0.92%), areas of vulnerability still exist in recent high-flying, money-losing IPOs (Initial Public Offerings) such as Snowflake Inc. (SNOW), Airbnb Inc (ABNB), and DoorDash Inc (DASH).
Other cautionary areas of excess speculation include the hundreds of SPAC (Special Purpose Acquisition Company) deals totaling more than $70 billion in 2020, and the reemergence of Bitcoin froth (up greater than +300% this year). The recent rush into Bitcoin has been fierce, but industry veterans with memory greater than a gnat recall that Bitcoin plummeted more than -80% from its peak to trough in 2018. Suffice it to say, Bitcoin is not for the faint of heart and buyers should beware.While there was a lot of pain and suffering experienced by millions due to the COVID-19 global pandemic, there was a lot to be thankful for as well, including vaccines to cure the global pandemic. Even though we had another record year at Sidoxia Capital Management, there is always room for improvement. At Sidoxia our New Year’s resolution is always the same: Provide superior investment management and financial planning services, as we build sustaining, long-term relationships with our clients.

Wade W. Slome, CFA, CFP®
Plan. Invest. Prosper.
This article is an excerpt from a previously released Sidoxia Capital Management complimentary newsletter (January 4, 2021). Subscribe on the right side of the page for the complete text.
DISCLOSURE: Sidoxia Capital Management (SCM) and some of its clients hold positions in AMZN, NFLX, MRNA, ZM, PFE, NVAX, and certain exchange traded funds (ETFs), but at the time of publishing had no direct position in DASH, JNJ, AZN, SNY, GSK, SNOW, ABNB, or any other security referenced in this article. No information accessed through the Investing Caffeine (IC) website constitutes investment, financial, legal, tax or other advice nor is to be relied on in making an investment or other decision. Please read disclosure language on IC Contact page.
GDP Figures & Election Jitters

Ever since the beginning of 2020, it’s been a tale of two cities. As renowned author Charles Dickens famously stated, “It was the best of times and worst of times.” The year started with unemployment at a “best of times” low level of 3.5% (see chart below) before coronavirus shutdown the economy during March when we transitioned to the “worst of times.”
 |
With the recent release of record-high Gross Domestic Product (GDP) figures of +33.1% growth in Q3 (vs. -31.4% in Q2), and a +49% stock market rebound from the COVID-19 lows of March, a debate has been raging. Is the re-opening economic rebound that has occurred a V-shaped recovery that will continue expanding, or is the recovery that has occurred since March a temporary dead-cat bounce?
 |
For many people, the ultimate answer depends on the outcome of the impending presidential election. Making matters worse are the polarized politics that are being warped, distorted, and amplified by social media (see Social Dilemma). Although the election jitters have many stock market participants on pins and needles, history reminds us that politics have little to do with the long-term direction of the stock market and financial markets. As the chart below shows, over the last century, stock prices have consistently gone up through both Democratic (BLUE) and Republican (RED) administrations.
 |
Even if you have trouble digesting the chart above, I repeatedly remind investors that political influence and control are always temporary and constantly changing. There are various scenarios predicted for the outcome of the current 2020 elections, including a potential “Blue Wave” sweep of the Executive Branch (the president) and the Legislative Branch (the House of Representatives and Senate). Regardless of whether there is a Blue Wave, Red Wave, or gridlocked Congress, it’s worth noting that the previous two waves were fleeting. Unified control of government by President Obama (2008-2010) and President Trump (2016-2018) only lasted two years before the Democrats and Republicans each lost 100% control of Congress (the House of Representatives flipped to Republican in 2010 and Democrat in 2018).
Even though Halloween is behind us, many people are still spooked by the potential outcome of the elections (or lack thereof), depending on how narrow or wide the results turn out. Despite the +49% appreciation in stock prices, stock investors still experienced the heebie-jeebies last month. The S&P 500 index declined -2.8% for the month, while the Dow Jones Industrial Average and Nasdaq Composite index fell -4.6% and -2.3%, respectively. It is most likely true that a close election could delay an official concession, but with centuries of elections under our belt, I’m confident we’ll eventually obtain a peaceful continuation or transition of leadership.
Regardless of whomever wins the presidential election, roughly half the voters are going to be unhappy with the results. For example, even when President Ronald Reagan won in a landslide victory in 1980 (Reagan won 489 electoral votes vs. 49 for incumbent challenger President Jimmy Carter), Reagan only won 50.8% of the popular vote. In other words, even in a landslide victory, roughly 49% of voters were unhappy with the outcome. No matter the end result of the approaching 2020 election, suffice it to say, about half of the voting population will be displeased.
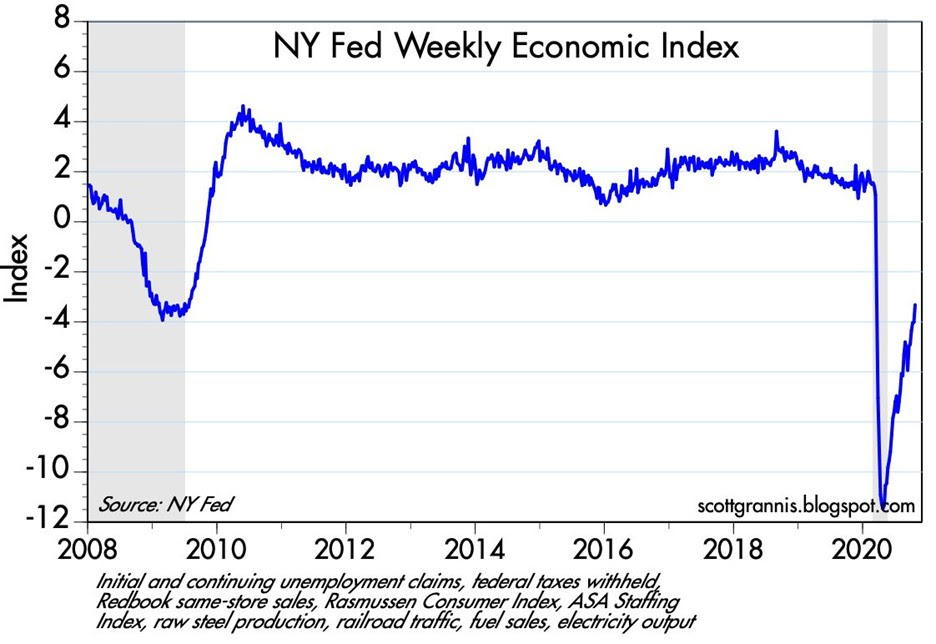
Despite the likely discontent, the upcoming winner will be working with (or inheriting) an economy firmly in recovery mode, whether you are referencing, jobs, automobile sales, home sales, travel, transportation traffic, consumer spending, or other statistics. The Weekly Economic Index from the New York Federal Reserve epitomizes the strength of the V-shaped recovery underway (see chart below).
It will come as no surprise to me if we continue to experience some volatility in financial markets shortly before and after the elections. However, history shows us that these election jitters will eventually fade, and the tale of two cities will become a tale of one city focused on the fundamentals of the current economic recovery.

Wade W. Slome, CFA, CFP®
Plan. Invest. Prosper.
This article is an excerpt from a previously released Sidoxia Capital Management complimentary newsletter (November 2, 2020). Subscribe on the right side of the page for the complete text.
DISCLOSURE: Sidoxia Capital Management (SCM) and some of its clients hold positions in certain exchange traded funds (ETFS), but at the time of publishing had no direct position in any other security referenced in this article. No information accessed through the Investing Caffeine (IC) website constitutes investment, financial, legal, tax or other advice nor is to be relied on in making an investment or other decision. Please read disclosure language on IC Contact page.
Politics & COVID Tricks

Thanks to a global epidemic, trillions of dollars instantly disappeared during the first quarter of this year, and then, abracadabra…the losses turned into gains and magically reappeared in the subsequent two quarters. After a stabilization in the spread of the COVID-19 virus earlier this year, the stock market rebounded for five consecutive months, at one point rebounding +64% (from late March to early September) – see chart below. However, things became a little bit trickier for the recent full month as concerns heightened over the outcome of upcoming elections; uncertainty over a potential coronavirus-related stimulus package agreement; and fears over a fall resurgence in COVID-19 cases. Although the S&P 500 stock index fell -3.9% and the Dow Jones Industrial Average slipped -2.3% during September, the same indexes levitated +8.5% and +7.6% for the third quarter, respectively.
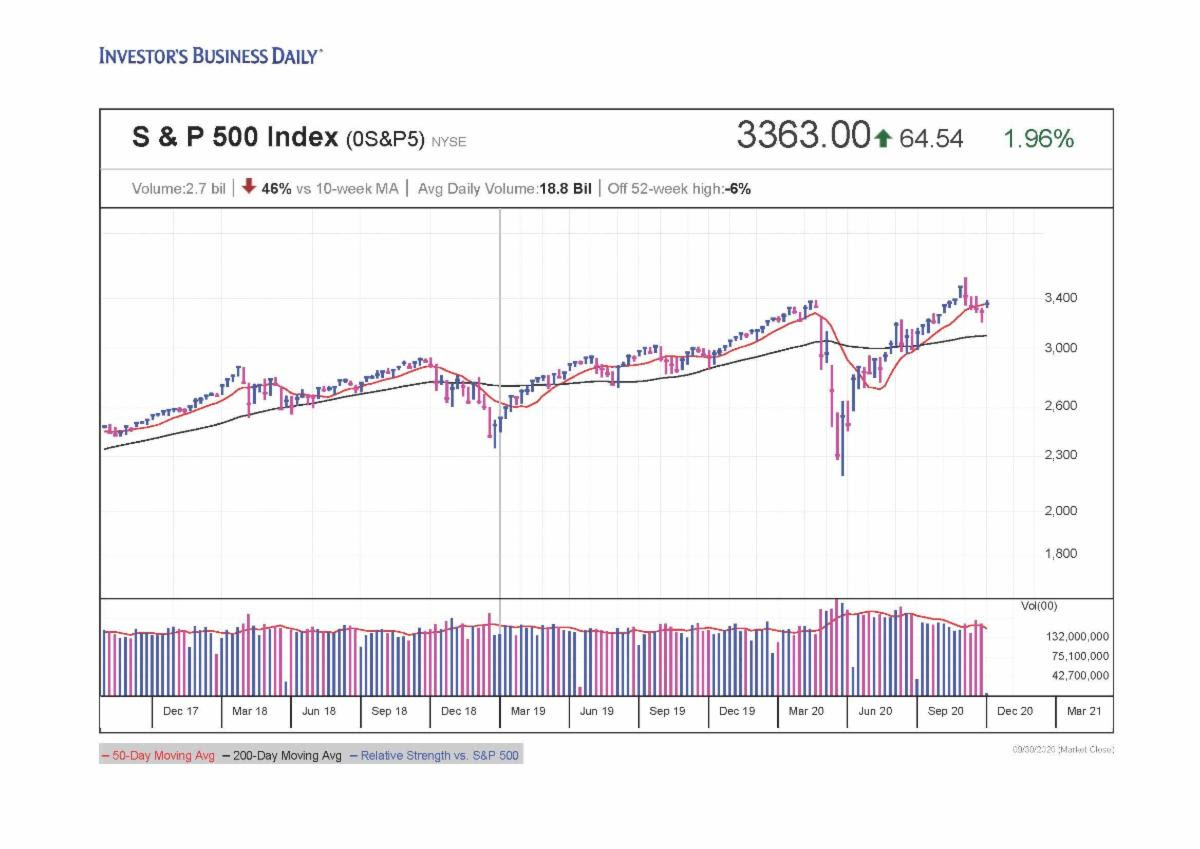
Source: Investors.com
Washington Worries
Anxiety over politics is nothing new, and as I’ve written extensively in my Investing Caffeine blog, history teaches us that politics have little to do with the long-term performance of the overall stock market (e.g., see Politics & Your Money). Nobody knows with certainty how the elections will impact the financial markets and economy (myself included). But what I do know is that many so-called experts said the stock market would decline if Barack Obama won the presidential election…in reality the stock market soared. I also know the so-called experts said the stock market would decline if Donald Trump won the presidential election… in reality the stock market soared. So, suffice it to say, I don’t place a lot of faith into what any of the so-called political experts say about the outcome of upcoming elections (see the chart below).
COVID Coming Back?
One of the reasons stock prices have risen more than 50%+ is due to a stabilization in COVID-19 virus trends. As you can see from the charts below, new tests, hospitalizations, and death rates are generally on good trajectories, according to the COVID Tracking Project. However, new COVID cases have bumped higher in recent weeks. This recent, troubling trend has raised the question of whether another wave of cases is building in front of a dangerous, seasonally-cooler fall flu season. Traditionally, it’s during this fall period in which contagious viruses normally spread faster.
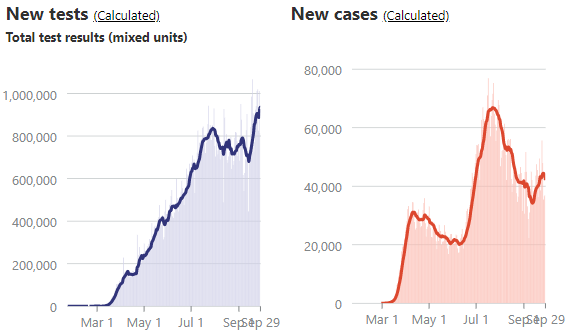
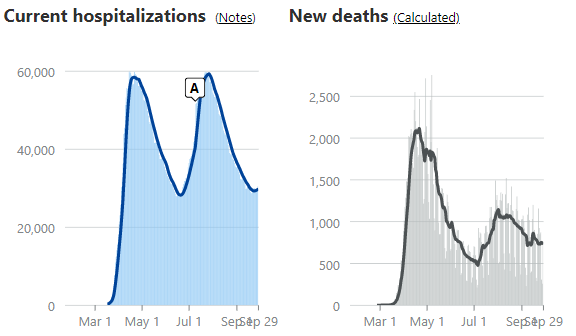
Source: The COVID Tracking Project
Regardless of the trendline in new cases, there is plenty of other promising COVID developments to help fight this pandemic, such as the pending approvals of numerous vaccines, along with improved therapies and treatments, such as therapeutics, steroids, blood thinners, ventilators, and monoclonal antibodies.
Business Bounce
From the 10,000-foot level, despite worries over various political outcomes, the economy is recovering relatively vigorously. As you can see from the chart below, the rebound in employment has been fairly swift. After peaking in April at 14.7%, the most recent unemployment rate has declined to 8.4%, and a closely tracked ADP National Employment Report was released yesterday showing a higher than expected increase in new private-sector monthly jobs (749,000 vs. 649,000 median estimate).
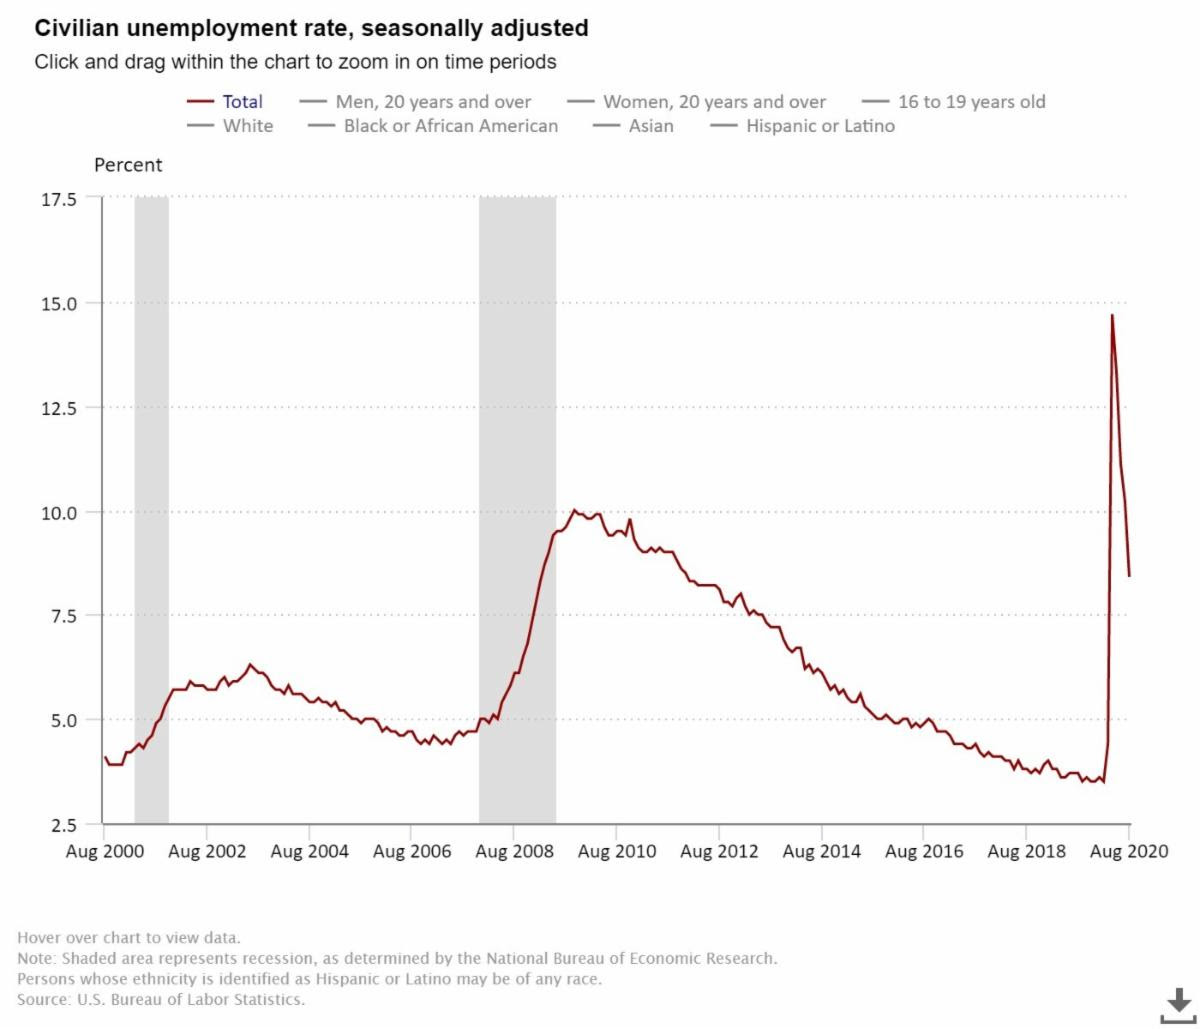
Source: U.S. Bureau of Labor Statistics
From a housing perspective, house sales have been on fire. Record-low interest rates, mortgage rates, and refinancing rates have been driving higher home purchases and rising prices. Urban flight to the suburbs has also been a big housing tailwind due to the desire for more socially distanced room, additional home office space, and expansive backyards. Adding fuel to the housing fire has been record low supply (i.e., home inventories). The robust demand is evident by the record Case-Shiller home prices (see chart below).
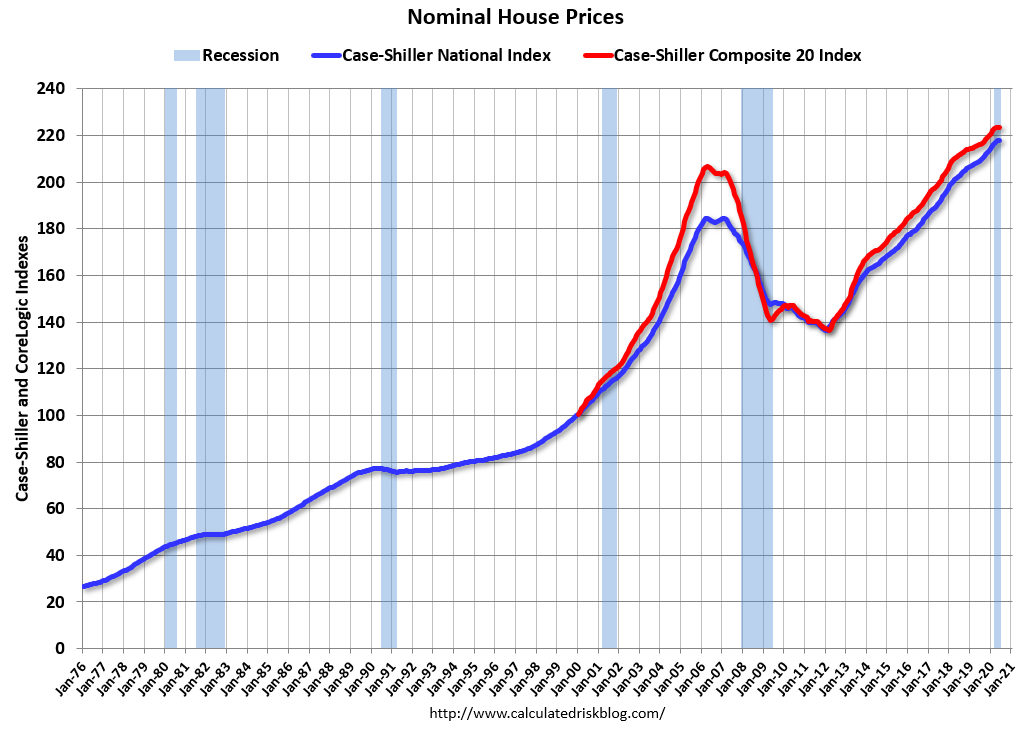
Source: Calculated Risk
There are plenty of industries hurting, including airlines, cruise lines, hotels, retailers, and restaurants but the economic rebound along with government stimulus (i.e., direct government checks and unemployment relief payments) have led to record retail sales (see chart below). Spending could cool if an additional coronavirus-related stimulus package agreement is not reached, but until the government checks stop flowing, consumers will keep spending.
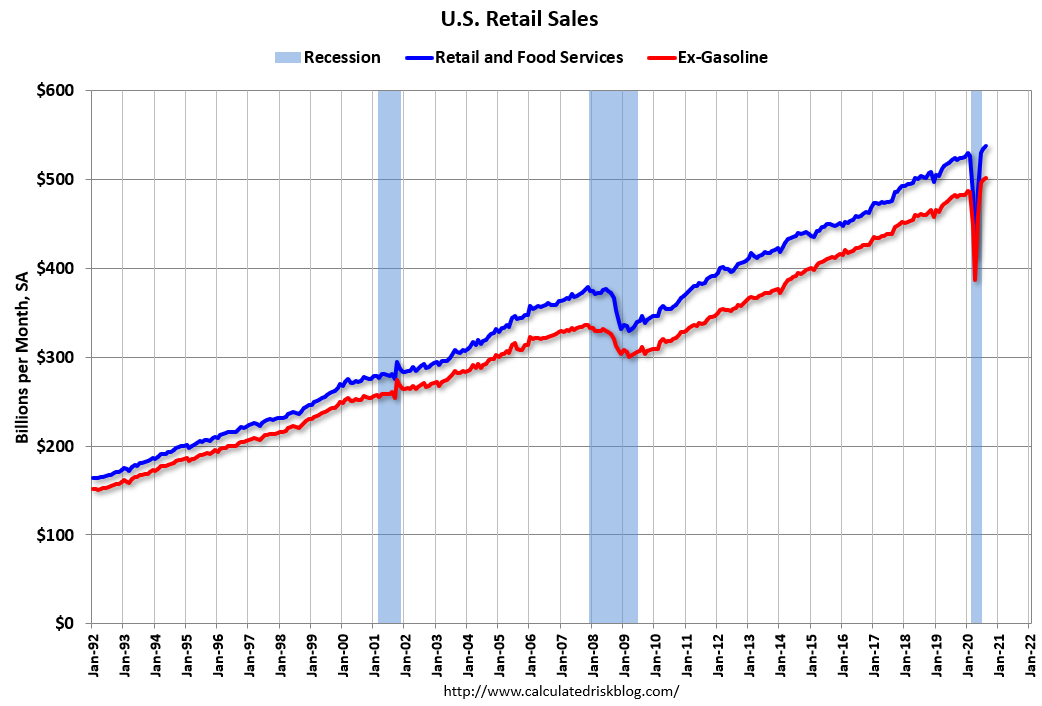
Source: Calculated Risk
Besides trillions of dollars in fiscal relief injected into the economy, the Federal Reserve has also provided trillions in unprecedented relief (see chart below) through its government and corporate bond buying programs, in addition to its Main Street Lending Program.
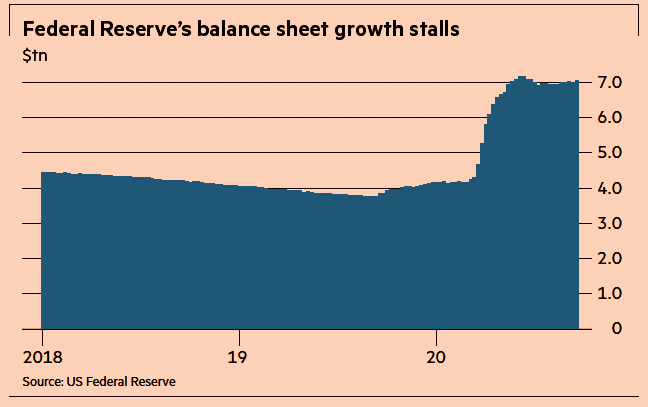
Source:The Financial Times
There has been a lot of political hocus pocus and COVID smoke & mirrors that have much of the population worried about their investments. In every presidential election, you have about half the population satisfied with the winner, and half the population disappointed in the winner…this election will be no different. The illusion of fear and chaos is bound to create some short-term financial market volatility over the next month, but behind the curtains there are numerous positive, contributing factors that are powering the economy and stock market forward. Do yourself a favor by focusing on your long-term financial future and don’t succumb to politics and COVID tricks.
Wade W. Slome, CFA, CFP®
Plan. Invest. Prosper.
This article is an excerpt from a previously released Sidoxia Capital Management complimentary newsletter (October 1, 2020). Subscribe on the right side of the page for the complete text.
DISCLOSURE: Sidoxia Capital Management (SCM) and some of its clients hold positions in certain exchange traded funds (ETFS), but at the time of publishing had no direct position in any other security referenced in this article. No information accessed through the Investing Caffeine (IC) website constitutes investment, financial, legal, tax or other advice nor is to be relied on in making an investment or other decision. Please read disclosure language on IC Contact page.
The COVID Comeback

Rocky Balboa (“The Italian Stallion”) the underdog boxer from the movie, Rocky, was down and out until he was given the opportunity to fight World Heavyweight Champion, Apollo Creed. Like the stock market during early 2020, Rocky was up against the ropes and got knocked down, but eventually he picked himself up and rebounded to victory in his rematch with Creed.
The stock market comeback also persisted last month as the COVID-19 pandemic health situation continued to stabilize and the broader economy accelerated business re-openings. For the month, the Dow Jones Industrial Average increased +4.3% (+1,037 points to 25,383), while the S&P 500 index bounced+5.3%, and the NASDAQ catapulted the most by +6.8%.
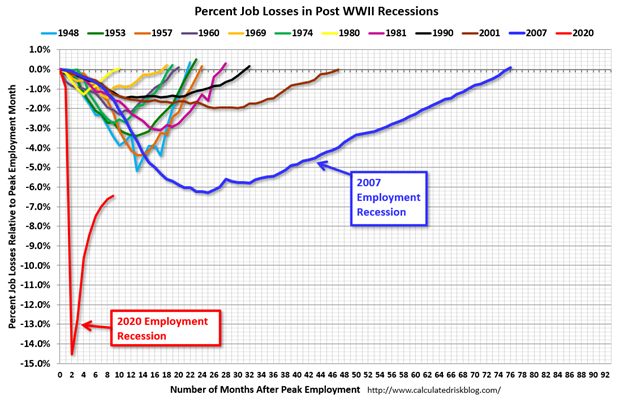
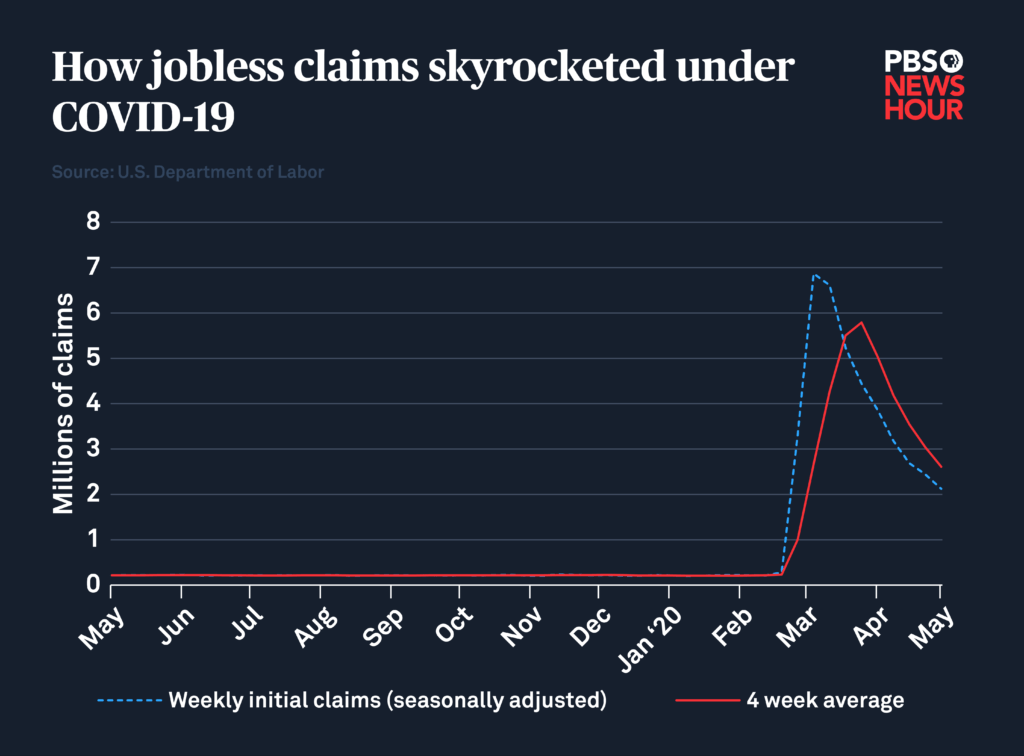
How can the stock market (i.e., the Dow) rebound +39%, or more than 7,100 points, from the March 2020 lows? The large move is even more surprising once you consider 41 million people have lost their jobs since the epidemic hit American soil (see chart below), and COVID-19 related deaths have climbed to over 100,000 people.
Getting Back to Fighting Shape
By the time we reached Rocky VI, Rocky Balboa was retired and recovered from brain damage. But Rocky is no quitter, and he trained himself into championship fighting condition and got back into the boxing ring. With unemployment rates approaching Great Depression levels, the U.S. economy has been experiencing challenging circumstances as well – a self-induced coma (shutdown). Fortunately, our country has been slowly recovering day-by-day, and week-by-week. The economy may not be back to peak fighting shape, but activity is slowly and consistently getting better.
There are many different perspectives in looking at this extremely complex, unprecedented coronavirus pandemic. The speed and pace of selling stocks during February and March reached radically-high panic levels, as measured by objective indicators like the Volatility Index (i.e., the VIX – or Fear Gauge). However, like a coiled spring, the stock market sprung back up during April and May as stay-at-home orders and quarantine measures around the world significantly bent the curve of COVID-19 infections and deaths (see chart below). As you can see, with the exception of a few countries globally (e.g., Brazil and Russia), the number of daily confirmed deaths has been broadly declining for many weeks.
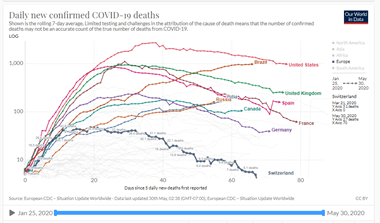
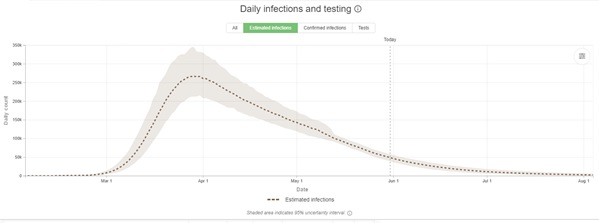
Estimated infections have been coming down as well, according to the Institute for Health Metrics and Evaluation (IMHE). IMHE estimates also show the number of daily infections has consistently been coming down over the last couple months.
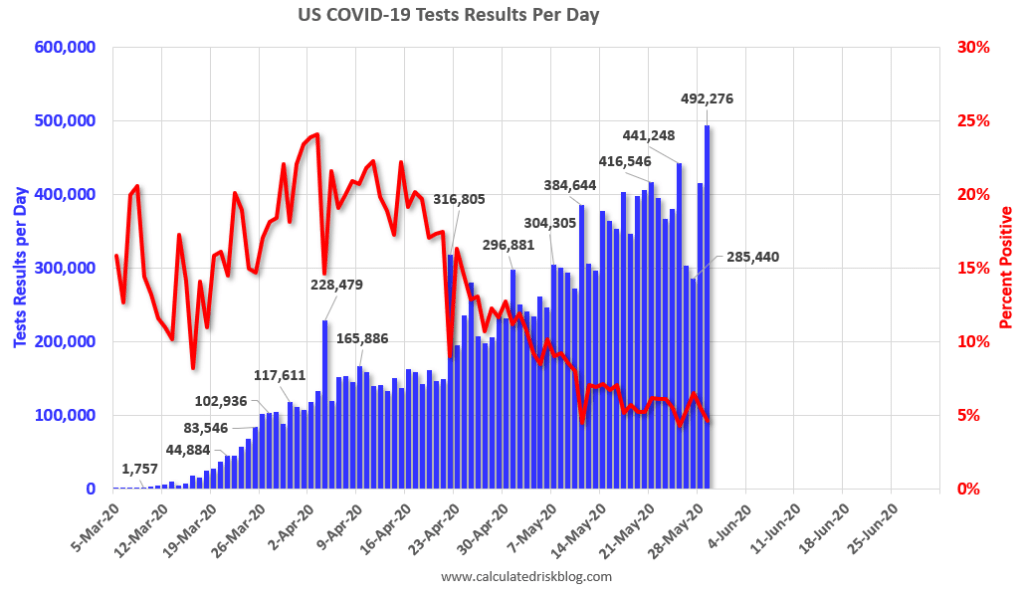
In addition to the stay-at-home orders and social distancing protocols, what has also contributed to the declines in COVID-19 deaths and infections? Two words…”increased testing.” Although, arguably COVID-19 testing got off to a rough start, as seen in the chart below, nevertheless daily tests have risen dramatically over the last couple months from about 100,000 per day to roughly 500,000 per day (see chart below). Increased testing capacity has and will continue to help better control the spread (or lack thereof) of the virus.
Not only has the spread of the coronavirus been substantially mitigated, but the fighting economy has also received an adrenaline shot in the form of trillions of dollars of fiscal and monetary support as I described in my previous article ( see also Recovering from the Coma).
Investors Need to Keep Guard Up
Like Rocky Balboa, the U.S. is a strong, respected fighter but even though strength is being regained, the economy and stock market is susceptible to a surprise upper-cut punch or hook. What could potentially hurt the financial comeback?
- Flare Ups & Second Wave: As cities, counties, and states carry on with expanded business openings, we could experience “flare ups” of COVID-19 infections or a “second wave.” But the good news is, we should be in much better shape to handle these scenarios thanks to expanded stockpiles of ventilators; larger supplies of PPE (Personal Protective Equipment) for frontline workers; increased production of therapeutic drugs like remdesivir from Gilead Sciences Inc. (GILD); and improved contact tracing from the magnified number of tests. And this analysis doesn’t even contemplate the more than 100 vaccines being developed (i.e., a potential cure) for COVID-19, which could be available in limited quantities as early as the end of this year.
- Social Unrest: The death of George Floyd, an African-American man who died after a Minneapolis police officer forcefully restrained George by keeping his knee on his neck, which triggered lethal complications to the victim. As a result, nationwide racial injustice protests and disruptive violence have erupted, thereby forcing government intervention with the hope of limiting violence and damage caused by non-peaceful protesters.
- Strained Relations with China Due to Actions in Hong Kong: Recent political actions mandated by the Chinese government to strip autonomy from Hong Kong has strained relations with the United States, and progress made with the previous U.S. – China trade deal could erode.
- Inflation: Despite no near-term evidence of rising prices, the unparalleled increase of trillions of dollars in fiscal debt and deficits has the credible long-term potential of creating incendiary inflation that could burn through consumers’ buying power.
Rocky Balboa faced many formidable foes in the boxing ring, including Clubber Lang (Mr. T) and Russian Ivan Drago, but Rocky survived and persevered. The stock market is bound to face future punches from unforeseen challengers in the form of impending known and unknown threats, but the alarmist calls for a COVID knockout appear to be overstated.
Wade W. Slome, CFA, CFP®
Plan. Invest. Prosper.
This article is an excerpt from a previously released Sidoxia Capital Management complimentary newsletter (June 1, 2020). Subscribe on the right side of the page for the complete text.
DISCLOSURE: Sidoxia Capital Management (SCM) and some of its clients hold positions in GILD and certain exchange traded funds (ETFS), but at the time of publishing had no direct position in any other security referenced in this article. No information accessed through the Investing Caffeine (IC) website constitutes investment, financial, legal, tax or other advice nor is to be relied on in making an investment or other decision. Please read disclosure language on IC Contact page.


