Posts tagged ‘technology’
AI: Will the World Go Dead or Markets Continue to Surge Ahead?

The internet caught fire last month when 27-year-old Jacob Coxon resigned from AI juggernaut Anthropic over safety concerns. After working in pretraining model development for just four months, Coxon quit and launched a national media tour warning of AI doomsday. But he’s not a solo alarmist: his boss, Anthropic CEO Dario Amodei, has also raised flags about AI safety. To compound matters, Coxon’s former alignment science lead colleague, 28-year-old Evan Hubinger, echoed those fears, publicly stating there is a greater than 10% chance that artificial intelligence could annihilate humanity within the decade.
It’s a chilling thought. Ask a friend, neighbor, coworker, or family member how they feel about data centers, job displacement, energy prices, or existential risk, and you’re bound to get an anxious response. This sentiment has entered the national zeitgeist as evidenced by the Saturday Night Live skit satirizing CEO Amodei last weekend, which can be watched by clicking here.
Yet, while AI dominates the headlines, other macroeconomic variables continue to shape the financial markets, including higher oil prices, shifting Federal Reserve policy, Middle Eastern geopolitical anxiety, and midterm election uncertainty. Investors, however, took a measured view of the noise. Here is how the major indices wrapped up last month:
NASDAQ: +1.9% (up +15.6% for the year)
S&P 500: -0.5% (up +11.8% for the year)
Dow Jones Industrial Average: -4.3% (up +5.9% for the year)
Alarmists and Doomsdayers Come Out in Force
Halloween is still weeks away, but that hasn’t stopped the doomsday prognosticators from trying to spook investors. Having invested for over 35 years, I’ve seen this movie before. Armageddon makes for great Hollywood scripts, but fortunately, it rarely translates to reality.
Nevertheless, a groundswell of fear has been created suggesting AI will trigger a cascade of catastrophes, including:
- Stealing everyone’s job
- Providing bad actors with nuclear weapon recipes
- Sparking massive cyberattacks and critical infrastructure collapses
- Fueling a potential geopolitical war via distributing misinformation
- Spawning AI-engineered pandemics or biological weapons
- Overwhelming the environment, draining resources, and skyrocketing electricity prices due to data center proliferation electricity prices due to data center proliferation
This isn’t the first time a technological leap has been forecasted to end in ruin. Remember the dreaded Y2K panic in 2000? Electrical grids were supposed to crash, ATMs and banks were predicted to go dark, air travel would grind to a halt, and hospital equipment failure would cause mass casualties. What actually happened? A big nothing burger. Life proceeded virtually unscathed.
An End-of-the-World History Lesson
Students of history understand that predictions for human death and extinction are nothing new. Here are a few examples:
 Nostradamus (1555): The renowned French astrologer made 942 predictions in Les Propheties, culminating in a famous, utterly failed prognostication of a world-collapsing catastrophe in 1999.
 Thomas Mathus (1798): The economist predicted that population growth would inevitably outpace food production, triggering permanent, widespread famine and societal collapse. Technology and the Green Revolution ended up proving him wrong.
 William Miller (1844): A 19th-century preacher-influencer with over 100,000 followers, Miller predicted Jesus Christ would return to earth to engulf the world in fire. When his initial date of March 21, 1844 failed and passed, he simply rescheduled it to October 22, 1844, which failed again.
 Paul Ehrlich (1968): In The Population Bomb, Ehrlich incorrectly forecasted that hundreds of millions would starve to death globally throughout the 1970s and 1980s.
 George Wald (1970): In late 1970, a Harvard Nobel laureate declared to a crowd at the University of Rhode Island that civilization would end within 15 to 30 years. Breaking news: we are still here.
 Al Gore (2008): The former Vice President stated on multiple occasions that polar ice caps could completely melt away within five years. That didn’t happen.
 Harold Camping (2011): The doomsday radio preacher predicted the end of the world would occur on May 21, 2011. When that failed, he pushed it to October. He passed away two years later at age 92.
 Jacob Coxon – Anthropic (2026): TBD.
From AI Boomsday to AI Doomsday
While some sit on the precipice of imaginary extinction, reality dictates that the rollout of artificial intelligence is powering an unprecedented industrial and economic revolution. The companies aggressively investing in and embracing AI are reaping the rewards – a point I emphasized in my previous article, The AI Genie is Out of the Bottle.
It’s no surprise that the Magnificent 7 (Apple, Amazon, Alphabet-Google, Meta-Facebook, Microsoft, Netflix, and Tesla) – the primary architects pouring hundreds of billions into AI infrastructure – are leading the charge. More specifically, the Magnificent 7 index (MAGS) was up +4.3% last month and +50.9% over the past two years. Is it a coincidence that both the stock market’s Forward Earnings (blue line) and the stock market index (red line) both inflected sharply upward (see below) following OpenAI’s release of ChatGPT bot in November, 2022? I think not.
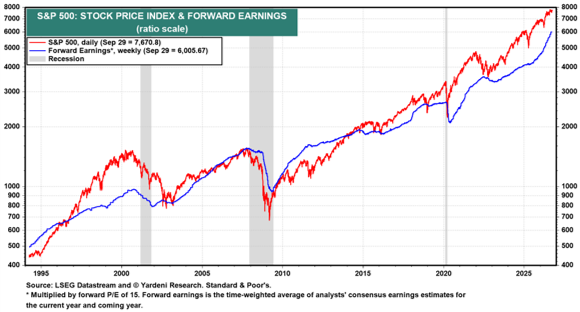
Source: Yardeni.com
The AI Facts on the Ground While the mainstream media fixates on worst-case theoretical risks, look at the undeniable data driving the sector forward. Altimeter CEO, Brad Gerstner, shared compelling AI charts in a recent presentation:
- Unprecedented Revenue Growth: Investors are witnessing the fastest revenue scaling of multiple companies in human history. It took Meta and Google over 15 years to reach $100 billion in revenue; Anthropic and OpenAI are projected to cross that milestone in roughly five years – a decade faster than their predecessors (see chart below).
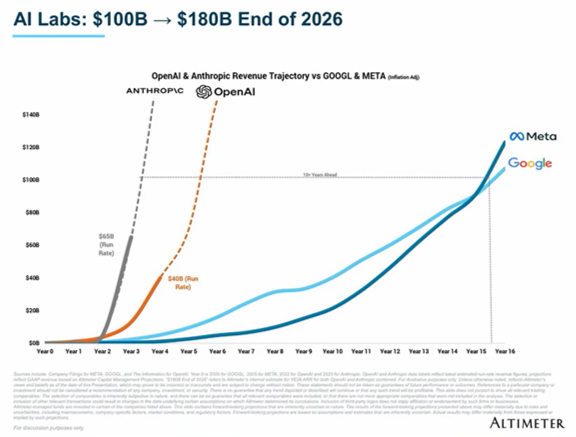
Source: Altimeter (Brad Gerstner)
- Robust Enterprise CAPEX: Frontier model labs (OpenAI, Anthropic, SpaceXAI) are channeling customer revenues directly into purchasing or leasing “compute” (processing power, memory, and hardware infrastructure) from hyperscalers (Amazon, Microsoft, Google). Industry forecasts project AI Lab Annual Recurring Revenue (ARR) to reach $1.5 trillion, easily supporting the projected $1 trillion+ in annual CAPEX (Capital Expenditures) through 2029 (see chart below). Reaching $1 trillion in CAPEX is a reasonable projection if you consider worldwide information technology spending is expected to reach $6.4 trillion this year.
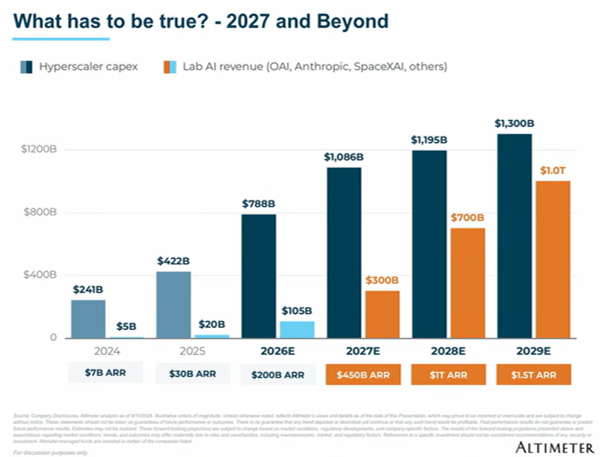
Source: Altimeter (Brad Gerstner)
- Exploding Usage: We are still in the first inning of AI adoption, yet usage is skyrocketing as workflows shift from basic chat queries to inference processing and autonomous AI agents. Measured by data unit tokens processed, activity has scaled 1,000,000,000 (one billion-fold) since 2023 (see table below), driving the insatiable need for next-generation data centers.
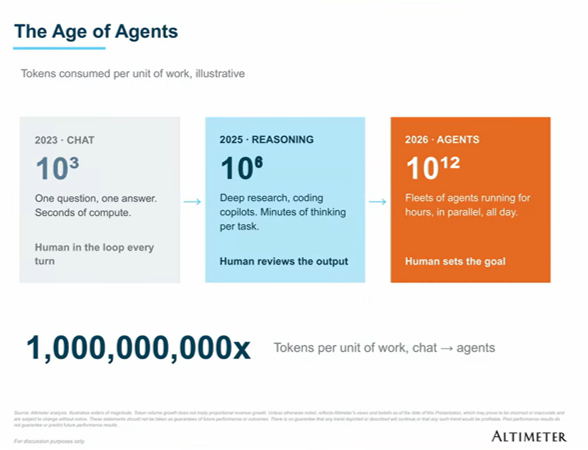
Source: Altimeter (Brad Gerstner)
Guardrails and Regulation Can Mitigate Risks
While AI adoption surges, business and government are actively collaborating to implement sensible guardrails. Acknowledging legitimate concerns, tech titans and political leaders recently met at a White House AI Summit* to sign safety pacts and discuss regulatory frameworks. Furthermore, existing liability laws can and should hold companies accountable if they negligently release harmful products – just as automakers like Tesla should be held accountable if harmful autonomous vehicle are released. The high-profile anxiety surrounding AI is ultimately a net positive: it has forced tech CEOs to prioritize safety and placed Washington on high alert.
While alarmists continue to capture headlines with tales of extinction dread, financial markets and real-world innovation will continue to surge ahead.
*AI White House Summit attendees included Anthropic CEO Dario Amodei, SpaceX and Tesla CEO Elon Musk, Nvidia CEO Jensen Huang, Meta CEO Mark Zuckerberg, Amazon founder Jeff Bezos, Alphabet CEO Sundar Pichai, Microsoft CEO Satya Nadella, Advanced Micro Devices CEO Lisa Su, Palantir CEO Alex Karp and OpenAI President Greg Brockman.
Wade W. Slome, CFA, CFP®
Plan. Invest. Prosper.
This article is an excerpt from a previously released Sidoxia Capital Management complimentary newsletter (October 1, 2026). Subscribe Here to view all monthly articles.
Sidoxia Capital Management (SCM) and some of its clients hold positions in AAPL, AMZN, GOOGL, META, MSFT, TSLA, NVDA, and certain exchange traded funds (ETFs), but at the time of publishing had no direct position NFLX, AMD, PLTR, or in any other security referenced in this article.
DISCLOSURE: No information accessed through the Investing Caffeine (IC) website constitutes investment, financial, legal, tax or other advice nor is to be relied on in making an investment or other decision. Each investor’s situation is unique so please work with a professional financial adviser, tax accountant or legal representative, as applicable, to develop an individualized plan or address any questions you may have. Investing involves risk including the possibility of loss of one’s investment.
Big Debt and Massive AI Bet Not Yet a Threat

Government debt levels have reached stratospheric heights, and hundreds of billions in corporate borrowing are piling up to finance a gargantuan AI data center infrastructure buildout.
How have stock and bond investors responded to this unprecedented debt binge?
With a collective shrug.
For the month, the major stock indexes continued their march higher:
· S&P 500: +2.6%
· NASDAQ: +3.9%
· Dow Jones Industrial Average: +1.3%
Meanwhile, the bond market largely shrugged off hawkish rhetoric surrounding potential interest rate hikes from Federal Reserve Chairman Kevin Warsh following his speech at the closely watched Jackson Hole annual symposium.
More specifically, fixed-income performance held steady:
· U.S. Aggregate Bond (AGG): +0.0%
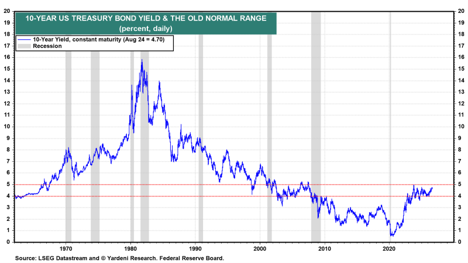
· 10-Year Treasury Note Yield: +0.3%(4.76%) Although interest rates have risen significantly from their post-pandemic lows, yields remain near historically manageable levels (see chart below) – especially when framed against the backdrop of robust corporate profit growth and broader economic resilience.
Source: Ed Yardeni
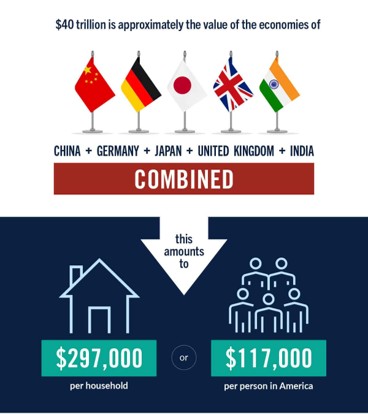
$40 Trillion Mountain of Debt As highlighted by the Peter G. Peterson Foundation, gross U.S. federal debt has officially breached the $40 trillion mark. To put that figure into perspective, here are a few insightful graphics (below).
Source: Peter G. Peterson Foundation
$40 trillion roughly equals the combined gross domestic product (GDP) of China, Germany, Japan, the UK, and India. It also translates to approximately $297,000 per U.S. household or $117,000 per person.
Source: Peter G. Peterson Foundation
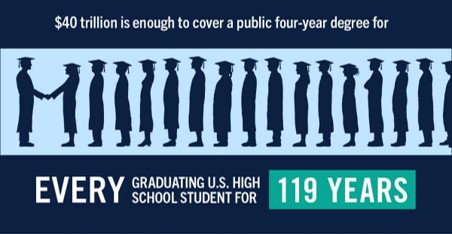
Expressed another way, $40 trillion could cover four-year college tuition for every graduating high school senior in America for the next 119 years.
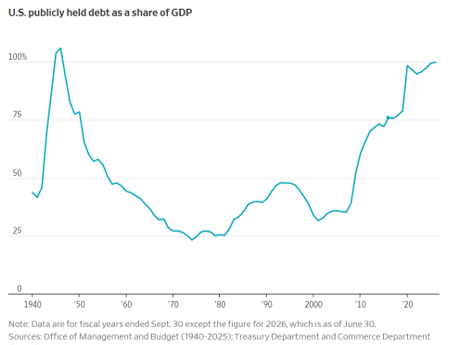
$40 Trillion in a Historical Perspective
Source: The Wall Street Journal
Measuring raw dollar debt over long spans of time can be misleading due to compound inflation. A far more accurate economic yardstick is calculating debt as a percentage of GDP (Gross Domestic Product). As shown above, national debt-to-GDP levels haven’t reached these heights in a generation – not since the massive fiscal spending surge needed to finance World War II.
Hand-wringing over national debt is hardly new. Over four decades ago, the front page of The New York Times (Sept 15, 1985) declared: “A $2 Trillion National Debt: Not Just Another Milestone.” The warnings then sounded identical to the alarms sounding today: “The $2 trillion figure reflects serious problems for government taxation and spending, as well as new strains on the economy.”
Just as in prior historical cycles, elevated debt ratios can eventually be brought back into balance. However, the longer policymakers kick the fiscal can down the road, the more difficult it will be to reverse the damaging trend. Mathematically, the remedy remains unchanged: the federal government must curb expenditures (Social Security, Medicare, and defense spending) and/or raise revenues (increase taxes).
How Can Stocks Prices Be at Record Highs?
Against a headline backdrop dominated by exploding federal debt, ongoing geopolitical conflict in the Middle East, Fed rate uncertainty, and AI data center backlash, how do equity markets keep hitting record highs?
It boils down to two fundamental drivers:
1) Surging Corporate Profitability
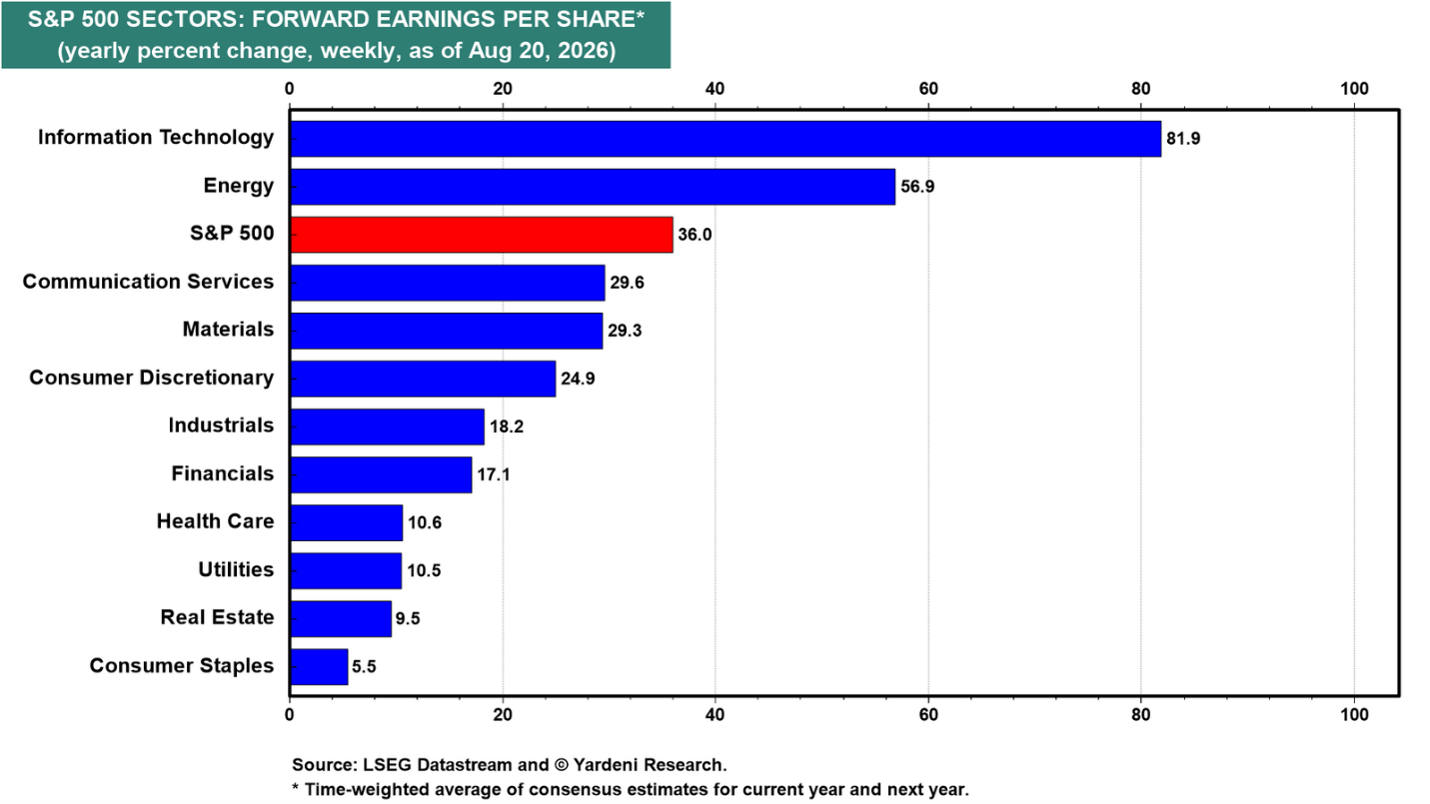
A solid underlying economy, anchored by healthy employment metrics (4.1% unemployment in July) is receiving a direct shot of adrenaline from the colossal capital investment flowing into artificial intelligence (see The Multi-Trillion AI Tsunami). Beyond reducing software coding overhead and customer support overhead via automated software agents, AI implementations are accelerating go-to-market timelines and driving faster top-line growth. The end result is an expanding waterfall of corporate profits, reflected in robust forward consensus estimates for +36% S&P 500 earnings growth (see chart below).
Source: Ed Yardeni
2) Mammoth AI Capex Converting to Revenues:
We remain in the early stages of the AI buildout, yet hyper-scalers and chipmakers are generating extraordinary top- and bottom-line expansion.
Consider NVIDIA Corp. (NVDA), sitting at the epicenter of the hardware buildout with a market valuation topping $5 trillion. The company recently posted nearly $100 billion in quarterly revenue while clearing over $50 billion in quarterly profit. Meanwhile, AI juggernaut Anthropic (founded just five years ago vs. NVIDIA 33 years ago), reported a $6.5 billion annual revenue run-rate in July, with internal projections pointing toward $190 billion to $200 billion by 2028. Reports indicate Anthropic is targeting a valuation as high as $2 trillion ahead of an anticipated public listing.
Airbnb: A Real-World AI Case Study
For skeptics questioning whether end-user enterprises are seeing concrete returns on their AI investments, look no further than the cloud computing divisions of major tech providers. Alphabet (GOOG), Amazon (AMZN), and Microsoft (MSFT) are collectively spending an estimated $615 billion in capital expenditures this year, which is backed by an impressive $1.4 trillion in combined remaining performance obligations (RPO) commitments from enterprise customers. The cloud divisions of the hyperscalers have achieved these whopping results with very minimal headcount growth (see AI Genie Out of the Bottle).
For the AI doubters, I would also direct you to the recent Q2 Shareholder report of Airbnb Inc. (ABNB), a Sidoxia Capital Management and personal investment. In the company’s Q2 Shareholder Letter, Co-Founder and CEO Brian Chesky detailed how fundamental integration of AI is translating into operational productivity.
“We’ve rebuilt Airbnb from the ground up to be an AI-native company, and it’s showing up in our results… On key initiatives, we’ve reduced the time from concept to delivery by as much as 60%. And compared to the same period last year, we’ve increased the number of features and improvements we’ve shipped this year by nearly 80%… The acceleration from AI allowed us to make hundreds of improvements across Airbnb for hosts and guests.”
These platform enhancements include:
- Hotel Stays: Seamless integration of thousands of new boutiques and independent hotels to the platform.
- Grocery Delivery: Partnered with grocer-delivery leader, Instacart (another Sidoxia investment).
- Car Rentals: Integrated rental car bookings with major fleets (including Hertz, Avis, Budget, and Enterprise).
- Airport Pickups: Feature added to increase convenience for travelers.
- Luggage Storage: Logistic benefit provided to customers arriving before check-in times (CEO called this a “sleeper hit”).

Source: Airbnb
It’s not difficult to imagine a day, in the not-too-distant future, when a query to Airbnb asking to organize my trip to Italy can result in the app automatically coordinating my entire customized itinerary in seconds.
Beyond improving the customer experience, AI is simultaneously reshaping Airbnb’s unit economics. Their AI customer support assistant now operates in 50 countries, resolving nearly 45% of incoming support inquiries autonomously without human agent intervention and has been rated the best AI support assistant in travel. This automation has driven a -16% reduction in its cost-per-booking translating into huge savings for the company.
Skeptics should take note of the next leg of AI expansion. The next major phase will be driven by all the companies/industries racing to learn and implement AI, so businesses can experience similar benefits accomplished by Airbnb.
The Net-Net
There is never a shortage of macroeconomic worries, including $40 trillion in national debt, central bank shifts, or geopolitical friction. Yet over multi-year horizons, stock prices track earnings and innovation. Right now, accelerating corporate productivity and the massive early-stage deployment of AI infrastructure remain the primary engines pushing equity markets to new all-time record highs.
Wade W. Slome, CFA, CFP®
Plan. Invest. Prosper.
This article is an excerpt from a previously released Sidoxia Capital Management complimentary newsletter (September 1, 2026). Subscribe Here to view all monthly articles.
Sidoxia Capital Management (SCM) and some of its clients hold positions in NVDA, GOOGL, AMZN, MSFT, ABNB and certain exchange traded funds (ETFs), but at the time of publishing had no direct position in any other security referenced in this article.
DISCLOSURE: No information accessed through the Investing Caffeine (IC) website constitutes investment, financial, legal, tax or other advice nor is to be relied on in making an investment or other decision. Each investor’s situation is unique so please work with a professional financial adviser, tax accountant or legal representative, as applicable, to develop an individualized plan or address any questions you may have. Investing involves risk including the possibility of loss of one’s investment.
A Sleepy Stock that Can Wake Up Your Portfolio

In over 35 years of investing, I have rarely encountered a company in such a unique – and frustrating – position as Harmony Biosciences (“Harmony” – HRMY). As a shareholder through my firm, Sidoxia Capital Management, I approach this analysis with a dual lens: as an investor seeing immense value, and as a fiduciary who expects corporate leadership to act in the best interest of its owners.
While Harmony’s executive team has executed brilliantly on its clinical mission, they are currently failing their fiduciary duty regarding capital allocation. Here is why Harmony is a “Diamond in the Rough” that needs a wake-up call.
Harmony Biosciences Overview – A Rare Disease Powerhouse
Harmony is a neuroscience-focused company targeting rare and underserved conditions such as narcolepsy, Prader-Willi Syndrome, and certain rare epilepsies—areas where treatment options are limited or nonexistent.
Today, the vast majority of revenue is driven by narcolepsy, a neurological disorder that disrupts sleep-wake cycles and leads to excessive daytime sleepiness and sudden sleep attacks. While approximately 135,000–200,000 Americans are diagnosed, the true number is likely higher due to underdiagnosis and misdiagnosis.
Harmony’s flagship drug, WAKIX (pitolisant), is on track to surpass $1 billion in annual revenue in 2026, achieving blockbuster status. Importantly, WAKIX is the only FDA-approved narcolepsy treatment that is not a controlled substance as defined by the U.S. Drug Enforcement Administration (DEA), providing a meaningful competitive advantage over alternative therapies.
Significant Growth Beyond WAKIX
Harmony’s long-term opportunity extends well beyond narcolepsy. The company is leveraging the pharmaceutical compound behind its franchise drug WAKIX (pitolisant) to expand and diversify its revenue base into additional CNS (Central Nervous System) indications, with five ongoing Phase 3 registrational programs (see below):
- Pitolisant HD (High Dose) – Idiopathic Hypersomnia (IH) – potential $1.5 billion – $2.0 billion market with possible FDA submission for approval in 2027.
- Pitolisant HD (High Dose) – Narcolepsy – potential to accelerate the growth of $1 billion WAKIX franchise (2026 estimate) by offering enhanced efficacy for fatigue. FDA submission for approval of Pitolisant HD could come in 2027.
- Pitolisant – Prader-Willi Syndrome (PWS) – There are an estimated 15,000–20,000 people in the U.S. with PWS. Over half of these targeted patients suffer from EDS, which is effectively treated with Pitolisant. PWS has a potential of reaching $300 million – $500 million in revenue and receiving FDA submission for approval during the 2nd half of 2026.
- EPX-100 (Clemizole HCl) – Dravet Syndrome (epilepsy with onset at infancy) – expands Harmony into a potential $800 million global market by 2030 with possible FDA submission for approval in the 1st half of 2027.
- EPX-100 (Clemizole HCl) – Lennox-Gastaut Syndrome (LGS) (epilepsy with multiple seizure types) – opens the company to a potential $1 billion market globally.
Collectively, this pipeline has the potential to generate billions in incremental revenue.
A Diamond in the Rough

There are many ways to value a stock, but one common approach is to compare a company’s price-to-earnings ratio (P/E) to that of the S&P 500. Generally, stocks trading below the market’s average P/E are considered cheap, while those above it are viewed as more expensive.
Harmony shares currently trade at approximately 8x trailing twelve-month earnings and 7x its 2026 earnings forecast. By comparison, this represents roughly a -70% discount to the average S&P 500 stock. Based on these metrics, Harmony appears dramatically undervalued—assuming the company’s fundamentals remain intact.
Of course, valuation must be considered alongside growth and execution. On that front, management continues to emphasize strong underlying performance.
And the results support that claim. In less than three years, CEO Dr. Jeffrey Dayno has grown revenue by approximately 74%, from roughly $500 million in April 2023 to over $860 million today, with expectations to exceed $1 billion in annual sales by the end of the year.
But wait, there’s more. The balance sheet tells a similarly compelling story. Over that same period, Harmony’s net cash position (gross cash minus debt) has increased from approximately $201 million to $719 million, even after completing two acquisitions totaling about $69 million (Zynerba and Epygenix). During this time, quarterly revenue growth has averaged roughly +23%, while cash has more than tripled, despite the acquisitions.
What’s more, Harmony’s cash profitability is equally impressive. In 2025, Harmony generated a 40% free cash flow margin, meaning $0.40 of every $1 of revenue converted into free cash flow. That level of efficiency would rank among the top two percent of companies in the S&P 500, placing Harmony alongside some of the most profitable behemoths in the market, including NVIDIA Corp.
Which brings us to the key question: If the stock is this inexpensive and the fundamentals are this strong, why isn’t the company aggressively repurchasing its own shares hand-over-fist? To date, management has not provided a clear or credible answer to this question.
What is the Downside to Harmony?
All this fundamental strength and financial momentum sounds like great news for shareholders—but where’s the risk and bad news? Regrettably, despite strong execution under CEO Dr. Jeffrey Dayno over the past three years, the stock is down approximately -14% (from ~$32 to ~$28 per share).
If everything is going so well, why have investors been so spooked recently? The primary concern centers on potential generic competition for WAKIX, the company’s key drug. To Harmony’s credit, it has already settled litigation with six of seven generic challengers, but one holdout—AET Pharma—has taken the case to trial. Some Wall Street analysts and investors believe the judge may rule in favor of AET, which contributed to a sharp decline in the stock last month.
If Harmony loses, WAKIX’s patent protection—currently expected to extend through 2030—could be materially weakened, potentially allowing generic competition to enter the market as early as late 2026 or early 2027, depending on the timing of the ruling and subsequent developments.
Fear not, says management. They remain confident in their defense strategy. As CEO Dr. Dayno stated, “Pitolisant GR will extend the WAKIX franchise and our leadership in narcolepsy as a line extension of WAKIX with its broad clinical utility. We are on track for NDA submission in Q2 this year with a target PDUFA date in Q1 2027.”
Management believes this next-generation formulation, Pitolisant GR, could significantly mitigate—or even eliminate—the impact of generic competition. Unlike WAKIX, which faces potential patent challenges, Pitolisant GR is expected to have patent protection through 2044.
If the timeline holds, the company expects a substantial portion of WAKIX patients to transition to GR, reducing the impact of any generic entrants. Additionally, even in a worst-case scenario where AET prevails, the financial risk associated with launching an “at-risk” generic—particularly if Harmony were to win on appeal—could be significant enough to deter entry and easily push AET towards a settlement with Harmony.
Am I Missing Something?
When a stock trades at such an egregiously low valuation, I inevitably ask myself, “Am I missing something?” If management is sitting on its hands doing nothing, perhaps Harmony’s fundamental outlook is worse than they are leading investors to believe. If management is unwilling to deploy even a portion of its inefficient, over-bloated cash hoard toward share repurchases – especially with the stock arguably at its cheapest level in history – why should investors commit their hard-earned capital to what could be a sinking ship?
Is it possible that management lacks confidence in the Pitolisant GR NDA data, or that the Q2 NDA timeline could slip? If so, and if AET prevails in court, Harmony’s entire $1 billion franchise revenue base could be at risk.
Management has dismissed these concerns and continues to insist that everything is on track. If that’s truly the case, then – with a clear line of sight into the company’s prospects – Harmony should be aggressively buying back its stock if the outlook is as strong and rosy as they claim.
Actions Speak Louder than Words

According to management, Harmony’s fundamentals remain robust. Not only does Harmony have five late-stage, phase three indications in the pipeline, it also claims to have a near bullet-proof generic competition protection strategy. Yet, with the stock down around -33% from its 52-week high, it is difficult to justify why management is not forcefully repurchasing shares at prices that are currently highly accretive to EPS.
I have raised this issue with senior management multiple times, but unfortunately my concerns have fallen on deaf ears. I’m hardly alone – other investors have voiced similar frustrations but inaction remains the default stance of management. The company’s response to this elephant in the room remains perplexing.
On the most recent fourth quarter conference call with investors, CFO Sandip Kapadia stated, “Business development is a high priority, and our intention is to deploy capital to expand our pipeline and commercial portfolio.” CEO Dr. Jeffrey Dayno echoed this sentiment, emphasizing a “commitment to generate even greater value through the pursuit of smart business development opportunities.”
It’s great that Harmony “intends” to deploy capital and “pursue” opportunities, but the fact remains, Harmony effectively has not devoted a penny over the last two years to capital deployment, and the company has spent next-to-nothing on capital deployment since the company’s IPO (Initial Public Offering) in August 2020.
Meanwhile, the company’s massive net cash balance – currently $719 million – is rapidly expanding by more than $100 million+ per quarter and is on track to swell to $1 billion this year. By the end of 2026, cash could represent as much as two-thirds of Harmony’s total market value, particularly if the share price remains depressed or declines further.
Walking and Chewing Gum

Can Harmony walk and chew gum at the same time? In other words, can the company allocate a portion of its gigantic cash balance toward a monumentally accretive share repurchase program while simultaneously pursuing business development (M&A – Mergers & Acquisitions) opportunities? The short answer is yes.
In fact, Harmony did exactly that in 2023 and 2024 – deploying nearly half of its cash toward share buybacks while ALSO completing two acquisitions that contributed to its expanding pipeline of promising new indications.
Management argues it’s currently evaluating a broad list of acquisition targets. However, one could reasonably contend that Harmony will be hard-pressed to find opportunities more attractive than its own stock. The bar is exceptionally high: identifying highly profitable companies with similarly robust pipelines, that are also trading at a steep discount and offering comparable growth characteristics.
By comparison, Harmony’s own shares appear to trade at roughly a -70% discount to the market, with approximately 50% of its market capitalization in cash, while delivering ~20% top-line growth, and securing a deep pipeline of five Phase 3 programs. Under these conditions, it seems like Harmony buying back their own stock is a no-brainer.
Where Is the Board and Why Are They Not Acting?

This is a question I’m asking, and I hope the board will answer the capital allocation question more thoughtfully. Ideally, the response will come in the form of a material share repurchase (i.e., action).
For those curious, I have identified the distinguished group of Harmony board members, and I intend to pursue an explanation relating to the board’s inaction. Here are Harmony’s current board members:
- Jeffrey S. Aronin (Executive Chairman) – Founder and CEO of Paragon Biosciences.
- Jeffrey M. Dayno, MD (President, CEO & Director) – Former CMO of Harmony; Board-certified neurologist.
- Peter Anastasiou (Independent Director) – CEO of Capsida Biotherapeutics; former Lundbeck executive.
- Antonio Gracias (Independent Director) – Founder/CEO of Valor Equity Partners and Director at Tesla.
- Mark Graf (Independent Director) – Former CFO of Discover Financial Services.
- Ron Philip (Independent Director) – CEO of Orbital Therapeutics and former CEO of Spark Therapeutics.
- Juan Sabater (Independent Director) – Partner at Valor Equity Partners and former Goldman Sachs MD.
- Gary Sender (Independent Director) – Former CFO of Nabriva Therapeutics and Shire PLC.
- Linda Szyper (Independent Director) – Former COO of McCann Health; pharmaceutical sales veteran.
- Andreas Wicki, PhD (Independent Director) – CEO of HBM Healthcare Investments.
I’m not sure whether the board is asleep at the switch, but it has a clear fiduciary duty to allocate capital efficiently and maximize shareholder value. Allowing the balance sheet to become excessively bloated while taking no meaningful action falls short of that responsibility. The company needs to act.
As Harmony’s share price remains stagnant and under pressure, management and the board continue to irresponsibly let cash accumulate. Net cash now represents approximately 45% of the company’s market capitalization. If Harmony were in the S&P 500, this would place it among the top 1% of companies by cash as a percentage of market value – all while trading at roughly a -70% discount to the broader market.
We remain long-term shareholders, but there are only two plausible explanations. Either management is correct, and this represents a generational buying opportunity—or the company knows something investors do not, which may explain the lack of action and the continued buildup of cash.
Bottom line: assuming a successful defense against generic competition and a conservative rollout of the pipeline—including Pitolisant GR and Pitolisant HD—$7 in EPS by 2030 at a 22x multiple implies a $154 price target, or roughly +450% upside from today’s ~$28 share price.
Harmony may be a sleepy stock today, but it has all the ingredients to wake up your portfolio. While management and the board have been slow to act and have yet to fully meet their fiduciary responsibility on capital allocation, I remain optimistic that they will ultimately do the right thing. By deploying capital more effectively – most notably through a meaningful share repurchase at today’s historically attractive valuation – Harmony has the opportunity to awaken significant shareholder value and live up to its full potential.
Wade W. Slome, CFA, CFP®
Plan. Invest. Prosper.
DISCLOSURE: Sidoxia Capital Management (SCM) and some of its clients hold positions in HRMY, NVDA, TSLA, GS, and certain exchange traded funds (ETFs), but at the time of publishing had no direct position in DFS, HBMN, HLUYY, or any other security referenced in this article. No information accessed through the Investing Caffeine (IC) website constitutes investment, financial, legal, tax or other advice nor is to be relied on in making an investment or other decision. Please read disclosure language on IC Contact page.
As We Give Thanks, AI and Mag 7 Take Cash to the Bank

Market volatility resurfaced last month as speculation intensified over whether an AI bubble may be forming—and potentially bursting. Yet despite the jitters, equity markets remain solidly positive for the year (S&P 500 +16.5%, NASDAQ +21.0%, Dow +12.2%) – see S&P 500 chart below. A significant portion of the gains have been powered in large part by ongoing strength in the Magnificent 7. Standouts such as NVIDIA (+31.8%) and Alphabet (+68.1%) have been instrumental in carrying the broader indices higher.

Even with these sizable year-to-date gains, memories of the 2000 Tech Bubble and 2008 Financial Crisis resurfaced and prompted investors to temporarily tap the brakes. Mid-month, the NASDAQ retreated roughly -9% from its October peak. After a month-end bounce, the S&P 500 finished essentially flat (+0.1%), the NASDAQ slipped -1.5%, and the Dow eked out a +0.3% increase.
OpenAI and the $1.4 Trillion Question
At the center of the AI controversy sits OpenAI, parent of the three-year-old technology toddler, ChatGPT (Generative Pre-trained Transformer), which now boasts more than 800 million global users (see chart below). The company reportedly runs at a $20 billion annual revenue pace, yet faces difficult questions about how it intends to fund its staggering $1.4 trillion AI infrastructure commitments.
Those concerns came to a head when tech investor Brad Gerstner pressed CEO Sam Altman on his podcast last month. Instead of answering how OpenAI plans to underwrite such an enormous buildout, Altman childishly shot back defensively:
“If you want to sell your shares, I’ll find you a buyer.” (See clip here — or full interview here)

Source: Digital Information World
OpenAI is a key player, but just one component in the vast—and rapidly expanding—web of global AI infrastructure. Gartner, a global research and advisory firm, forecasts $2 trillion of AI investment in 2026, while NVIDIA CEO Jensen Huang recently said:
“Over the next five years, we’re going to scale into… effectively a $3 to $4 trillion AI infrastructure opportunity.”
These provocative “Is this a bubble?” questions make for great headlines, but to truly evaluate AI sustainability, it’s wise to follow the classic Watergate guidance from of All the President’s Men character, Deep Throat (FBI Associate Director, Mark Felt), who tells journalist Bob Woodward to “follow the money,” if he wants to get to the bottom of the Watergate scandal.
The same principle applies to investors who follow the money – the picture looks very different from past bubbles.
Forget Pets.com—Today’s AI Buildout Is Being Funded by Cash-Rich Titans
Unlike the flimsy, profitless internet startups of the late 1990s—companies that raised billions based on “eyeballs” and cocktail-napkin business plans—the current AI buildout is being financed largely by profitable cash-generating giants.
Yes, some firms like Oracle (ORCL) are leaning on debt financing for data-center expansion. But the overwhelming majority of AI capex is being funded by customers and by the cash flow of the Magnificent 7, a group with the financial firepower to sustain multi-year spending without relying heavily on capital markets.
This dynamic alone separates today’s environment from classic bubble conditions.
Do the Magnificent 7 Really Deserve a $22 Trillion Valuation?
The Mag 7 represent only 1% of S&P 500 constituents yet account for a massive 35% of the index’s market value. That concentration understandably raises eyebrows, evoking historical parallels to the “Nifty Fifty” of the 1970s or the “Four Horsemen” of the 1990s.
But headline concentration can be misleading—because the fundamentals tell a very different story. Here are some of the major disparities:
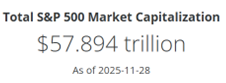
1.) Mag 7 Share of Profits Matches Their Share of Market Value: The Mag 7 collectively contribute $22 trillion of the S&P 500’s $58 trillion total value (below). Said differently, the market values and weightings of the Mag 7 equate to about $22 trillion and 37% of the S&P 500, respectively:
· Nvidia Corp: $4.3T & 7.0%
· Apple Inc.: $4.1 T & 6.7%
· Alphabet Inc.: $3.9 T & 6.3%
· Microsoft Corp.: $3.7 T & 5.9%
· Amazon.com Inc.: $2.5 T & 4.0%
· Meta Platforms Inc.: $1.6T & 2.6%
· Tesla Inc.: $1.4T & 2.3%
· TOTAL: $22T / 37%
Source: Slickcharts
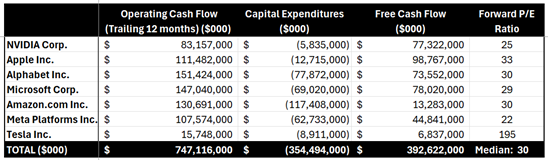
Conveniently (and importantly), the Mag 7’s roughly $747 billion in annual cash flow (see table below) is a good proxy for their profit contribution to the $2 trillion in S&P profits.
Source: SEC Filings & MarketSurge
The $747 billion in Mag 7 cash flows divided by the $2 trillion in S&P 500 coincidentally also equates to 37% ($747B/$2T).
These calculations of the Mag 7 are not bubble math—these calculation comparisons are rational math. Arguments could be made that Mag 7 market values are actually undervalued (not in bubble territory) and should appreciate to a higher percentage of the S&P 500 weightings because these 7 stocks are growing sales and profits faster than compared to the other “absentee” 493 stocks in the index.
2.) Mag 7 are Swimming in Cash: That $747 billion in annual cash flow is on track to hit a jaw-dropping $1 trillion, giving these firms ample capital to fund AI buildouts without substantially accessing the equity or credit markets. The ability to self-fund a multi-trillion-dollar infrastructure expansion is the opposite of bubble behavior.
3.) Valuations Are Elevated—but Far from Bubble Territory: During the 2000 Tech Bubble, many leading tech names traded at 100x+ earnings (See also: Rational or Irrational Exuberance. Today, the Mag 7 trade at a median forward P/E around 30x. Expensive? Historically, yes, versus long-term averages, but nowhere near historical extremes. Relative to growth, profitability, and cash flow, valuations are far more grounded today than during prior manias.
The bottom line is there is plenty to be thankful for and bubble fears are overstated. Despite pockets of AI froth, the underlying economic engine powering AI adoption is real, profitable, and well-capitalized. When investors follow the money, they discover:
· The Mag 7 generate over one-third of S&P 500 profits
· They generate and hold hundreds of billions in cash
· They largely fund their own AI capital expenditures
· Valuations remain far below bubble-era extremes
Investors have a lot to be thankful for. And while volatility will likely continue, the ingredients for a classic, catastrophic AI bubble are noticeably absent. For disciplined, long-term investing strategies like those employed at Sidoxia Capital Management, this environment still offers abundant opportunity—without the need to fear a pricked AI balloon anytime soon.
Wade W. Slome, CFA, CFP®
Plan. Invest. Prosper.
This article is an excerpt from a previously released Sidoxia Capital Management complimentary newsletter (Dec. 1, 2025). Subscribe Here to view all monthly articles.
DISCLOSURE: Sidoxia Capital Management (SCM) and some of its clients hold positions in NVDA, AAPL, MSFT, GOOGL, AMZN, META, TSLA, and certain exchange traded funds (ETFs), but at the time of publishing had no direct position in ORCL or any other security referenced in this article. No information accessed through the Investing Caffeine (IC) website constitutes investment, financial, legal, tax or other advice nor is to be relied on in making an investment or other decision. Please read disclosure language on IC Contact page.
A.I. Field of Dreams

In the 1989 Academy Award–nominated film Field of Dreams, the lead character Ray Kinsella (played by Kevin Costner) hears a mysterious voice whisper, “If you build it, he will come.” Acting on blind faith, Ray builds a baseball diamond in the middle of his Iowa cornfield, risking financial ruin. Against all logic, the field draws a flood of visitors.
Today, a similar “field of dreams” is being built—not with corn, but with data centers. Instead of baseball players, it is artificial intelligence (AI) models, applications, and users who are coming.
The Market’s AI Momentum
The AI boom has already reshaped markets with all three benchmarks hitting record highs. Last month, the S&P 500 climbed +1.9%, while the NASDAQ rose +1.6% and Dow Jones Industrial Average surged +3.2%. Year to date, the indexes are up +10%, +11%, and +7%, respectively.
Behind this surge lies an unprecedented wave of AI infrastructure investment. Hyperscalers—Amazon.com (AMZN), Microsoft Corp. (MSFT), Google-Alphabet (GOOGL), Meta Platforms (META), and others—are pouring hundreds of billions into AI, much of it flowing directly to NVIDIA Corp. (NVDA), the undisputed leader in GPUs (Graphic Processing Units) powering the world’s AI engines. How large is the spending? NVIDIA CEO Jensen Huang estimates $3 trillion to $4 trillion will be spent this decade to fuel the AI revolution.

Source: Visual Capitalist
The Scale of AI’s Buildout
To put this into perspective:
- Amazon is projected to spend over $100 billion in 2025 alone, more than its cumulative capital expenditures from 2000–2020 combined.
Meta is constructing its $10 billion+ Hyperion data center in Louisiana—a sprawling 4 million sq. ft. complex across 2,250 acres, powered by a $4 billion natural gas plant. The footprint is so gargantuan it could cover much of Manhattan (see graphic below).

- xAI’s Colossus, a 750,000 sq. ft. data center in Memphis, Tennessee was completed in just 122 days—equivalent to building 418 homes in half the time it normally takes to construct one house (see slide below).

Source: BOND (Global Technology Investment Firm)
This breakneck pace of spending underscores the urgency and competitive pressure driving the global AI arms race.
The Origin of the AI Floodgates Opening

The spark was lit on November 30, 2022, when OpenAI released its LLM (large language model) called ChatGPT. Within two months, it amassed 100 million users.
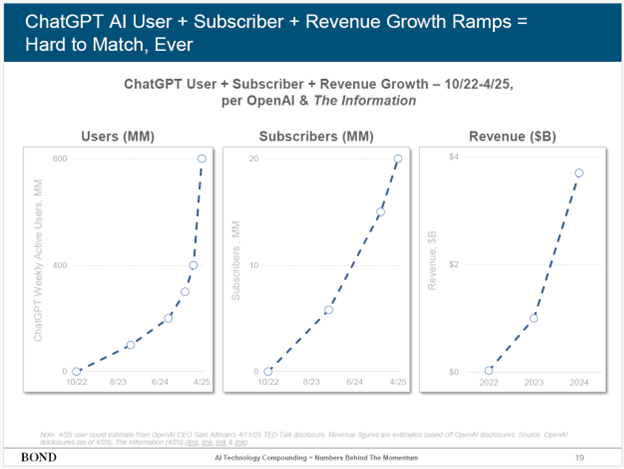
Today, ChatGPT’s metrics have blasted much higher (see slide below):
- 800 million weekly active users
- 20 million paid subscribers
- $3.7 billion in revenue (as of April 2025)
Source: BOND (Global Technology Investment Firm)
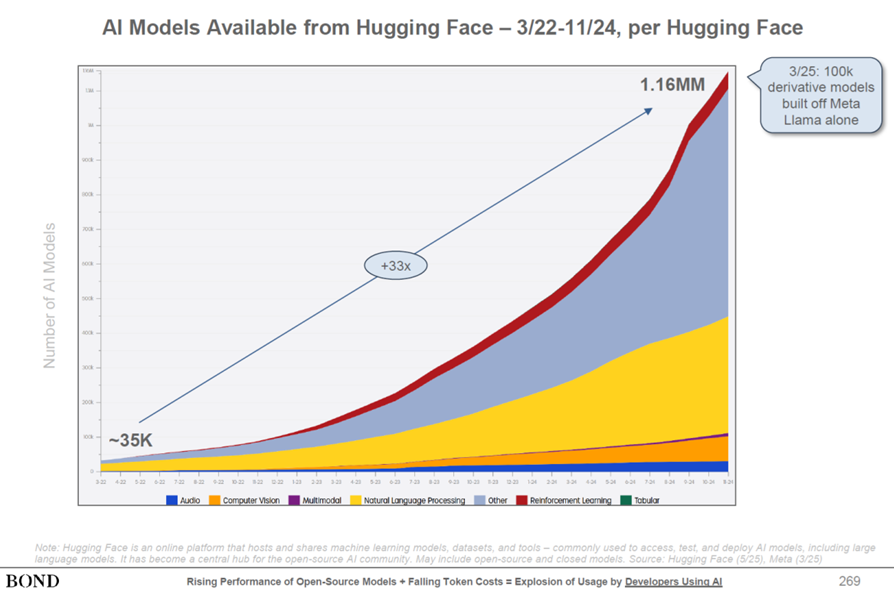
But OpenAI is far from alone. Google (Gemini), xAI (Grok), Anthropic (Claude), Meta (LLaMA), Amazon (Titan), Perplexity, and DeepSeek are all competing with their own LLMs. In total, over 1 million machine learning models now exist (see slide below) — each requiring costly compute power and pricey data centers.
Source: BOND (Global Technology Investment Firm)
Bubble or Productivity Breakthrough?
With trillions flowing into AI, a natural question arises: Is this a bubble?
Even OpenAI CEO Sam Altman admits we’re in an AI bubble :
“When bubbles happen, smart people get overexcited about a kernel of truth…Someone is going to lose a phenomenal amount of money… and a lot of people are going to make a phenomenal amount of money.”
Both realities can be true:
- Yes, hyperscalers are spending like “drunken sailors.”
- Yes, AI demand and productivity benefits are real and growing exponentially.
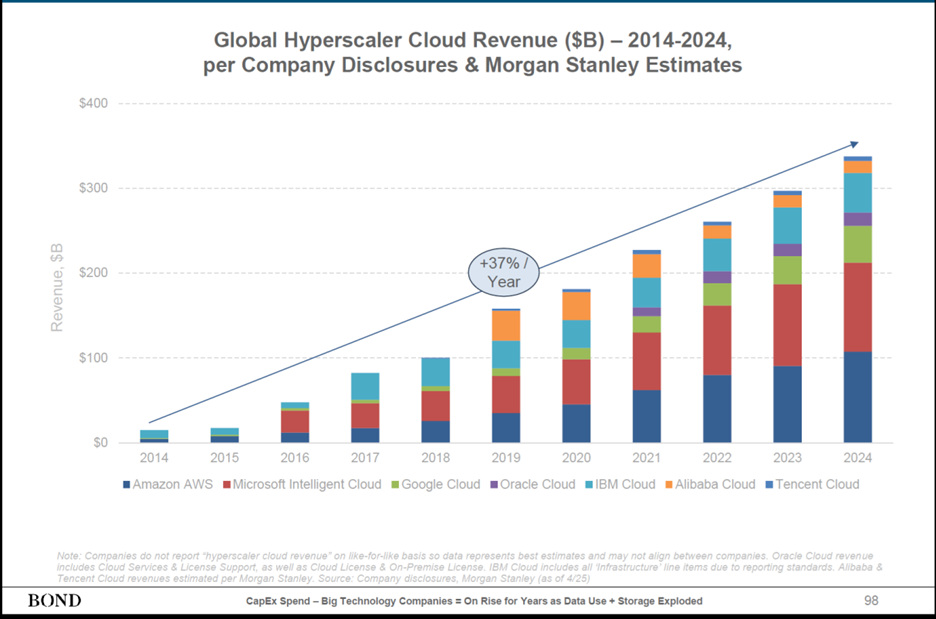
Consider the trajectory of global cloud revenues: from nearly $0 a decade ago to $300 billion today—a +37% CAGR (see chart below).
Source: BOND (Global Technology Investment Firm)
And the primary reason for cloud growth can be attributed to AI productivity benefits. A recent SAP survey found that workers using AI save nearly one hour per day on average. That’s transformative for companies: higher productivity without needing proportional hiring.
AI Use Cases Expanding Aggressively
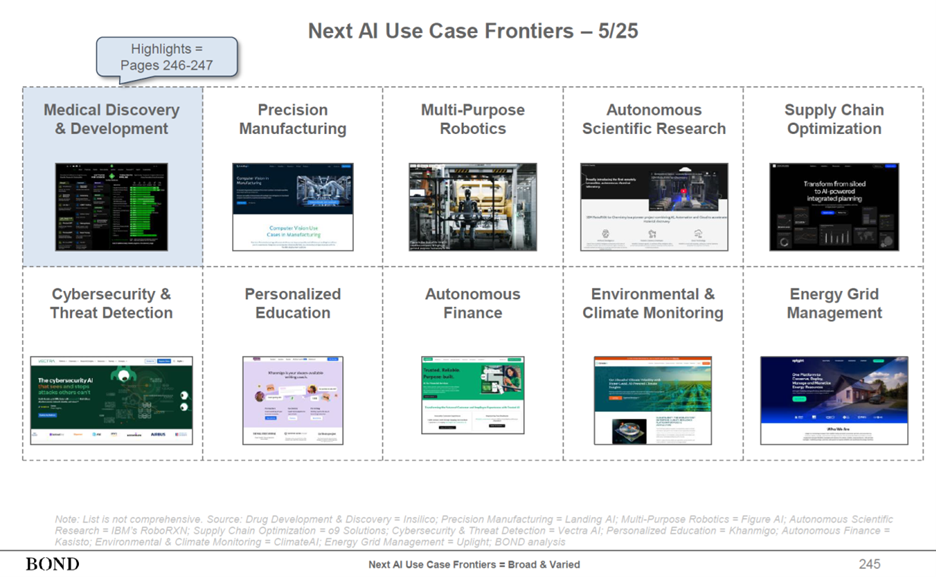
AI’s applications now span nearly every sector (see slide below):
- Technology – software engineering, code generation
- Customer Service & Marketing – customer support and call centers
- Transportation – autonomous vehicles and logistics
- Healthcare – drug discovery and development
- Supply Chains – precision manufacturing and optimization
- Automation – multi-purpose robotics
- Cybersecurity – threat detection and prevention
- Education – personalized lessons and curriculums
- Energy – grid optimization and demand forecasting
Source: BOND (Global Technology Investment Firm)
The New Field of Dreams
Throughout history, every great leap—printing press, steam engine, electricity, internet—has required massive upfront investment before the payoff arrived. AI is following the same path. Today, we are in the midst of building a new AI Field of Dreams. However, now, the data centers are the new baseball fields. And as with Ray Kinsella’s diamond, the masses are indeed coming.
Wade W. Slome, CFA, CFP®
Plan. Invest. Prosper.
This article is an excerpt from a previously released Sidoxia Capital Management complimentary newsletter (August 1, 2025). Subscribe Here to view all monthly articles.
DISCLOSURE: Sidoxia Capital Management (SCM) and some of its clients hold positions in GOOGL, META, AMZN, MSFT, NVDA, and certain exchange traded funds (ETFs), but at the time of publishing had no direct position in SAP or any other security referenced in this article. No information accessed through the Investing Caffeine (IC) website constitutes investment, financial, legal, tax or other advice nor is to be relied on in making an investment or other decision. Please read disclosure language on IC Contact page.
Tariff, Fed, & Facebook Fears but No Easter Bunny Tears

After an explosive 2017 (+19.4%) and first month of 2018 (+5.6%), the Easter Bunny came out and laid an egg last month (-2.7%). It is normal for financial markets to take a breather, especially after an Energizer Bunny bull market, which is now expanding into its 10th year of cumulative gains (up +296% since the lows of March 2009). Investors, like rabbits, can be skittish when frightened by uncertainty or unexpected events, and over the last two months, that’s exactly what we have seen.
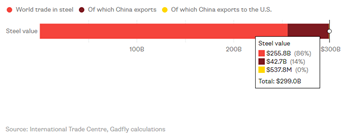
Fears of Tariffs/Trade War: On March 8th, President Trump officially announced his 25% tariffs on steel and 10% on aluminum. The backlash was swift, not only in Washington, but also from international trading partners. In response, Trump and his economic team attempted to diffuse the situation by providing temporary tariff exemptions to allied trading partners, including Canada, Mexico, the European Union, and Australia. Adding fuel to the fire, Trump subsequently announced another $50-$60 billion in tariffs placed on Chinese imports. To place these numbers in context, let’s first understand that the trade value of steel (roughly $300 billion – see chart below), aluminum, and $60 billion in Chinese products represent a small fraction of our country’s $19 trillion economy (Gross Domestic Product). Nevertheless, financial markets sold off swiftly this month in unison with these announcements. The selloff did not necessarily occur because of the narrow scope of these specific announcements, but rather out of fear that this trade skirmish may result in large retaliatory tariffs on American exports, and ultimately these actions could blow up into a full-out trade war and trigger a spate of inflation.
Source: Bloomberg
These trade concerns are valid, but at this point, I am not buying the conspiracy theories quite yet. President Trump has been known to use fiery rhetoric in the past, whether talking about building “The Wall” or threats to defense contractors regarding the pricing of a legacy Air Force One contract. Often, the heated language is solely used as a first foray into more favorable negotiations. President Trump’s tough tariff talk is likely another example of this strategy.
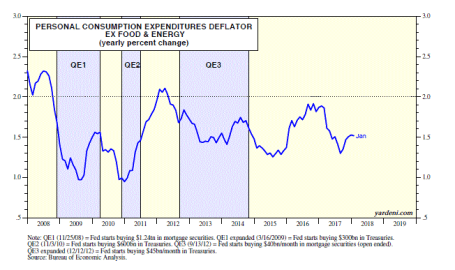
Interest Rate/Inflation Phobia: Beginning in early February, anxiety in the equity markets intensified as interest rates on the benchmark 10-year Treasury note have now risen from a September-low yield of 2.40% to a 2018-high of 2.94%. Since that short-term high this year, rates have moderated to +2.74%. Adding to this month’s worries, Fed Chairman Jerome Powell hiked interest rates on the Federal Funds interest rate target by +0.25% to a range of 1.50% to 1.75%. While the direction of rate increases may be unnerving to some, both the absolute level of interest rates and the level of inflation remain relatively low, historically speaking (see 2008-2018 inflation chart below). Inflation of 1.5% is nowhere near the double digit inflation experienced in the late-1970s and early 1980s .
Source: Dr. Ed’s Blog
It is true that rates on mortgages, car loans, and credit cards might have crept up a little, but from a longer-term perspective rates still remain significantly below historical averages. Even if the Federal Reserve increases their interest rate target range another two to three times in 2018 as currently forecasted, we will still be at below-average levels, which should still invigorate economic growth (all else equal). In car terms, if the current strategy continues, the Fed will be moving from a strategy in which they are flooring the economic pedal to the medal, to a point where they will only be going 10 miles per hour over the speed limit. The strategy is still stimulative, but just not as stimulative as before. At some point, rising interest rates will slow down (or choke off) growth in the economy, but I believe we are still a long way from that happening.
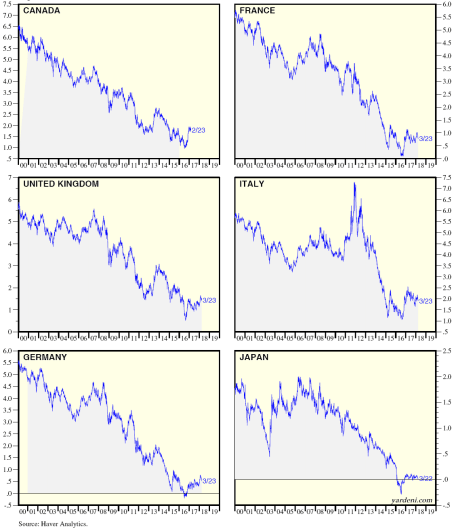
Why am I not worried about runaway interest rates or inflation? For starters, I believe it is very important for investors to remove the myopic blinders, so they can open their eyes to what’s occurring with global interest rate trends. Although, U.S. rates have more than doubled from July 2016 to 2.74%, as long as interest rates in developed markets like Japan, the European Union, and Canada, remain near historically low levels (see chart below), the probabilities of runaway higher interest rates and inflation are unlikely to transpire.
Source: Ed Yardeni
With the Japanese 10-year government bond yielding 0.04% (near-zero percent), the German 10-year bond yielding 0.50%, and the U.K. 10-year bond yielding 1.35%, one of two scenarios is likely to occur: 1) global interest rates rise while U.S. rates decline or remain stable; or 2) U.S. interest rates decline while global rates decline or remain stable. While either scenario is possible, given the lack of rising inflation and the slack in our employment market, I believe scenario #2 is more likely to occur than scenario #1.
Privacy, Politics, and Facebook: A lot has recently been made of the 50 million user profiles that became exposed and potentially exploited for political uses in the 2016 presidential elections. How did this happen, and what was the involvement of Facebook Inc. (FB)? If you have ever logged into an internet website and been given the option to sign in with your Facebook password, then you have been exposed to third-party applications that are likely mining both your personal and Facebook “friend” data. The genesis of this particular situation began when Aleksandr Kogan, a Russian American who worked at the University of Cambridge created a Facebook quiz app that not only collected personal information from approximately 270,000 quiz-takers, but also extracted information from about 50 million Facebook friends of the quiz takers (data scandal explained here).
Mr. Kogan (believed to be in his early 30s) allegedly sold the Facebook data to a company called Cambridge Analytica, which employed Steve Bannon as a vice president. This is the same Steve Bannon who eventually became a senior adviser for the Trump Administration. Facebook has defended itself by blaming Aleksandr Kogan and Cambridge Analytica for violating Facebook’s commercial data sharing policies. Objectively, regardless of the culpability of Kogan, Cambridge Analytica, and/or Facebook, most observers, including Congress, believe that Facebook should have more closely monitored the data collected from third party app providers, and also done more to prevent such large amounts of data to be sold commercially. Now, the CEO (Chief Executive Officer) of Facebook, Mark Zuckerberg, faces an appointment in Washington DC, where he will receive tongue lashings and be raked over the coals, so politicians can better understand the breakdown of this data breach.
It is certainly possible that a large amount of data was compromised for political purposes relating to the 2016 presidential election. There has been some backlash as evidenced by a few high profile users threatening to leave the Facebook platform like actor/comedian Will Ferrell, Tesla CEO Elon Musk, and singer Cher, but since the data scandal was unearthed, there has been little evidence of mass defections. Even considering all the Facebook criticism, the stickiness and growth of Facebook’s 1.4 billion (with a “b”) monthly active users, coupled with the vast targeting capabilities available for a wide swath of advertisers, likely means any negative impact will be short-lived. Even if there are defectors, where will all these renegades go, Instagram? Well, if that were the case, Instagram is owned by Facebook. Snapchat, is another Facebook alternative, however this platform is skewed toward younger demographics, and few people who have invested years of sharing/saving memories on the Facebook cloud, are unlikely to delete these memories and migrate that data to a lesser-known platform.
Financial markets move up and financial markets down. The first quarter of 2018 reminded us that no matter how long a bull market may last, nothing money-related moves in a straight line forever. The fear du jour constantly changes, and last month, investors were fretting over tariffs, the Federal Reserve’s monetary policy, and a Facebook data scandal. Suffice it to say, next month will likely introduce new concerns, but one thing I do not need to worry about is an empty Easter basket. It will take me much longer than a month to work through all the jelly beans, chocolate bunnies, and marshmallow Peeps.

Wade W. Slome, CFA, CFP®
Plan. Invest. Prosper.
This article is an excerpt from a previously released Sidoxia Capital Management complimentary newsletter (April 2, 2018). Subscribe on the right side of the page for the complete text.
DISCLOSURE: Sidoxia Capital Management (SCM) and some of its clients hold positions in FB, AMZN, TSLA, and certain exchange traded funds (ETFs), but at the time of publishing had no direct position in any other security referenced in this article. No information accessed through the Investing Caffeine (IC) website constitutes investment, financial, legal, tax or other advice nor is to be relied on in making an investment or other decision. Please read disclosure language on IC Contact page.
Investors Slowly Waking to Technology Tailwinds

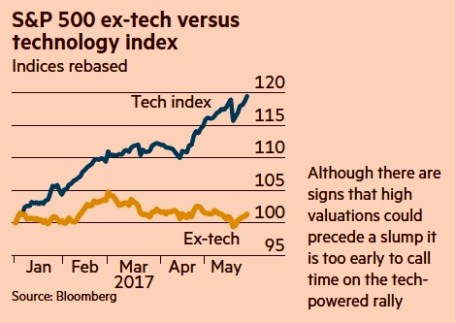
In recent years, investors have been overwhelmingly been distracted by geopolitical headlines and risk aversion caused by the worst financial crisis in a generation. In the background, the tailwinds of technological innovation have been silently gaining momentum. Although this topic is nothing new for Investing Caffeine followers, the outperformance of technology stocks has been pretty stunning in 2017 (see chart below), with the S&P 500 Technology sector rising almost +20% versus the Non-Tech sector eking out a little more than +1% return. Peered through the style lenses of Growth versus Value, technology’s contribution is also evident by the Russell 1000 Growth index’s 2017 outperformance over the Russell 1000 Value index by +11% (approximately +14% vs +3%, respectively).
Source: Bloomberg via The Financial Times
More specifically, what’s driving a significant portion of this outperformance? Robin Wigglesworth from The Financial Times highlighted a key contributing trend here:
“Facebook, Apple, Amazon and Netflix have all gained over 30 per cent this year, and Google is up 24 per cent. Their total market capitalisation now stands at $2.4 trillion. That makes them bigger than the French CAC 40 or Germany’s Dax, and nearly as large as the FTSE 100.”
Technology’s domination has been even more impressive since the cycle bottom of stock prices in 2009, if one contrasts the stark difference in the performance of the tech-heavy NASDAQ versus the more sector-balanced S&P 500. Over this timeframe, the NASDAQ has more than quadrupled in value and beaten the S&P 500 by more than +120%.
While the mass media likes to talk about technology bubbles, artificial money printing by global central banks, and imminent recessions, for years I have been highlighting the importance of the technology revolution and its beneficial impact on stock prices. Here are a few examples:
Technology Does Not Sleep in a Recession (2009)
Technology Revolution Raises Tide (2010)
NASDAQ and the R&D Tech Revolution (2014)
NASDAQ 5,000…Irrational Exuberance Déjà Vu? (2014)
The Traitorous 8 and Birth of Silicon Valley (2016)
As I have explained in many of my previous writings, the important factors of technology, globalization, and demographics have been the key driving forces behind the stock bull market and multi-decade decline in interest rates – not Quantitative Easing (QE) and/or rising debt levels.
Eventually, undoubtedly, euphoria and over-investment will lead to a cyclically-driven recession caused by excess capacity (supply exceeding demand). Regardless of the timing of future economic cycles, the continued multi-generational advance in new technological innovations will continue to drive economic growth, disinflation, improved standards of living, and higher stock prices. Until the animal spirits of the masses fully embrace this technological trend, Sidoxia and its clients will enjoy the tailwind of innovation as I continue to discover attractive investment opportunities.
Wade W. Slome, CFA, CFP®
Plan. Invest. Prosper.
DISCLOSURE: Sidoxia Capital Management (SCM) and some of its clients own FB, AAPL, AMZN, GOOG/L, certain exchange traded funds, and short position in NFLX, but at the time of publishing SCM had no direct position in any other security referenced in this article. No information accessed through the Investing Caffeine (IC) website constitutes investment, financial, legal, tax or other advice nor is to be relied on in making an investment or other decision. Please read disclosure language on IC “Contact” page.
The Fed: Myths vs. Reality

Traders, bloggers, media talking heads, and pundits of all stripes went into a feverish sweat as they anticipated the comments of Federal Reserve Chairman Janet Yellen at the annual economic summit held in Jackson Hole, Wyoming. When Yellen, arguably the most dovish Fed Chairman in history, uttered, “I believe the case for an increase in the federal funds rate has strengthened in recent months,” an endless stream of commentators used this opportunity to spout out a never-ending stream of predictions describing the looming consequences of such a potential rate increase.
As I’ve stated before, the Fed receives both too much blame and too much credit for basically doing nothing except moving short-term interest rates up or down (and most of the time they do nothing). However, until the next Fed meeting in September (or later), we all will be placed in purgatory with non-stop speculation regarding the timing of the next rate increase.
The ludicrous and myopic analysis can be encapsulated by the recent article written by Pulitzer Prize-winning Fed writer Jon Hilsenrath, in his piece titled, The Great Unraveling: Fed Missteps Fueled 2016 Populist Revolt. Somehow, Hilsenrath is making the case that a group of 12 older, white people that meet eight times per year in Washington to discuss interest rate policy based on inflation and employment trends has singlehandedly created income inequality, and a populist movement leading to the rise of Donald Trump and Bernie Sanders.
While this Fed scapegoat explanation is quite convenient for the doom-and-gloomers (see The Fed Ate My Homework), it is way off base. I hate to break it to Mr. Hilsenrath, or other conspiracy theorists and perma-bears, but blaming a small group of boring bankers is an overly-simplistic “straw man” argument that does not address the infinite number of other factors contributing to our nation’s social and economic problems.
Ever since the bull market began in 2009, a pervasive skepticism and mistrust have kept the bull market climbing a wall of worry to all-time record levels. In the process, Hilsenrath et. al. have proliferated an inexhaustible list of myths about the Fed and its powers. Here are some of them:
Myth #1: The printing of money by the Fed has led to an artificially inflated stock market bubble and Ponzi Scheme.
- As stock prices have more than tripled over the last eight years to record levels, I’ve reveled in the hypocrisy of the “money printers” contention. First of all, the money printing derived from Quantitative Easing (QE) was originally cited as the sole reason for low, declining interest rates and the rising stock market. The money printing community vociferously predicted once QE ended, as it eventually did in 2014, interest rates would explode higher and stock market prices would collapse. What happened? The exact opposite occurred. Interest rates have gone to record low levels, and stock prices have advanced to all-time record highs.
Myth #2: The Fed controls all interest rates.
- Yes, the Fed can influence short-term interest rates through bond purchases and the targeting of the Federal Funds rate. However, the Fed has little-to-no influence on longer-term interest rates. The massive global bond market dwarfs the size of the Fed and U.S. stock market, and as such, large global financial institutions, pensions, hedge funds, and millions of other investors around the world have more influence on longer-term interest rates. The relationship between the 10-Year Treasury Note yield and the Fed’s monetary policy is loose at best.
Myth #3: The stock market will crash when the Fed raises interest rates.
- Well, we can see that logic is already wrong because the stock market is up significantly since the Fed raised interest rates in mid-December 2015. It is true that additional interest rate hikes are likely to occur in our future, but that does not necessarily mean stock prices are going to plummet. Commentators and bloggers are already panicking about a potential rate hike in September. Before you go jump out a window, let’s put this potential rate hike into context. For starters, let’s not forget the “dove of all doves,” Janet Yellen, is in charge and there has only been one rate increase 0f 0.25% over the last decade. As I point out in one of my previous articles (see Fed Fatigue), stock prices increased during the last rate hike cycle (2004 – 2006) when the Fed raised interest rates from 1.0% to 5.25% (the equivalent of another 16 rate hikes of 0.25%). The world didn’t end in 1994 either, when the Fed Funds rate increased from 3% to 6% over a short time frame, and stocks finished roughly flat for the period. Inflation levels remain at relatively low levels, and the Fed has moved less than 10% of recent hike cycles, so now is not the time to panic. Regardless of what the fear mongers say, the Fed and the bull market fairy godmother (Janet Yellen) will be measured and deliberate in its policies and will verify that any policy action is made into a healthy, strengthening economy.
Myth #4: Stimulative monetary policies instituted by the Fed and other central banks will lead to hyperinflation.
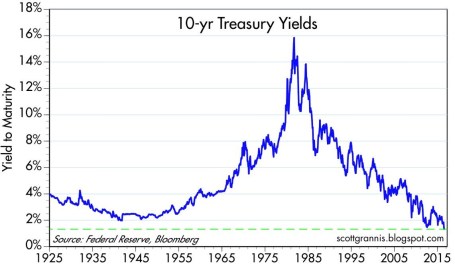
- Japan has done QE for decades, and QE efforts in the U.S. and Europe have also disproved the hyperinflation myth. While commentators, pundits, and journalists like to all point and blame Janet Yellen and the Fed for today’s so-called artificially low interest rates, one does not need to be a genius to realize there are other factors contributing to low rates and inflation. Declining interest rates and inflation are nothing new…this has been going on for over 35 years! (see chart below) As I have discussed previously the larger contributors to declining interest rates and disinflation are technology, globalization, and emerging markets (see Why 0% Interest Rates?). By next year, over one-third of the world’s population is expected to own a smartphone (2.6 billion people), the equivalent of a supercomputer in the palm of their hands. Mobile communication, robotics, self-driving cars, virtual & augmented reality, drones, artificial intelligence, drones, biotechnology, and other technologies are dramatically impacting productivity (i.e., downward pressure on prices and interest rates). These advancements, combined with the billions of low-priced workers in emerging markets, who are lifting themselves out of poverty, are contributing to the declining rate/inflation trend.
Source: Calafia Beach Pundit
As the next Fed meeting approaches, there is no doubt the airwaves and internet will be filled with alarmist calls from the likes of Jon Hilsenrath and other Fed-haters. Fortunately, more informed financial market observers will be able to filter out this noise and be able to separate out the many Fed and interest rate myths from the reality.
Wade W. Slome, CFA, CFP®
Plan. Invest. Prosper.
DISCLOSURE: Sidoxia Capital Management (SCM) and some of its clients hold positions in certain exchange traded funds (ETFs), but at the time of publishing had no direct position in any other security referenced in this article. No information accessed through the Investing Caffeine (IC) website constitutes investment, financial, legal, tax or other advice nor is to be relied on in making an investment or other decision. Please read disclosure language on IC Contact page.
Dying Unicorns

Historically, when people speak about unicorns they are referring to those magical white horses with long horns sprouting from their foreheads. Today, in Silicon Valley and on Wall Street, “unicorns” refer to those private companies valued at more than $1 billion. The current list of unicorns is extensive, including household names like money-losing Uber ($51.0 billion valuation), Airbnb ($25.5 billion), SnapChat ($15.3 billion), and about 150 other money-losing companies with a combined valuation of approximately a half trillion dollars (see list here). Just like the mythical unicorns we imagine and read about in fairy tales, Silicon Valley unicorns are at risk of dying off and becoming a myth as well.
Square at the Heart of the Problem
Following young technology start-ups with names like, Box, Dropbox, and Square can become quite confusing, but investors are becoming less confused about their desire for profits and fair valuations. The recent –33% discount in the planned pre-IPO offering price of Square shares to $11 – $13 ($4 billion) from the last private funding valuation of $15.46 ($6 billion) is signaling the deteriorating health of money-losing unicorns.
Adding insult to injury, money-losing Square provided recent private investors with a controversial “ratchet” clause, which essentially gives privileged investors additional shares, if the IPO (Initial Public Offering) price does not occur at a minimum set price. The net result is a fraction of advantaged investors receive a disproportionate percentage of the company’s value, while a majority of the other investors see their ownership value diluted. According to Forbes, approximately 30% of unicorns carry some contentious ratchet provisions, which may make IPO exits for these companies that much more difficult.
The recent Square news comes on the heels of other unicorns like Dropbox seeing its pre-IPO value being reduced by -24% from industry giant BlackRock Inc (BLK), an early Dropbox investor. According to the Wall Street Journal¸ bankers close to the company admitted achieving a pre-IPO valuation of $10 billion will be challenging. Subsequently, mutual fund behemoth Fidelity wrote down the value of social media, photo disappearing, mobile application company, Snapchat, by -25%.
Unfortunately, the problems for unicorn companies don’t stop after the IPO. Take for example, Fitbit Inc (FIT), the newly minted $6 billion IPO, which took place in June. Even though the wearable technology company may no longer be a unicorn, the -31% decline in its share price during the first half of November is evidence there are consequences to insiders dumping additional over-priced (or high-priced) shares on investors. Of the planned 17 million secondary share sale, the vast majority of the proceeds (14 million shares) are going to insiders who are taking the money and running, thereby leaving the company itself with a much smaller portion of the offering dollars.
Veteran investors have seen this movie before during the late 1990s tech bubble, and investors know that this type of movie ends very badly. As in any bubble, if you are able to participate early enough during the inflation process, it can be a spectacular ride before the bubble bursts. Unicorn companies can sell a dream for a while, but profitless prosperity cannot last forever. Eventually, profits and cash flows do become important for investors. And for some unicorn companies, the day of reckoning appears to have arrived now. It has been a fun, fairy tale ride for unicorn investors up until now, but with a half trillion dollars in unicorn investments beginning to die off, these early stage companies will need a steadier diet of profits to stay alive.
Wade W. Slome, CFA, CFP®
Plan. Invest. Prosper.
DISCLOSURE: Sidoxia Capital Management (SCM) and some of its clients hold positions in certain exchange traded funds (ETFs), but at the time of publishing, SCM had no direct position in Uber, Airbnb, SnapChat, Box, Dropbox, Square, BLK, FIT and any other security referenced in this article. No information accessed through the Investing Caffeine (IC) website constitutes investment, financial, legal, tax or other advice nor is to be relied on in making an investment or other decision. Please read disclosure language on IC Contact page.
NASDAQ Redux

The NASDAQ Composite index once again crossed the psychologically, all-important 5,000 threshold this week for the first time since the infamous tech-bubble burst in the year 2000. Of course, naturally, the media jumped on a non-stop, multi-day offensive comparing and contrasting today’s NASDAQ vs. the NASDAQ twin of yesteryear. Rather than rehash the discussion once again, I have decided to post three articles I published in recent years on the topic covering the outperformance of the spotlighted, tech-heavy index.
NASDAQ 5,000 Irrational Exuberance Déjà Vu?

Investors love round numbers and with the Dow Jones Industrial index recently piercing 17,000 and the S&P 500 index having broken 2,000 , even novice investors have something to talk about around the office water cooler. While new all-time records are being set for the major indices during September, the unsung, tech-laden NASDAQ index has yet to surpass its all-time high of 5,132 achieved 14 and ½ years ago during March of 2000.
Click Here to Read the Rest of the Article
NASDAQ and the R&D Tech Revolution

It’s been a bumpy start for stocks so far in 2014, but the fact of the matter is the NASDAQ Composite Index is up this year and hit a 14-year high in the latest trading session (highest level since 2000). The same cannot be said for the Dow Jones Industrial and S&P 500 indices, which are both lagging and down for the year. Not only did the NASDAQ outperform the Dow by almost +12% in 2013, but the NASDAQ has also trounced the Dow by over +70% over the last five years.
Click Here to Read the Rest of the Article
NASDAQ: The Ugly Stepchild

All the recent media focus has been fixated on whether the Dow Jones Industrial Average index (“The Dow”) will close above the 13,000 level. In the whole scheme of things, this specific value doesn’t mean a whole lot, but it does make for a great topic of conversation at a cocktail party. Today, the Dow is trading at 12,983, a level not achieved in more than three and a half years. Not a bad accomplishment, given the historic financial crisis on our shores and the debacle going on overseas, but I’m still not so convinced a miniscule +0.1% move in the Dow means much. While the Dow and the S&P 500 indexes garner the hearts and minds of journalists and TV reporters, the ugly stepchild index, the NASDAQ, gets about as much respect as Rodney Dangerfield (see also No Respect in the Investment World).
Click Here to Read the Rest of the Article

Wade W. Slome, CFA, CFP®
Plan. Invest. Prosper.
DISCLOSURE: Sidoxia Capital Management (SCM) and some of its clients hold positions in certain exchange traded funds (ETFs) , but at the time of publishing, SCM had no direct position in any other security referenced in this article. No information accessed through the Investing Caffeine (IC) website constitutes investment, financial, legal, tax or other advice nor is to be relied on in making an investment or other decision. Please read disclosure language on IC Contact page.