Posts tagged ‘spreads’
Sports, Stocks, & the Magic Quadrants
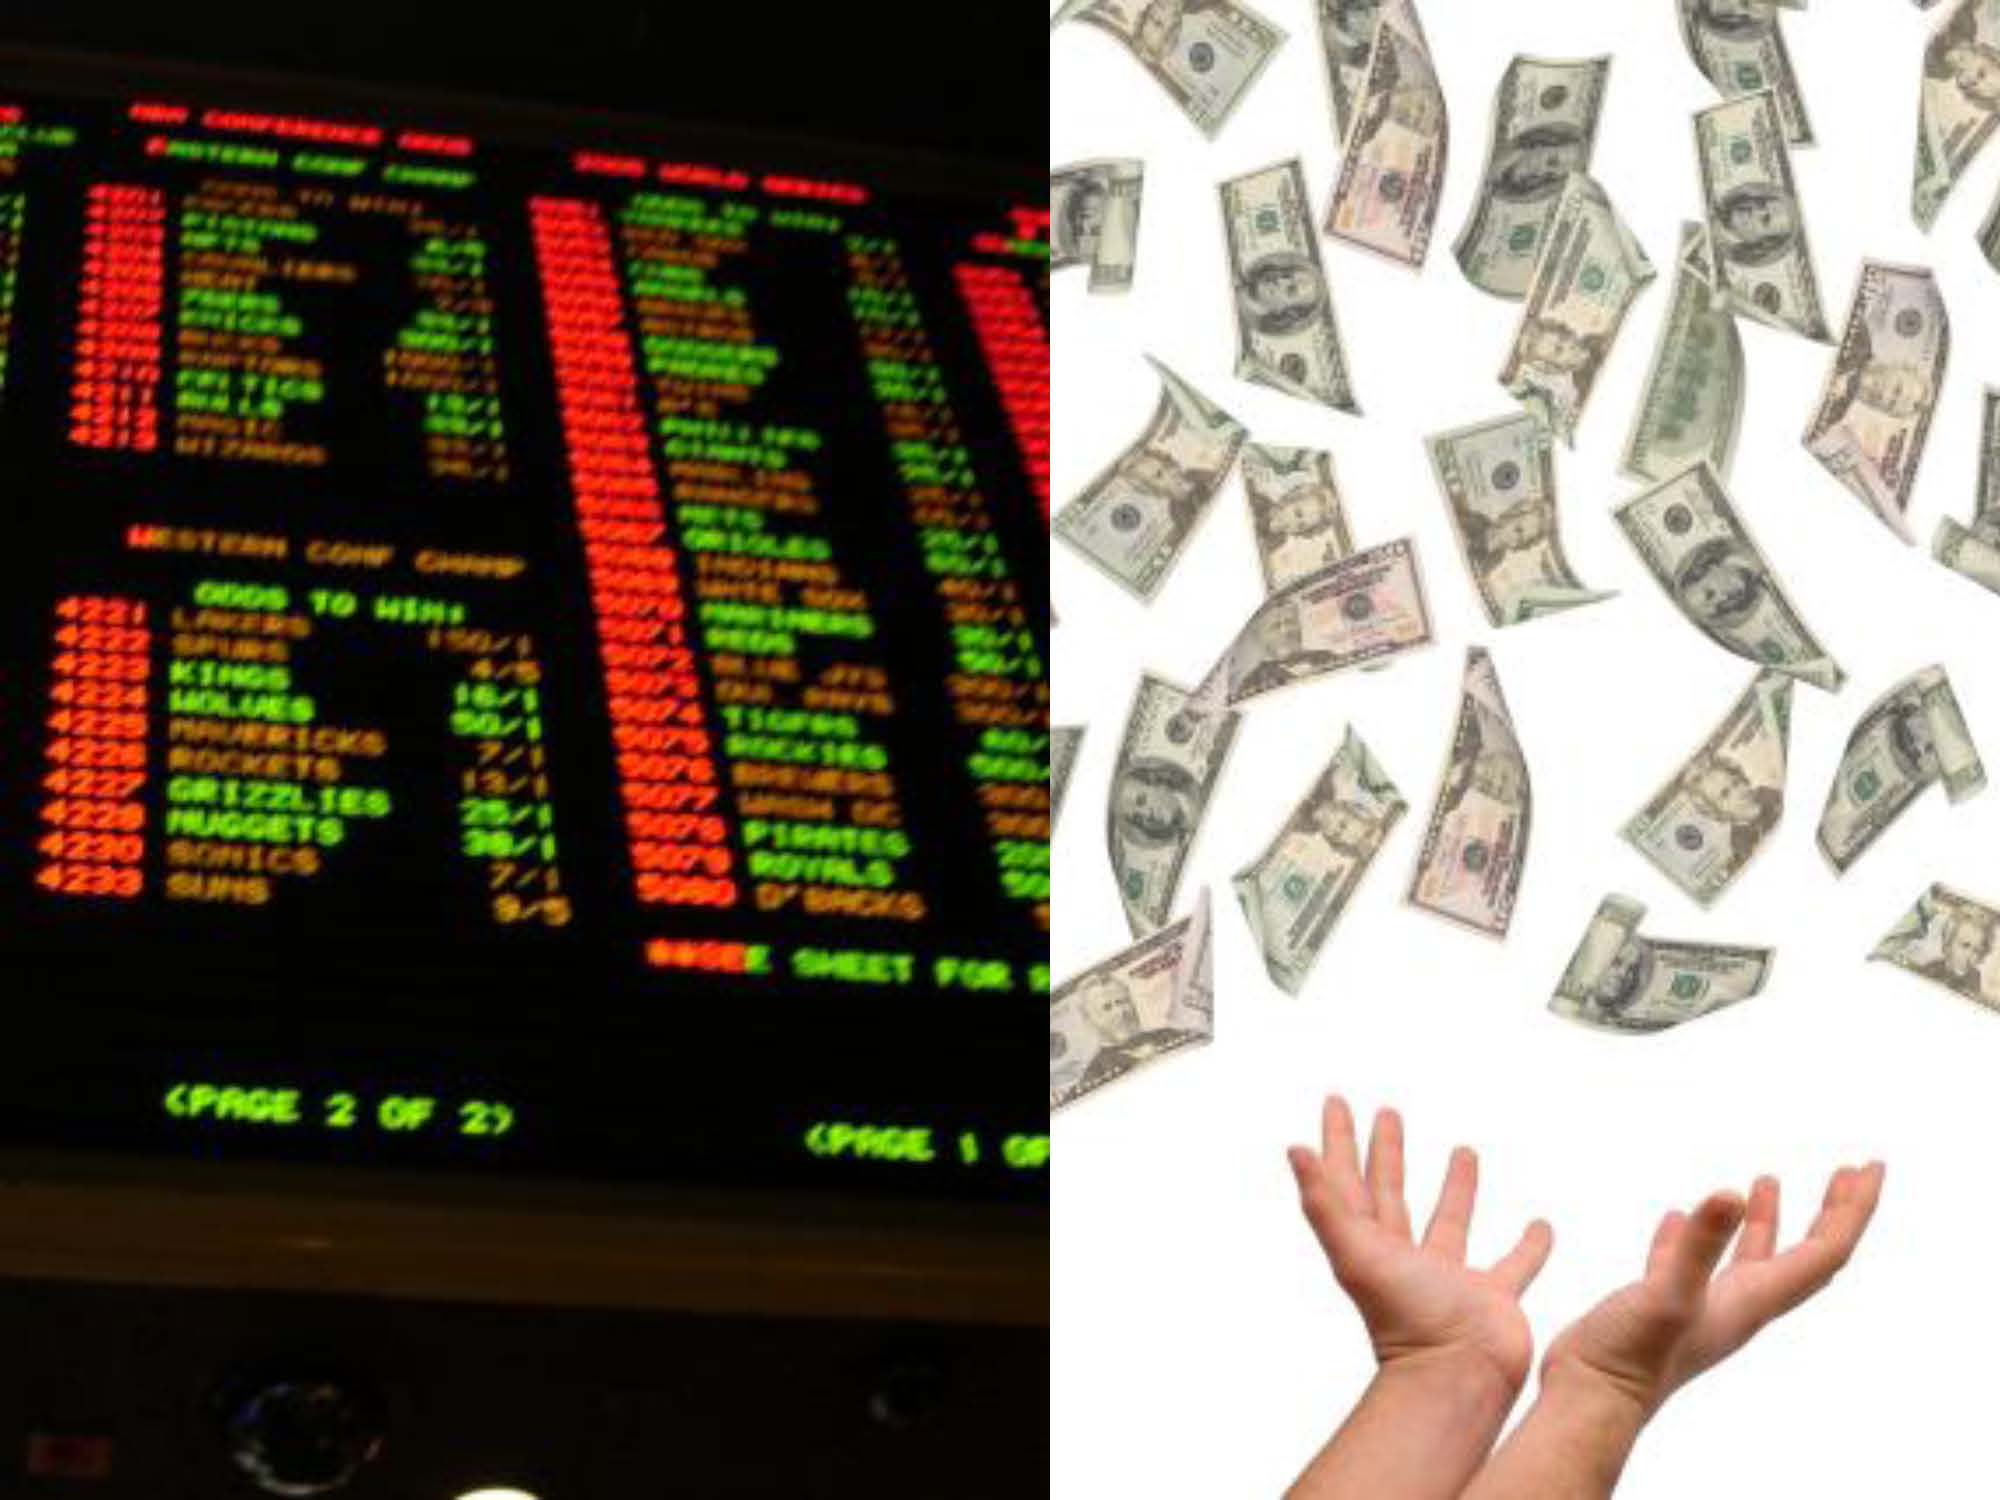
Picking stocks is a tricky game and so is sports betting. With the NFL and NCAA football seasons only a few months away, we can analyze the professional sports-betting industry to better understand the complexities behind making money in the stock market. Anybody who has traveled to Las Vegas, and bet on a sporting event, understands that simply choosing a game winner is not enough for a casino to pay you winnings. You also need to forecast how many points you think a certain team will win or lose by (i.e., the so-called “spread”) – see also What Happens in Vegas, Stays on Wall Street. In the world of stocks, winning/losing is not measured by spreads but rather equities are measured by valuation (e.g., Price/Earnings or P/E ratios).
To make my point, here is a sports betting example from some years back:
Florida Gators vs. Charleston Southern Buccaneers: Without knowing a lot about the powerhouse Southern Buccaneers squad from South Carolina, 99% of respondents polled before the game are likely to unanimously select the winner as Florida – a consistently dominant, nationally ranked powerhouse program. The tougher question becomes trickier if football observers are asked, “Will the Florida Gators win by more than 63 points?”(see picture below). Needless to say, although the Buccs kept it close in the first half, and only trailed by 42-3 at halftime, the Gators still managed to squeak by with a 62-3 victory. Importantly, if you had bet on this game and placed money on the Florida Gators, the overwhelming pre-game favorite, the 59 point margin of victory would have resulted in a losing wager. In order for Gator fans to win money, they would have needed Florida to win by 64 points.

If investing and sports betting were easy, everybody would do it. The reason sports betting is so challenging is due to very intelligent statisticians and odds-makers that create very accurate point spreads. In the investing world, a broad swath of traders, market makers, speculators, investment bankers, and institutional/individual investors set equally efficient valuations over the long-term.
The goal in investing is very similar to sports betting. Successful professionals in both industries are able to consistently identify inefficiencies and then exploit them. Inefficiencies occur for a bettor when point spreads are too high or low, while investors identify inefficient prices in the marketplace by shorting expensive stocks and buying cheap stocks (i.e., undervalued or overvalued).
To illustrate my point, let’s take a look at Sidoxia’s “Magic Quadrant“:
 A-B-Cs & 1-2-3s
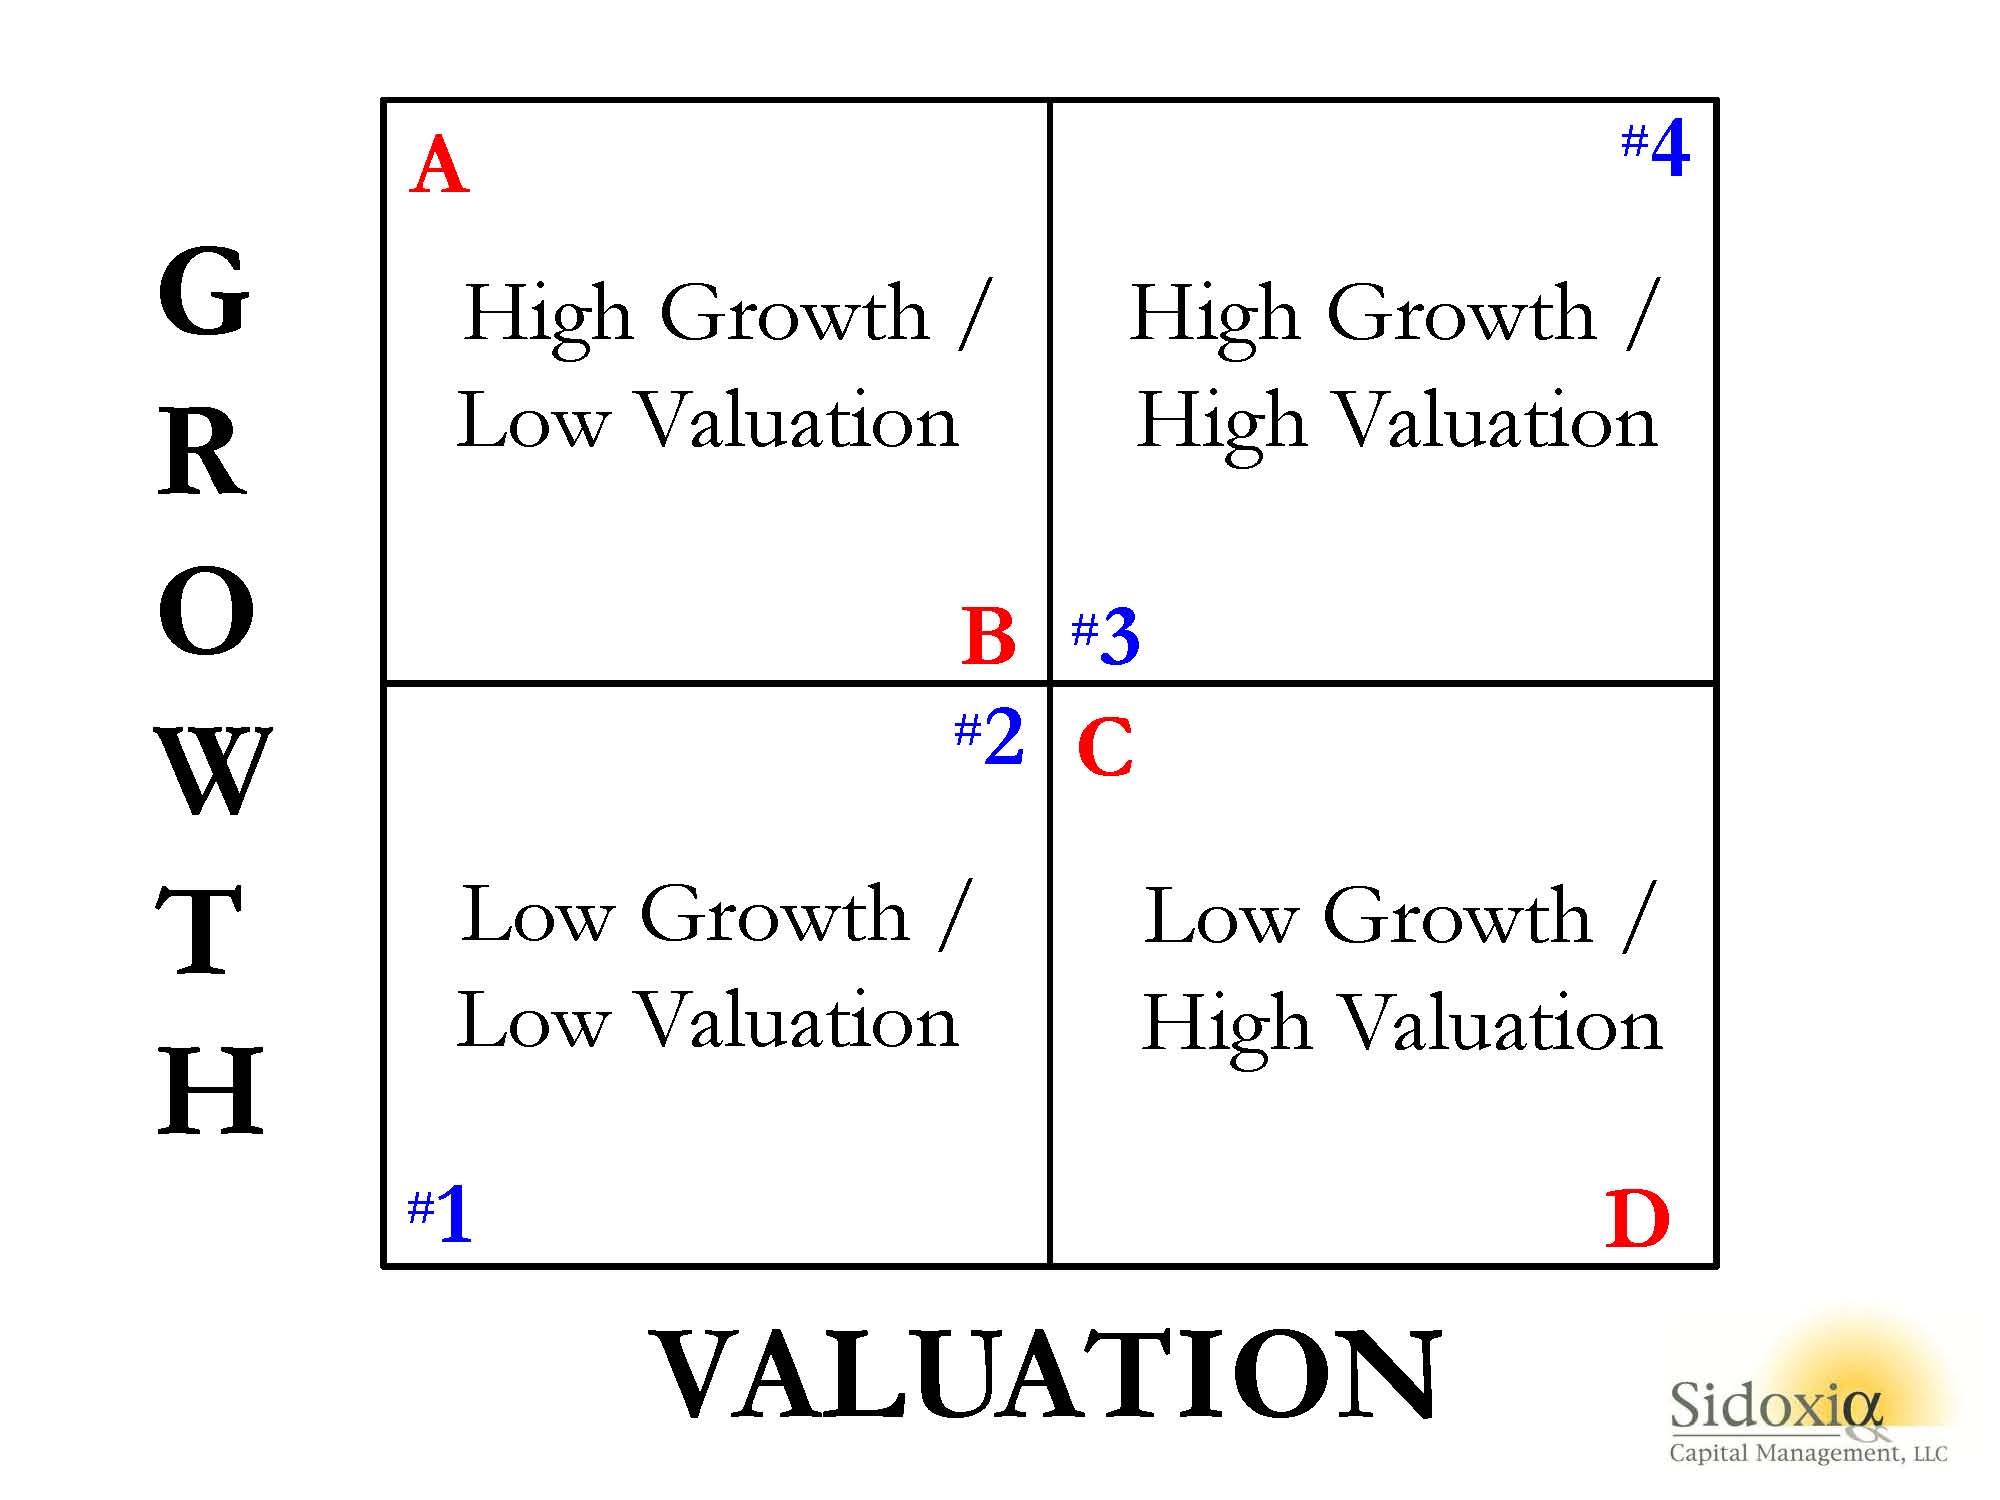
What Sidoxia’s “Magic Quadrant” demonstrates is a framework for evaluating stocks. By devoting a short period of time reviewing the quadrants, it becomes apparent fairly quickly that Stock A is preferred over Stock B, which is preferred over Stock C, which is preferred over Stock D. In each comparison, the former is preferred over the latter because the earlier letters all have higher growth, and lower (cheaper) valuations. The same relative attractive relationships cannot be applied to stocks #1, #2, #3, and #4. Each successive numbered stock has higher growth, but in order to obtain that higher growth, investors must pay a higher valuation. In other words, Stock #1 has an extremely low valuation with low growth, while Stock #4 has high growth, but an investor must pay an extremely high valuation to own it.
While debating the efficiency of the stock market can escalate into a religious argument, I would argue the majority of stocks fall in the camp of #1, #2, #3, or #4. Or stated differently, you get what you pay for. For example, investors are paying a much higher valuation (high P/E) for Tesla Motors, Inc (TSLA) for its rapid electric car growth vs. paying a much lower valuation (low P/E) for Pitney Bowes Inc (PBI) for its more mature mail equipment business.
The real opportunities occur for those investors capable of identifying companies in the upper-left quadrant (i.e., Stock A) and lower-right quadrant (i.e., Stock D). If the analysis is done correctly, investors will load up on the undervalued Stock A and aggressively short the expensive Stock D. Sidoxia has its own proprietary valuation model (Sidoxia Holy Grail Ranking – SHGR or a.k.a. “SUGAR”) designed specifically to identify these profitable opportunities.
The professions of investing and sports betting are extremely challenging, however establishing a framework like Sidoxia’s “Magic Quadrants” can help guide you to find inefficient and profitable investment opportunities.

Wade W. Slome, CFA, CFP®
Plan. Invest. Prosper.
DISCLOSURE: Sidoxia Capital Management (SCM) and some of its clients hold positions in certain exchange traded funds (ETFs) and TSLA, but at the time of publishing, SCM had no direct position in PBI, or any other security referenced in this article. No information accessed through the Investing Caffeine (IC) website constitutes investment, financial, legal, tax or other advice nor is the information to be relied on in making an investment or other decision. Please read disclosure language on IC Contact page.
Lewis Sells Flash Boys Snake Oil

I know what you’re saying, “Please, not another article on Michael Lewis’s Flash Boys book and high frequency trading (HFT),” but I can’t resist putting in my two cents after the well-known author emphatically proclaimed the stock market as “rigged.” Lewis is not alone with his outrageous claims… Clark Stanley (“The Rattlesnake King”) made equally outlandish claims in the early 1900s when he sold lucrative Snake Oil Liniment to heal the ailments of the masses. Ultimately Stanley’s assets were seized by the government and the healing assertions of his snake oil were proven fraudulent. Like Stanley, Lewis’s over-the-top comments about HFT traders are now being scrutinized under a microscope by more thoughtful critics than Steve Kroft from 60 Minutes (see television profile). For a more detailed counterpoint, see the Reuters interview with Manoj Narang (Tradeworx) and Haim Bodek (Decimus Capital Markets).
While Lewis may not be selling snake oil, the cash register is still ringing with book sales until the real truth is disseminated. In the meantime, Lewis continues to laugh to the bank as he makes misleading and deceptive claims, just like his snake oil selling predecessors.
The Inside Perspective
Regardless of what side of the fence you fall on, the debate created by Lewis’s book has created deafening controversy. Joining the jihad against HFT is industry veteran Charles Schwab, who distributed a press release calling HFT a “growing cancer” and stating the following:
“High-frequency trading has run amok and is corrupting our capital market system by creating an unleveled playing field for individual investors and driving the wrong incentives for our commodity and equities exchanges.”
What Charles Schwab doesn’t admit is that their firm is receiving about $100 million in annual revenues to direct Schwab client orders to the same HFT traders at exchanges in so called “payment-for-order-flow” contracts. Another term to describe this practice would be “kick-backs”.
While Michael Lewis screams bloody murder over investors getting fraudulently skimmed, some other industry legends, including the godfather of index funds, Vanguard founder Jack Bogle, argue that Lewis’s views are too extreme. Bogle reasons, “Main Street is the great beneficiary…We are better off with high-frequency trading than we are without it.”
Like Jack Bogle, other investors who should be pointing the finger at HFT traders are instead patting them on the back. Cliff Asness, managing and founding principal of AQR Capital Management, an institutional investment firm managing about $100 billion in assets, had this to say about HFT in his Wall Street Journal Op-Ed:
“How do we feel about high-frequency trading? We think it helps us. It seems to have reduced our costs and may enable us to manage more investment dollars… on the whole high-frequency traders have lowered costs.”
Is HFT Good for Main Street?
Many investors today have already forgotten, or were too young to remember, that stocks used to be priced in fractions before technology narrowed spreads to decimal points in the 1990s. Who has benefited from all this technology? You guessed it…everyone.
Lewis makes the case that the case that all investors are negatively impacted by HFT, including Main Street (individual) investors. Asness maintains costs have been significantly lowered for individual investors:
“For the first time in history, Main Street might have it rigged against Wall Street.”
In Flash Boys, Lewis claims HFT traders unscrupulously scalp pennies per share from retail investor pockets by using privileged information to jump in front of ordinary investors (“front-run”). The reality, even if you believe Lewis’s contentions are true, is that technology has turned any perceived detrimental penny-sized skimming scheme into beneficial bucks for ordinary investors. For example, trades that used to cost $40, $50, $100, or more per transaction at the large wirehouse brokerage firms can today be purchased at discount brokerage firms for $7 or less. What’s more, the spread (i.e., the profits available for middlemen) used to be measured in increments of 1/8, 1/4, and 1/2 , when today the spreads are measured in pennies or fractions of pennies. Without any rational explanation, Lewis also dismisses the fact that HFT traders add valuable liquidity to the market. His argument of adding “volume and not liquidity” would make sense if HFT traders only transacted solely with other HFT traders, but that is obviously not the case.
Regardless, as you can see from the chart below, the trend in spreads over the last decade or so has been on a steady, downward, investor-friendly slope.

Source: Business Insider
How Did We Get Here? And What’s Wrong with HFT?
Similarly to our country’s 73,954 page I.R.S. tax code, the complexity of our financial market trading structure rivals that of our government’s money collection system. The painting of all HFT traders as villains by Lewis is no truer than painting all taxpayers as crooks. Just as there are plenty of crooked and deceitful individuals that push the boundaries of our income tax system, so too are there traders that try to take advantage of an inefficient, Byzantine exchange system. The mere presence of some tax dodgers doesn’t mean that all taxpayers should go to jail, nor should all HFT traders be crucified by the SEC (Securities and Exchange Commission) police.
The heightened convoluted nature to our country’s exchange-based financial system can be traced back to the establishment of Regulation NMS, which was passed by the SEC in 2005 and implemented in 2007. The aim of this regulatory structure was designed to level the playing field through fairer trade execution and the creation of equal access to transparent price quotations. However, rather than leveling the playing field, the government destroyed the playing field and fragmented it into many convoluted pieces (i.e., exchanges) – see Wall Street Journal article and chart below.

Source: Wall Street Journal
The new Reg NMS competition came in the form of exchanges like BATS and Direct Edge (now merging), but the new multi-faceted structures introduced fresh loopholes for HFT traders to exploit – for both themselves and investors. More specifically, HFT traders used expensive, lightning-fast fiber optic cables; privileged access to data centers physically located adjacent to trading exchanges; and then they integrated algorithmic software code to efficiently route orders for best execution.
Are many of these HFT traders and software programs attempting to anticipate market direction? Certainly. As the WSJ excerpt below explains, these traders are shrewdly putting their capitalist genes to the profit-making test:
Computerized firms called high-frequency traders try to pick up clues about what the big players are doing through techniques such as repeatedly placing and instantly canceling thousands of stock orders to detect demand. If such a firm’s algorithm detects that a mutual fund is loading up on a certain stock, the firm’s computers may decide the stock is worth more and can rush to buy it first. That process can make the purchase costlier for the mutual fund.
Like any highly profitable business, success eventually attracts competition, and that is exactly what has happened with high frequency trading. To appreciate this fact, all one need to do is look at Goldman Sachs’s actions, which is to leave the NYSE (New York Stock Exchange), shutter its HFT dark pool trading platform (Sigma X), and join IEX, the dark pool created by Brad Katsuyama, the hero placed on a pedestal by Lewis in Flash Boys. Goldman is putting on their “we’re doing what’s best for investors” face on, but more experienced veterans understand that Goldman and all the other HFT traders are mostly just greedy S.O.B.s looking out for their best interests. The calculus is straightforward: As costs of implementing HFT have plummeted, the profit potential has dried up, and the remaining competitors have been left to fend for their Darwinian survival. The TABB Group, a financial markets’ research and consulting firm, estimates that US equity HFT revenues have declined from approximately $7.2 billion in 2009 to about $1.3 billion in 2014. As costs for co-locating HFT hardware next to an exchange have plummeted from millions of dollars to as low as $1,000 per month, the HFT market has opened their doors to anyone with a checkbook, programmer, and a pulse. That wasn’t the case a handful of years ago.
The Fixes
Admittedly, not everything is hearts and flowers in HFT land. The Flash Crash of 2010 highlighted how fragmented, convoluted, and opaque our market system has become since Reg NMS was implemented. And although “circuit breaker” remedies have helped prevent a replicated occurrence, there is still room for improvement.
What are some of the solutions? Here are a few ideas:
- Reform complicated Reg NMS rules – competition is good, complexity is not.
- Overhaul disclosure around “payment-for-order-flow” contracts (rebates), so potential conflicts of interest can be exposed.
- Stop inefficient wasteful “quote stuffing” practices by HFT traders.
- Speed up and improve the quality of the SIP (Security Information Processor), so the gaps between SIP and the direct feed data from exchanges are minimized.
- Improve tracking and transparency, which can weed out shady players and lower probabilities of another Flash Crash-like event.
These shortcomings of HFT trading do not mean the market is “rigged”, but like our overwhelmingly complex tax system, there is plenty of room for improvement. Another pet peeve of mine is Lewis’s infatuation with stocks. If he really thinks the stock market is rigged, then he should write his next book on the less efficient markets of bonds, futures, and other over-the-counter derivatives. This is much more fertile ground for corruption.
As a former manager of a $20 billion fund, I understand the complications firsthand faced by large institutional investors. In an ever-changing game of cat and mouse, investors of all sizes will continue looking to execute trades at the best prices (lowest possible purchase and highest possible sales price), while middlemen traders will persist with their ambition to exploit the spread (generate profits between the bid and ask prices). Improvements in technology will always afford a temporary advantage for a few, but in the long-run the benefits for all investors have been undeniable. The same undeniable benefits can’t be said for reading Michael Lewis’s Flash Boys. Like Clark Stanley and other snake oil salesmen before him, it will only take time for the real truth to come out about Lewis’s “rigged” stock market claims.
Wade W. Slome, CFA, CFP®
Plan. Invest. Prosper.
DISCLOSURE: Sidoxia Capital Management (SCM) and some of its clients hold long positions in certain exchange traded funds (ETFs), but at the time of publishing SCM had no direct position in GS, SCHW, ICE, or any other security referenced in this article. No information accessed through the Investing Caffeine (IC) website constitutes investment, financial, legal, tax or other advice nor is to be relied on in making an investment or other decision. Please read disclosure language on IC Contact page.
Sports, Stocks, & the Magic Quadrants
Picking stocks is a tricky game and so is sports betting. With the NFL and NCAA football seasons swinging into full gear, understanding the complexity of making money in the stock market can be explained in terms of professional sports-betting. Anybody who has traveled to Las Vegas and bet on a sporting event, understands that choosing a winner of a game simply is not enough…you also need to forecast how many points you think a certain team will win by (see also What Happens in Vegas, Stays on Wall Street). In the world of sports, winning/losing is measured by point spreads. In the world of stocks, winning/losing is measured by valuation (e.g., Price/Earnings ratios).
To make my point, here is a sports betting example from a handful years back:
Florida Gators vs. Charleston Southern Buccaneers (September 2009): Without knowing a lot about the powerhouse Southern Buccaneers squad from South Carolina, 99% of respondents, when asked before the game who would win, would unanimously select Florida – a consistently dominant, national franchise, powerhouse program. The question becomes a little trickier when participants are asked, “Will the Florida Gators win by more than 63 points?” Needless to say, although the Buccs kept it close in the first half, and only trailed by 42-3 at halftime, the Gators still managed to squeak by with a 62-3 victory. Worth noting, had you selected Florida, the overwhelming favorite, the 59 point margin of victory would have resulted in a losing wager (see picture below).
If investing and sports betting were easy, everybody would do it. The reason sports betting is so challenging is due to very intelligent statisticians and odds-makers that create very accurate point spreads. In the investing world, a broad swath of traders, market makers, speculators, investment bankers, and institutional/individual investors set equally efficient valuations.
The goal in investing is very similar to sports betting. Successful professionals in both industries are able to consistently identify inefficiencies and then exploit them. Inefficiencies occur for a bettor when point spreads are too high or low, while investors identify inefficient prices in the marketplace (undervalued or overvalued).
To illustrate my point, let’s take a look at Sidoxia’s “Magic Quadrant“:
A-B-Cs & 1-2-3s
What Sidoxia’s “Magic Quadrant” demonstrates is a framework for evaluating stocks. By devoting a short period of time reviewing the quadrants, it becomes apparent fairly quickly that Stock A is preferred over Stock B, which is preferred over Stock C, which is preferred over Stock D. In each comparison, the former is preferred over the latter because the earlier letters all have higher growth, and lower (cheaper) valuations. The same relative attractive relationships cannot be applied to stocks #1, #2, #3, and #4. Each successive numbered stock has higher growth, but in order to obtain that higher growth, investors must pay a higher valuation. In other words, Stock #1 has an extremely low valuation with low growth, while Stock #4 has high growth, but an investor must pay an extremely high valuation to own it.
While debating the efficiency of the stock market can escalate into a religious argument, I would argue the majority of stocks fall in the camp of #1, #2, #3, or #4. Or stated differently, you get what you pay for. For example, investors are paying a much higher valuation (~100x 2014 P/E) for Tesla Motors, Inc (TSLA) for its rapid electric car growth vs. paying a much lower valuation (~10x 2014 P/E) for Pitney Bowes Inc (PBI) for its mature mail equipment business.
The real opportunities occur for those investors capable of identifying companies in the upper-left quadrant (i.e., Stock A) and lower-right quadrant (i.e., Stock D). If the analysis is done correctly, investors will load up on the undervalued Stock A and aggressively short the expensive Stock D. Sidoxia has its own proprietary valuation model (Sidoxia Holy Grail Ranking – SHGR or a.k.a. “SUGAR”) designed specifically to identify these profitable opportunities.
The professions of investing and sports betting are extremely challenging, however establishing a framework like Sidoxia’s “Magic Quadrants” can help guide you to find inefficient and profitable investment opportunities.
Wade W. Slome, CFA, CFP®
Plan. Invest. Prosper.
DISCLOSURE: Sidoxia Capital Management (SCM) and some of its clients hold positions in certain exchange traded funds (ETFs), but at the time of publishing, SCM had no direct position in TSLA, PBI, or any other security referenced in this article. No information accessed through the Investing Caffeine (IC) website constitutes investment, financial, legal, tax or other advice nor is the information to be relied on in making an investment or other decision. Please read disclosure language on IC Contact page.


