Posts tagged ‘sports betting’
Sports, Stocks, & the Magic Quadrants

Picking stocks is a tricky game and so is sports betting. With the NFL and NCAA football seasons only a few months away, we can analyze the professional sports-betting industry to better understand the complexities behind making money in the stock market. Anybody who has traveled to Las Vegas, and bet on a sporting event, understands that simply choosing a game winner is not enough for a casino to pay you winnings. You also need to forecast how many points you think a certain team will win or lose by (i.e., the so-called “spread”) – see also What Happens in Vegas, Stays on Wall Street. In the world of stocks, winning/losing is not measured by spreads but rather equities are measured by valuation (e.g., Price/Earnings or P/E ratios).
To make my point, here is a sports betting example from some years back:
Florida Gators vs. Charleston Southern Buccaneers: Without knowing a lot about the powerhouse Southern Buccaneers squad from South Carolina, 99% of respondents polled before the game are likely to unanimously select the winner as Florida – a consistently dominant, nationally ranked powerhouse program. The tougher question becomes trickier if football observers are asked, “Will the Florida Gators win by more than 63 points?”(see picture below). Needless to say, although the Buccs kept it close in the first half, and only trailed by 42-3 at halftime, the Gators still managed to squeak by with a 62-3 victory. Importantly, if you had bet on this game and placed money on the Florida Gators, the overwhelming pre-game favorite, the 59 point margin of victory would have resulted in a losing wager. In order for Gator fans to win money, they would have needed Florida to win by 64 points.

If investing and sports betting were easy, everybody would do it. The reason sports betting is so challenging is due to very intelligent statisticians and odds-makers that create very accurate point spreads. In the investing world, a broad swath of traders, market makers, speculators, investment bankers, and institutional/individual investors set equally efficient valuations over the long-term.
The goal in investing is very similar to sports betting. Successful professionals in both industries are able to consistently identify inefficiencies and then exploit them. Inefficiencies occur for a bettor when point spreads are too high or low, while investors identify inefficient prices in the marketplace by shorting expensive stocks and buying cheap stocks (i.e., undervalued or overvalued).
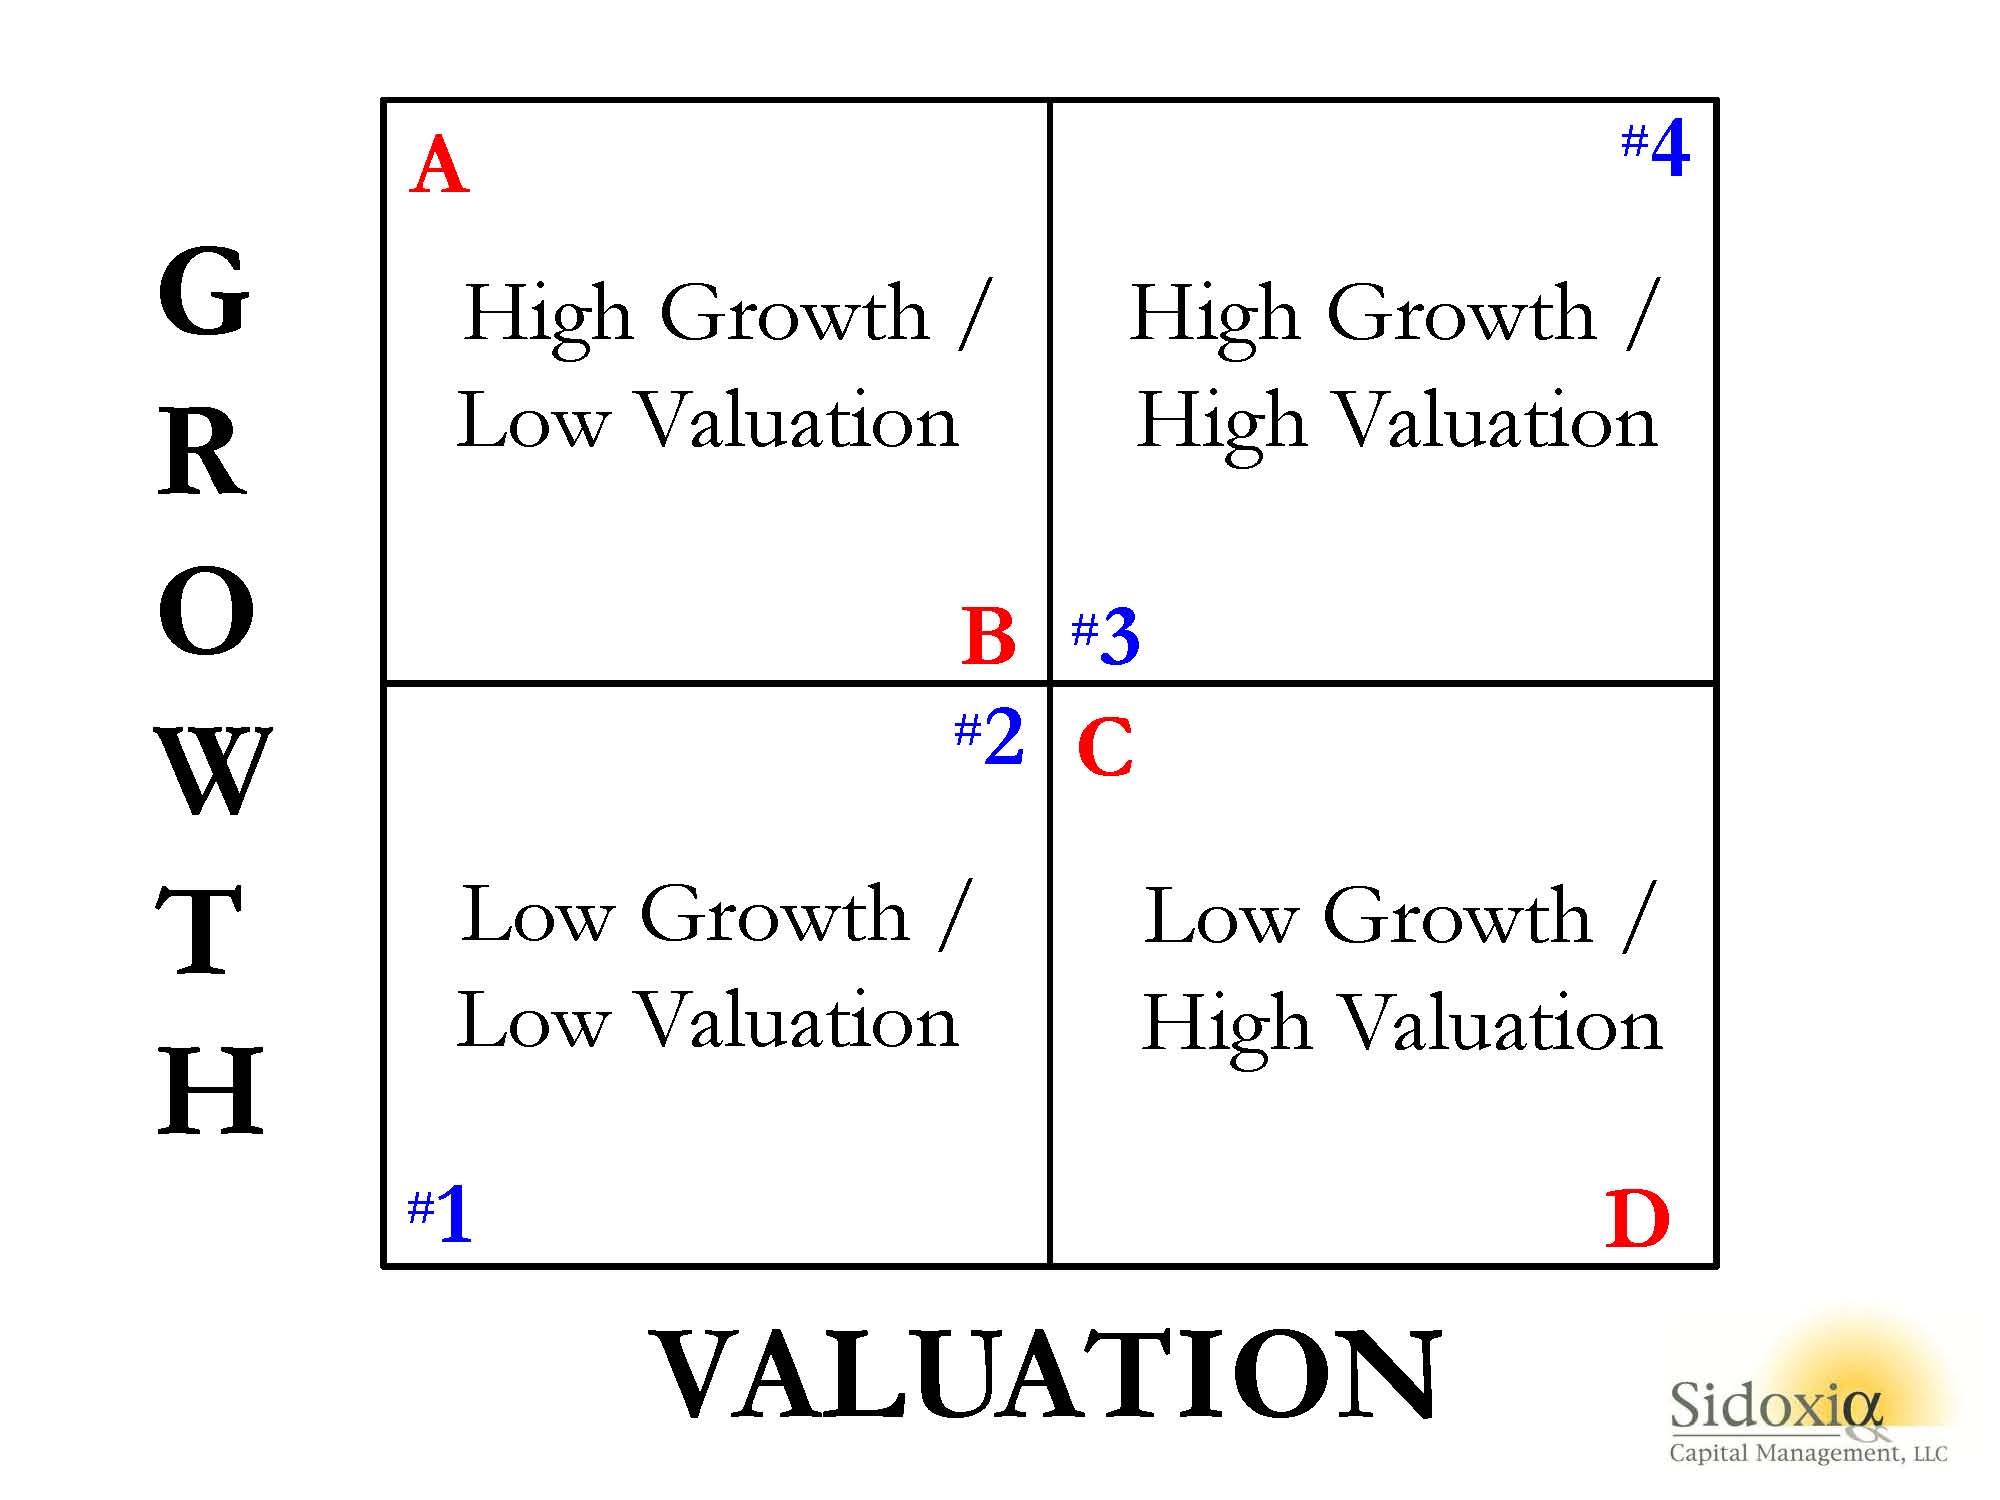
To illustrate my point, let’s take a look at Sidoxia’s “Magic Quadrant“:
 A-B-Cs & 1-2-3s
What Sidoxia’s “Magic Quadrant” demonstrates is a framework for evaluating stocks. By devoting a short period of time reviewing the quadrants, it becomes apparent fairly quickly that Stock A is preferred over Stock B, which is preferred over Stock C, which is preferred over Stock D. In each comparison, the former is preferred over the latter because the earlier letters all have higher growth, and lower (cheaper) valuations. The same relative attractive relationships cannot be applied to stocks #1, #2, #3, and #4. Each successive numbered stock has higher growth, but in order to obtain that higher growth, investors must pay a higher valuation. In other words, Stock #1 has an extremely low valuation with low growth, while Stock #4 has high growth, but an investor must pay an extremely high valuation to own it.
While debating the efficiency of the stock market can escalate into a religious argument, I would argue the majority of stocks fall in the camp of #1, #2, #3, or #4. Or stated differently, you get what you pay for. For example, investors are paying a much higher valuation (high P/E) for Tesla Motors, Inc (TSLA) for its rapid electric car growth vs. paying a much lower valuation (low P/E) for Pitney Bowes Inc (PBI) for its more mature mail equipment business.
The real opportunities occur for those investors capable of identifying companies in the upper-left quadrant (i.e., Stock A) and lower-right quadrant (i.e., Stock D). If the analysis is done correctly, investors will load up on the undervalued Stock A and aggressively short the expensive Stock D. Sidoxia has its own proprietary valuation model (Sidoxia Holy Grail Ranking – SHGR or a.k.a. “SUGAR”) designed specifically to identify these profitable opportunities.
The professions of investing and sports betting are extremely challenging, however establishing a framework like Sidoxia’s “Magic Quadrants” can help guide you to find inefficient and profitable investment opportunities.

Wade W. Slome, CFA, CFP®
Plan. Invest. Prosper.
DISCLOSURE: Sidoxia Capital Management (SCM) and some of its clients hold positions in certain exchange traded funds (ETFs) and TSLA, but at the time of publishing, SCM had no direct position in PBI, or any other security referenced in this article. No information accessed through the Investing Caffeine (IC) website constitutes investment, financial, legal, tax or other advice nor is the information to be relied on in making an investment or other decision. Please read disclosure language on IC Contact page.
Sports & Investing: Why Strong Earnings Can Hurt Stock Prices

With the World Cup in full swing and rabid fans rooting for their home teams, one may notice the many similarities between investing in stocks and handicapping in sports betting. For example, investors (bettors) have opposing views on whether a particular stock (team) will go up or down (win or lose), and determine if the valuation (point spread) is reflective of the proper equilibrium (supply & demand). And just like the stock market, virtually anybody off the street can place a sports bet – assuming one is of legal age and in a legal betting jurisdiction.
Soon investors will be poring over data as part of the critical, quarterly earnings ritual. With some unsteady GDP data as of late, all eyes will be focused on this earnings reporting season to reassure market observers the bull advance can maintain its momentum. However, even positive reports may lead to unexpected investor reactions.
So how and why can market prices go down on good news? There are many reasons that short-term price trends can diverge from short-run fundamentals. One major reason for the price-fundamental gap is this key factor: “expectations”. With such a large run-up in the equity markets (up approx. +195% from March 2009) come loftier expectations for both the economy and individual companies. For instance, just because corporate earnings unveiled from companies like Google (GOOG/GOOGL), J.P. Morgan (JPM), and Intel (INTC) exceed Wall Street analyst forecasts does not mean stock prices automatically go up. In many cases a stock price correction occurs due to a large group of investors who expected even stronger profit results (i.e., “good results, but not good enough”). In sports betting lingo, the sports team may have won the game this week, but they did not win by enough points (“cover the spread”).
Some other reasons stock prices move lower on good news:
- Market Direction: Regardless of the underlying trends, if the market is moving lower, in many instances the market dip can overwhelm any positive, stock- specific factors.
- Profit Taking: Many times investors holding a long position will have price targets or levels, if achieved, that will trigger selling whether positive elements are in place or not.
- Interest Rates: Certain valuation techniques (e.g. Discounted Cash Flow and Dividend Discount Model) integrate interest rates into the value calculation. Therefore, a climb in interest rates has the potential of lowering stock prices – even if the dynamics surrounding a particular security are excellent.
- Quality of Earnings: Sometimes producing winning results is not enough (see also Tricks of the Trade article). On occasion, items such as one-time gains, aggressive revenue recognition, and lower than average tax rates assist a company in getting over a profit hurdle. Investors value quality in addition to quantity.
- Outlook: Even if current period results may be strong, on some occasions a company’s outlook regarding future prospects may be worse than expected. A dark or worsening outlook can pressure security prices.
- Politics & Taxes: These factors may prove especially important to the market this year, since this is a mid-term election year. Political and tax policy changes today may have negative impacts on future profits, thereby impacting stock prices.
- Other Exogenous Items: Natural disasters and security attacks are examples of negative shocks that could damage price values, irrespective of fundamentals.
Certainly these previously mentioned issues do not cover the full gamut of explanations for temporary price-fundamental gaps. Moreover, many of these factors could be used in reverse to explain market price increases in the face of weaker than anticipated results.
If you’re traveling to Las Vegas to place a wager on the World Cup, betting on winning favorites like Germany and Argentina may not be enough. If expectations are not met and the hot team wins by less than the point spread, don’t be surprised to see a decline in the value of your bet.
Wade W. Slome, CFA, CFP®
Plan. Invest. Prosper.
DISCLOSURE: Sidoxia Capital Management (SCM) and some of its clients own certain exchange traded funds, GOOG, and GOOGL, but at the time of publishing had no direct positions in JPM and INTC. No information accessed through the Investing Caffeine (IC) website constitutes investment, financial, legal, tax or other advice nor is to be relied on in making an investment or other decision. Please read disclosure language on IC “Contact” page.
Sports, Stocks, & the Magic Quadrants
Picking stocks is a tricky game and so is sports betting. With the NFL and NCAA football seasons swinging into full gear, understanding the complexity of making money in the stock market can be explained in terms of professional sports-betting. Anybody who has traveled to Las Vegas and bet on a sporting event, understands that choosing a winner of a game simply is not enough…you also need to forecast how many points you think a certain team will win by (see also What Happens in Vegas, Stays on Wall Street). In the world of sports, winning/losing is measured by point spreads. In the world of stocks, winning/losing is measured by valuation (e.g., Price/Earnings ratios).
To make my point, here is a sports betting example from a handful years back:
Florida Gators vs. Charleston Southern Buccaneers (September 2009): Without knowing a lot about the powerhouse Southern Buccaneers squad from South Carolina, 99% of respondents, when asked before the game who would win, would unanimously select Florida – a consistently dominant, national franchise, powerhouse program. The question becomes a little trickier when participants are asked, “Will the Florida Gators win by more than 63 points?” Needless to say, although the Buccs kept it close in the first half, and only trailed by 42-3 at halftime, the Gators still managed to squeak by with a 62-3 victory. Worth noting, had you selected Florida, the overwhelming favorite, the 59 point margin of victory would have resulted in a losing wager (see picture below).
If investing and sports betting were easy, everybody would do it. The reason sports betting is so challenging is due to very intelligent statisticians and odds-makers that create very accurate point spreads. In the investing world, a broad swath of traders, market makers, speculators, investment bankers, and institutional/individual investors set equally efficient valuations.
The goal in investing is very similar to sports betting. Successful professionals in both industries are able to consistently identify inefficiencies and then exploit them. Inefficiencies occur for a bettor when point spreads are too high or low, while investors identify inefficient prices in the marketplace (undervalued or overvalued).
To illustrate my point, let’s take a look at Sidoxia’s “Magic Quadrant“:
A-B-Cs & 1-2-3s
What Sidoxia’s “Magic Quadrant” demonstrates is a framework for evaluating stocks. By devoting a short period of time reviewing the quadrants, it becomes apparent fairly quickly that Stock A is preferred over Stock B, which is preferred over Stock C, which is preferred over Stock D. In each comparison, the former is preferred over the latter because the earlier letters all have higher growth, and lower (cheaper) valuations. The same relative attractive relationships cannot be applied to stocks #1, #2, #3, and #4. Each successive numbered stock has higher growth, but in order to obtain that higher growth, investors must pay a higher valuation. In other words, Stock #1 has an extremely low valuation with low growth, while Stock #4 has high growth, but an investor must pay an extremely high valuation to own it.
While debating the efficiency of the stock market can escalate into a religious argument, I would argue the majority of stocks fall in the camp of #1, #2, #3, or #4. Or stated differently, you get what you pay for. For example, investors are paying a much higher valuation (~100x 2014 P/E) for Tesla Motors, Inc (TSLA) for its rapid electric car growth vs. paying a much lower valuation (~10x 2014 P/E) for Pitney Bowes Inc (PBI) for its mature mail equipment business.
The real opportunities occur for those investors capable of identifying companies in the upper-left quadrant (i.e., Stock A) and lower-right quadrant (i.e., Stock D). If the analysis is done correctly, investors will load up on the undervalued Stock A and aggressively short the expensive Stock D. Sidoxia has its own proprietary valuation model (Sidoxia Holy Grail Ranking – SHGR or a.k.a. “SUGAR”) designed specifically to identify these profitable opportunities.
The professions of investing and sports betting are extremely challenging, however establishing a framework like Sidoxia’s “Magic Quadrants” can help guide you to find inefficient and profitable investment opportunities.
Wade W. Slome, CFA, CFP®
Plan. Invest. Prosper.
DISCLOSURE: Sidoxia Capital Management (SCM) and some of its clients hold positions in certain exchange traded funds (ETFs), but at the time of publishing, SCM had no direct position in TSLA, PBI, or any other security referenced in this article. No information accessed through the Investing Caffeine (IC) website constitutes investment, financial, legal, tax or other advice nor is the information to be relied on in making an investment or other decision. Please read disclosure language on IC Contact page.


