Posts tagged ‘sentiment’
Scary Headlines Abound as Dow Knocks on 50-Thou…What Now?

The Dow Jones Industrial Average first crossed the 40,000 milestone in mid-2024 (see Investing Caffeine – Dow 40,000), yet barely 18 months later, the index has notched another record closing high and is now knocking on the door of 50,000.
For the most recent month:
Dow Jones: +1.7%
S&P 500: +1.4%
NASDAQ: +1.0%
Remarkably, as we enter 2026 flirting with these major milestones, this marks the third consecutive year of double-digit gains across the major stock indices—despite what feels like a nonstop barrage of alarming and often unimaginable headlines.
And that’s the key point.
A World on Fire… According to the Headlines
• Greenland Takeover Threat: Over a year ago, President Trump declared U.S. control of Greenland an “absolute necessity” for national security amid rising Russian and Chinese Arctic influence. Last month, tensions escalated when a proposed tariff regime—starting at 10% and rising to 25%—was announced against Denmark and several European allies. Markets ultimately breathed a sigh of relief after tariffs and military threats were reversed following the announcement of a negotiated framework.
• Venezuelan Invasion: In early January, U.S. forces executed a high-precision raid of the Venezuelan capital of Caracas in the middle of the night, when President Nicolas Maduro was successfully extracted without any Americans killed. Maduro now faces narcoterrorism and corruption charges in federal court in Brooklyn. Meanwhile, Secretary of State Marco Rubio has spearheaded a plan that prioritizes the rebuilding of Venezuela’s oil infrastructure by seizing tankers and millions of barrels of sanctioned crude oil to finance the reconstruction.
• ICE Protests in Minnesota Turn Deadly: Immigration protests in Minnesota escalated last month, resulting in two high-profile fatalities as demonstrators clashed with federal ICE authorities (Immigration and Customs Enforcement).
• Government Shutdown (Again): A partial government shutdown began January 31, 2026, after six of twelve appropriations bills expired. Political gridlock—particularly surrounding DHS (Department of Homeland Security) and ICE funding—has once again sidelined Washington as lawmakers attempt to negotiate a resolution. House members gather back from recess on February 2nd in an attempt to end the budget standoff.
• Federal Reserve Leadership Uncertainty: Fed Chair Jerome Powell’s term expires in May. President Trump has nominated Kevin Warsh as his successor, criticizing “Too Late” Powell’s pace of rate cuts for years. Warsh, a former Fed Governor during the 2008 Financial Crisis, is widely respected but faces scrutiny regarding Fed independence, in part because he shares the President’s view that interest rates should be lower in the current environment. His Senate confirmation remains pending.
• Middle East Tensions in Iran: Following last year’s U.S. strikes on Iranian nuclear facilities, tensions have reignited amid reports of mass protester killings by Iran’s IRGC (Islamic Revolutionary Guard Corps). The U.S. has since mobilized substantial regional military assets, signaling possible intervention in support of regime change.
• Supreme Court Tariff Ruling Looms: The Supreme Court has yet to rule on the administration’s use of the International Emergency Economic Powers Act (IEEPA) of 1977 to impose sweeping global tariffs. A ruling against the government could trigger over $100 billion in retroactive refunds. The next decision window is February 20, 2026.
• U.S. Dollar Weakness: After declining roughly 10% in 2025, the dollar continued to weaken in January 2026 (-1%) – see chart below. Precious metals surged alongside the move—gold up +12% and silver +17% for the month—despite sharp end-of-month pullbacks.
• Cryptocurrency Collapse: Bitcoin has fallen roughly -38% from its October 2025 peak near $126,000 to about $78,000, once again challenging its “digital gold” and “store-of-value” narrative.
• Ongoing Ukraine War and Gaza Conflict: The Russia-Ukraine conflict drags into its fifth year, while violence persists in Gaza despite a loosely agreed ceasefire, with casualties continuing to rise.
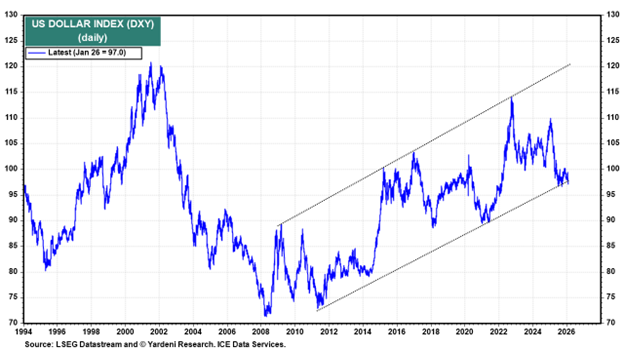
Source: Yardeni Research
Don’t Believe the Hype
That’s a staggering amount of uncertainty. So how has the stock market responded?
By soaring.
S&P 500 Returns:
2023: +24.2%
2024: +23.3%
2025: +16.4%
The verdict on 2026 remains unwritten—but so far, the trend remains intact.
For most of my professional career, I’ve urged investors to tune out fear-driven media narratives (see Turn Off the TV). History repeatedly shows there is little correlation between scary headlines and long-term stock prices.
In fact, I’ve argued before that bad news can often be good news for markets (see Bad News is Good News). Conversely, in 2022 we witnessed strong employment and solid economic growth—yet both stocks and bonds suffered significant losses.
What Actually Moves Markets (“The Stool”)

Rather than reacting to noise, investors should focus on what truly drives long-term returns. At Sidoxia Capital Management, we emphasize four foundational forces (see Don’t Be a Fool, Follow the Stool):
1. Profits
2. Interest Rates
3. Sentiment
4. Valuations
These four legs of the “Sidoxia Stool” exert far more influence over market direction than daily headlines ever will.
While the current environment presents a mixed picture across these factors, monitoring them—rather than reacting emotionally to media narratives—offers investors far greater clarity on where markets may head next. And whether the Dow reaches 50,000… or 100,000 likely won’t be decided by headlines. It will be decided by fundamentals.
Wade W. Slome, CFA, CFP®
Plan. Invest. Prosper.
This article is an excerpt from a previously released Sidoxia Capital Management complimentary newsletter (Feb. 2, 2026). Subscribe Here to view all monthly articles.
DISCLOSURE: Sidoxia Capital Management (SCM) and some of its clients hold positions in certain exchange traded funds (ETFs), but at the time of publishing had no direct position in any other security referenced in this article. No information accessed through the Investing Caffeine (IC) website constitutes investment, financial, legal, tax or other advice nor is to be relied on in making an investment or other decision. Please read disclosure language on IC Contact page.
Another Month, Another Record

The S&P 500 eclipsed the 2,900 level and the NASDAQ jumped over 8,000 this month – both all-new record highs. The Dow Jones Industrial average also temporarily catapulted above 26,000 in August, but remains 2% shy of the January 2018 record highs. For the year, here are what the gains look like thus far:
- S&P 500: +5.3% (2,902)
- NASDAQ: +17.5% (8,110)
- Dow Jones Industrial: +5.0% (25,965)
For months, and even years, I have written how investors have underestimated the strength of this bull market, which has been driven by an incredible earnings growth, low interest rates, reasonable valuations, and a skeptical mass market of investors. As I pointed out in the article, Why the Masses Missed the 10-Year Bull Market, stock ownership has gone down during this massive quadrupling in the bull market. And many investors have missed the fruits of the bull market due to an over-focus on uncertain politics and scary headlines.
Nothing lasts forever, however, so another correction will likely be in the cards, just as we experienced this February when the S&P 500 index temporarily fell -18% from the January peak. But as I have highlighted previously, attempting to forecast or predict a correction is a Fool’s Errand. At Sidoxia we implement a disciplined, systematic process to identify attractive investments through our proprietary S.H.G.R. model (see also Holy Grail) and the four legs of our macroeconomic framework (earnings, interest rates, valuation, and investor sentiment – see Follow the Stool). With stock prices bouncing around near record highs, it is surprising to some that anxiety still remains elevated, primarily due to polarizing politics and an unfounded fear of an imminent recession.
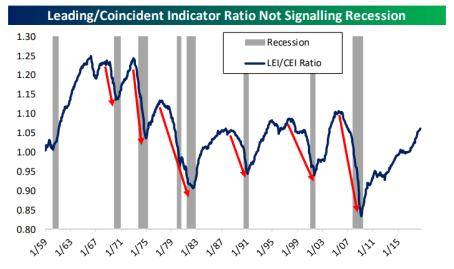
Despite all the hand wringing going on over political headlines, the fact remains the economic tailwinds have “trumped” any political concerns. After a strong Q2 GDP reading of +4.2%, according to numerous economists, Q3 is tracking for another healthy +3% gain. As the Leading & Coincident Indicator chart shows below, there currently is no sign of an imminent recession.
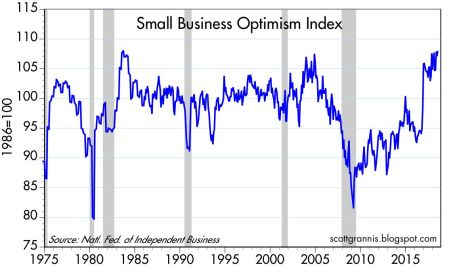
And jobs remain plentiful in part because of Small Business Optimism (see chart below). It’s common knowledge that small businesses generate the vast majority of new jobs, so these optimism levels hovering near 35-year highs augur well for future hiring, job growth, and investment.
The real economy, as measured by the shipment of goods, is trucking along as well (see the truck tonnage chart below).
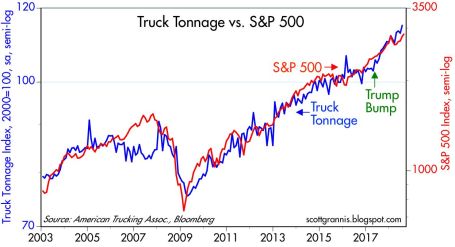
Source: Scott Grannis
While all the positives above have been highlighted already, in the forefront has been an endless string of doomsday forecasts. Scott Grannis captured this sentiment in a six-year chart created by TradeNavigator.com (click here).
As we enter the tenth year of this bull stock market, politics remain polarizing and skepticism reigns supreme. However, until the storm clouds come rolling in, the economy keeps expanding and prices keep moving higher. If the trend continues, as has been the case in recent years, next month’s title could be the same, “Another Month, Another Record.”

Wade W. Slome, CFA, CFP®
Plan. Invest. Prosper.
This article is an excerpt from a previously released Sidoxia Capital Management complimentary newsletter (September 4, 2018). Subscribe on the right side of the page for the complete text.
DISCLOSURE: Sidoxia Capital Management (SCM) and some of its clients hold positions in certain exchange traded funds (ETFs), but at the time of publishing had no direct position in any other security referenced in this article. No information accessed through the Investing Caffeine (IC) website constitutes investment, financial, legal, tax or other advice nor is to be relied on in making an investment or other decision. Please read disclosure language on IC Contact page.
Wiping Your Financial Slate Clean

This article is an excerpt from a previously released Sidoxia Capital Management complimentary newsletter (January 3, 2017). Subscribe on the right side of the page for the complete text.
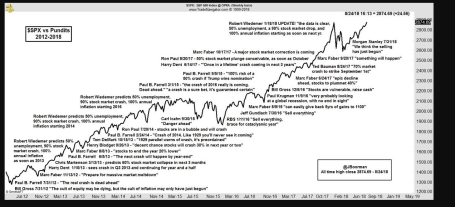
The page on the calendar has turned, and we now have a new year, and will shortly have a new president, and new economic policies. Although there is nothing magical about starting a fresh, new year, the annual rites of passage also allow investors to start with a clean slate again and reflect on their personal financial situation. Before you reach a desired destination (i.e., retirement), it is always helpful to know where you have been and where are you currently. Achieving this goal requires filtering through a never-ending avalanche of real-time data flooding through our cell phones, computers, TVs, radios, and Facebook accounts. This may seem like a daunting challenge, but that’s where I come in!
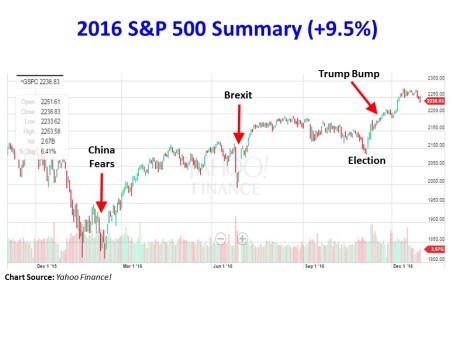
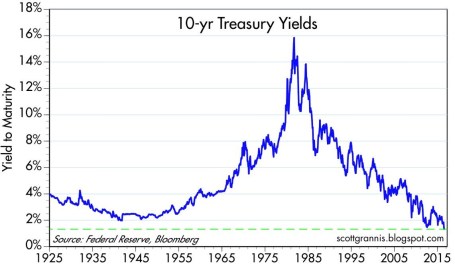
Distinguishing the signals from the noise is tough and there was plenty of noise in 2016 – just like there is every year. Before the S&P 500 stock index registered a +9.5% return in 2016, fears of a China slowdown blanketed headlines last January (the S&P 500 fell -15% from its highs and small cap stocks dropped -26%), and the Brexit (British exit) referendum caused a brief 48-hour -6% hiccup in June. Oil was also in the news as prices hit a low of $26 a barrel early in the year, before more than doubling by year-end to $54 per barrel (still well below the high exceeding $100 in 2014). On the interest rate front, 10-Year Treasury rates bottomed at 1.34% in July, while trillions of dollars in global bonds were incomprehensibly paying negative interest rates. However, fears of inflation rocked bond prices lower (prices move inversely to yields) and pushed bond yields up to 2.45% today. Along these lines, the Federal Reserve has turned the tide on its near-0% interest rate policy as evidenced by its second rate hike in December.
Despite the abbreviated volatility caused by the aforementioned factors, it was the U.S. elections and surprise victory of President-elect Donald Trump that dominated the media airwaves for most of 2016, and is likely to continue as we enter 2017. In hindsight, the amazing Twitter-led, Trump triumph was confirmation of the sweeping global populism trend that has also replaced establishment leaders in the U.K., France, and Italy. There are many explanations for the pervasive rise in populism, but meager global economic growth, globalization, and automation via technology are all contributing factors.
The Trump Bump
Even though Trump has yet to accept the oath of Commander-in-Chief, recent investor optimism has been fueled by expectations of a Republican president passing numerous pro-growth policies and legislation through a Republican majority-controlled Congress. Here are some of the expected changes:
- Corporate/individual tax cuts and reform
- Healthcare reform (i.e., Obamacare)
- Proposed $1 trillion in infrastructure spending
- Repatriation tax holiday for multinational corporate profits
- Regulatory relief (e.g., Dodd-Frank banking and EPA environmental reform)
The chart below summarizes the major events of 2016, including the year-end “Trump Bump”:
While I too remain optimistic, I understand there is no free lunch as it relates to financial markets (see also Half Trump Full). While tax cuts, infrastructure spending, and regulatory relief should positively contribute to economic growth, these benefits will have to be weighed against the likely costs of higher inflation, debt, and deficits.
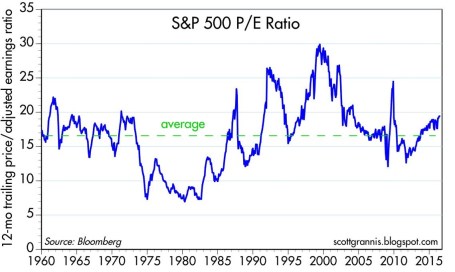
Over the 25+ years I have been investing, the nature of the stock market and economy hasn’t changed. The emotions of fear and greed rule the day just as much today as they did a century ago. What has changed today is the pace, quality, and sheer volume of news. In the end, my experience has taught me that 99% of what you read, see or hear at the office is irrelevant as it relates to your retirement and investments. What ultimately drives asset prices higher or lower are the four key factors of corporate profits, interest rates, valuations, and sentiment (contrarian indicator) . As you can see from the chart below, corporate profits are at record levels and forecast to accelerate in 2017 (up +11.9%). In addition, valuations remain very reasonable, given how low interest rates are (albeit less low), and skeptical investor sentiment augurs well in the short-run.

Source: FactSet
Regardless of your economic or political views, this year is bound to have plenty of ups and downs, as is always the case. With a clean slate and fresh turn to the calendar, now is a perfect time to organize your finances and position yourself for a better retirement and 2017.
Wade W. Slome, CFA, CFP®
DISCLOSURE: Sidoxia Capital Management (SCM) and some of its clients hold positions in FB and certain exchange traded funds (ETFs), but at the time of publishing had no direct position in TWTR or any other security referenced in this article. No information accessed through the Investing Caffeine (IC) website constitutes investment, financial, legal, tax or other advice nor is to be relied on in making an investment or other decision. Please read disclosure language on IC Contact page.
Brexit-Schmexit

Do you remember the panic-inducing headlines related to PIIGS, Crimea, Ebola, Cyprus, and the Flash Crash? Probably not. But if you do remember, these false alarms have likely been relegated to the financial memory graveyard, along with the many other sensationalist news events that have been killed off in the post-financial crisis era. Time will tell whether Brexit dies off or becomes a resurrected concern, like the repeating fears of a China slowdown or Greek collapse. Regardless, as the S&P 500 stock index reaches new all-time record highs, investors are currently shrug off the noise while muttering, “Brexit-Schmexit.”
Individuals have tried to use scary headlines as a timing tool to consistently time market corrections for all of recorded history. Unfortunately, emotional, knee-jerk reactions to alarming news stories rarely is the best strategy. Famed fund manager Peter Lynch said it best when he noted,
“Far more money has been lost by investors preparing for corrections, or trying to anticipate corrections, than has been lost in corrections themselves.”
Having invested for some 25 years, experience has taught me not only is conventional wisdom often wrong, but it also is frequently an accurate contrarian indicator. In other words, frightening news often should be an indicator to buy…not sell. Case in point is the U.K. European Union referendum. The Brexit referendum “Leave” vote caught virtually everyone by surprise, but the rebound in stock prices to new record highs may be even more surprising to most observers. However, for investors following the key factors of interest rates, profits, valuation, and sentiment (see also Don’t Be a Fool, Follow the Stool), may not be shocked by the positive price action.
- Interest Rates: For starters, you don’t have to be a genius to realize that stocks become more attractive when there is a scarcity of investment alternatives. When there are an estimated $13 trillion of negative interest rate bonds, a layman can quickly understand a 2%, 3%, or 4% dividend yield offered on certain stocks (and funds) can represent a much more attractive opportunity. With interest rates at record lows (see chart below), the overall dividend yield of stocks has provided a floor for stock prices and has limited the depth and duration of sell-offs and corrections.
Source: Calafia Beach Pundit
- Profits: Corporate profits are near record highs but have been sluggish due to several factors, including the negative impact of the strong dollar on multinational exports; the depressing effect of declining interest rates on the banking sector’s net interest profit margins; the general decline in oil and commodity prices; and general lethargic economic growth overall in international markets (emerging and developed economies). Encouragingly, a stabilization in the value of the U.S. dollar, along with a rebound in energy prices augurs well for a potential shift back to earnings growth in the coming quarters.
- Valuation: On a valuation basis, the Price/Earnings ratio of the stock market is about 10-15% above historical averages (see chart below). The average S&P 500 stock price trades around 19x’s the value of trailing twelve-month earnings. However, in the context of all-time record low-interest rates, a premium valuation is well deserved, especially for those companies paying a dividend and growing their bottom line.
Source: Calafia Beach Pundit
- Sentiment: Since the Great Financial Crisis / Recession, there has been about $1.5 trillion in equity investments that have been pulled out of U.S. equity mutual funds. This statistic is a clear sign of the extreme risk aversion and pervasive pessimism. Despite money flowing out of equity funds, corporations have bolstered the upward trajectory in stock prices with hundreds of billions in corporate stock buybacks and trillions in mergers & acquisition transactions. With all the universal jitteriness, I like to remind investors of Warren Buffett’s credo, “Buy fear, and sell greed.”
Brexit-Schmexit NOT Brexit-Panic
Despite the risk aversion in the marketplace, stock prices in the U.S. continue to grind higher to record levels. The stock market is currently communicating interest rates, profits, valuation, and sentiment are more important factors to price direction than are Brexit and other geopolitical concerns.
The silver lining behind severe investor skepticism is the creation of additional investment opportunities. As famous investor Sir John Templeton stated regarding stock market cycles, “Bull markets are born on pessimism and they grow on skepticism, mature on optimism, and die on euphoria.” Even the most objective observers have difficulty pointing to a broad set of indicators signaling euphoria, and the recent Turkish military coup attempt and domestic gun violence incidents will not squash out the negativity. Until optimism and elation rule the day, there’s no need to worry-schworry.
Wade W. Slome, CFA, CFP®
Plan. Invest. Prosper.
DISCLOSURE: Sidoxia Capital Management (SCM) and some of its clients hold positions in certain exchange traded funds , but at the time of publishing had no direct position in any other security referenced in this article. No information accessed through the Investing Caffeine (IC) website constitutes investment, financial, legal, tax or other advice nor is to be relied on in making an investment or other decision. Please read disclosure language on IC Contact page.
Pulling the Band-Aid Off Slowly

Federal Reserve monetary policy once again came to the forefront as the Fed released its April minutes this week. After living through years of a ZIRP (Zero Interest Rate Policy) coupled with QE (Quantitative Easing), many market participants and commentators are begging for a swifter move back to “normalization” (a Federal Funds Rate target set closer to historical averages). The economic wounds from the financial crisis may be healing, as seen in the improving employment data, but rather than ripping off the interest rate Band-Aid quickly and putting the pain behind investors, the dovish Fed Chair Janet Yellen has been signaling for months the Fed will increase rates at a “gradual” pace.
Despite the more hawkish tone regarding the possibility of an additional rate hike in June, Fed interest rate futures are currently still only factoring in about a 26% probability of a rate increase in June. As I have been saying for years (see “Fed Fatigue”), there has, and will likely continue to be, an overly, hyper-sensitive focus on monetary policy and language disseminated by members of the Feral Reserve Open Market Committee.
For example, in 1994, despite the Fed increasing target rates by +2.5% in a single year (from 3.0% to 5.5%), stock prices finished roughly flat for the year, and the market resumed its decade-long bull market run the subsequent year. Today, the higher bound of Fed Funds sits at a mere 0.5%, and the Fed has announced only one target increase this cycle (equaling a fraction of the ’94 pace). Even if investors are panicking over another potential quarter point in June or July, can you say, “overkill?”
While the Fed is approaching the lower-end of the range for its employment mandate (unemployment currently sitting at 5%), despite the recent bounce in oil prices, core inflation remains in check (see Calafia Pundit chart below). This long-term benign pricing trend gives the Fed a longer leash as it relates to the pace of future rate hikes.
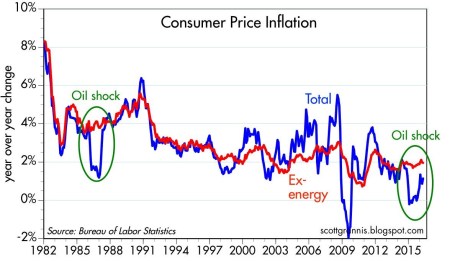
Source: Calafia Beach Pundit
Sure, ripping off the Fed Band-Aid with a small handful of +0.5% (50 bps) hikes might appease hawkish investors, but Janet Yellen, the “Fed Fairy Godmother,” has made it abundantly clear she is in no hurry to raise rates. Whether there is zero, one, or two additional rate hikes this year is much less important than other fundamental factors. Adding fuel to the Fed-speak fire in the short-run will be Yellen speeches on May 27th at Harvard University and on June 6th at the World Affairs Council of Philadelphia. And then following that, we will have the “Brexit” referendum (i.e., the vote on whether Britain should exit the EU); a steady stream of election noise; and many other unanticipated economic/geopolitical headlines.
As I continually state, the key factors driving the direction of long-term stock prices are profits, interest rates, valuations, and sentiment (see Follow the Stool). Profits (ex-energy) are growing near record levels; interest rates are near record lows (even with potential 2016 hikes); valuations remain near historical averages; and sentiment regarding stock ownership is firing strongly as a positive contrarian indicator.
While many pundits have been calling for and predicting the Fed to rip the Band-Aid off with a swift string of rate increases, persistently low inflation, coupled with a consistently dovish Fed Chair are likely to lead to a slow peeling of the monetary policy Band-Aid. Unfortunately, the endless flow of irrelevant monetary policy guesswork regarding the timing of future rate hikes will be more painful than the actual hikes themselves. In the end, any future hikes should be justified with a stronger economic foundation, which should represent future strength, rather than future weakness.
Wade W. Slome, CFA, CFP®
Plan. Invest. Prosper.
DISCLOSURE: Sidoxia Capital Management (SCM) and some of its clients hold positions in certain exchange traded funds (ETFs), but at the time of publishing had no direct position in any other security referenced in this article. No information accessed through the Investing Caffeine (IC) website constitutes investment, financial, legal, tax or other advice nor is to be relied on in making an investment or other decision. Please read disclosure language on IC Contact page.
Michael Jordan and Market Statistics

Basketball is in the air as the NBA playoffs are once again upon us. While growing up in high school, Michael Jordan was my basketball idol, and he dominated the sport globally at the highest level. I was a huge fanatic. Besides continually admiring my MJ poster-covered walls, I even customized my own limited edition Air Jordan basketball shoes by applying high school colors to them with model paint – I would not recommend this fashion experiment to others.
Eventually the laws of age, physics, and gravity took over, as Jordan slowly deteriorated physically into retirement. On an infinitesimally smaller level, I also experienced a similar effect during my 30s when playing in an old man’s recreational basketball league. Day-by-day, month-by-month, and year-by-year, I too got older and slower (tough to believe that’s possible) as I watched all the 20-somethings run circles around me – not to mention my playing time was slashed dramatically. Needless to say, I too was forced into retirement like Michael Jordan, but nobody retired my number, and I still have not been inducted into the Hall of Fame.

“Air Wade” Before Retirement: No Photoshop in 1988, just an optical illusion created by an 8-foot rim.
Financial markets are subject to similar laws of science (economics) too. The stock market and the economy get old and tired just like athletes, as evidenced by the cyclical nature of bear markets and recessions. Statistics are a beautiful thing when it comes to sports. Over the long run, numbers don’t lie about the performance of an athlete, just like statistics over the long run don’t lie about the financial markets. When points per game, shooting percentage, rebounds, assists, minutes played, and other measurements are all consistently moving south, then it’s safe to say fundamentals are weakening.
I’ve stated it many times in the past, and I’ll state it again, these are the most important factors to consider when contemplating the level and direction of the stock market (see also Don’t Be a Fool, Follow the Stool).
- Profits
- Interest Rates
- Valuations
- Sentiment
While the absolute levels of these indicators are important, the trend or direction of each factor is also very relevant. Let’s review these factors a little more closely.
- Profits: Profits and cash flows, generally speaking, are the lifeblood behind any investment and currently corporate profits are near record levels. When it comes to the S&P 500, the index is currently expected to generate a 2016 profit of $117.47. Considering a recent price closing of 2,092 on the index, this translates into a price-earnings ratio (P/E) of approximately 17.8x or a 5.6% earnings yield. This earnings yield can be compared to the 1.9% yield earned on the 10-Year Treasury Note, which is even lower than the 2.1% dividend yield on the S&P 500 (a rare historical occurrence). If history repeats itself, the 5.6% earnings yield on stocks should double to more than 10% over the next decade, however the yield on 10-year Treasuries stays flat at 1.9% over the next 10 years. The strong dollar and the implosion of the energy sector has put a lid on corporate profits over the last year, but emerging signs are beginning to show these trends reversing. Stabilizing profits near record levels should be a positive contributor to stocks, all else equal.
- Interest Rates: Pundits have been pointing to central banks as the sole reason for low/negative interest rates globally (see chart below). NEWS FLASH: Central banks have been increasing and decreasing interest rates for decades, but that hasn’t stopped the nearly unabated 36-year decline in interest rates and inflation (see chart below). As I described in previous articles (see Why 0% Rates?), technology, globalization, and the rise of emerging markets is having a much larger impact on interest rates/inflation than monetary policies. If central banks are so powerful, then why after eight years of loose global monetary policies hasn’t inflation accelerated yet? Regardless, all else equal, these historically low interest rates are horrible for savers, but wonderful for equity investors and borrowers.

Source: Calafia Beach Pundit
- Valuations: The price you pay for an investment is one of the, if not the, most important factors to consider. I touched upon valuations earlier when discussing profits, and based on history, there is plenty of evidence to support the position that valuations are near historic averages. Shiller CAPE bears have been erroneously screaming bloody murder over the last seven years as prices have tripled (see Shiller CAPE smells like BS). A more balanced consideration of valuation takes into account the record low interest rates/inflation (see The Rule of 20).
- Sentiment: There are an endless number of indicators measuring investor optimism vs. pessimism. Generally, most experienced investors understand these statistics operate as valuable contrarian indicators. In other words, as Warren Buffett says, it is best to “buy fear, and sell greed.” While I like to track anecdotal indicators of sentiment like magazine covers, I am a firm believer that actions speak louder than words. If you consider the post-crisis panic of dollars flowing into low yielding bonds – greater than $1 trillion more than stocks (see Chicken vs. Beef ) you will understand the fear and skepticism remaining in investors minds. The time to flee stocks is when everyone falls in love with them.
Readers of Michael Lewis’s book Moneyball understand the importance statistics can play in winning sports. Michael Jordan may not have been a statistician like Billy Beane, because he spent his professional career setting statistical records, not analyzing them. Unfortunately, my basketball career never led me to the NBA or Hall of Fame, but I still hope to continue winning in the financial markets by objectively following the all-important factors of profits, interest rates, valuations, and sentiment.
Wade W. Slome, CFA, CFP®
Plan. Invest. Prosper.
DISCLOSURE: Sidoxia Capital Management (SCM) and some of its clients hold positions in certain exchange traded funds (ETFs), but at the time of publishing had no direct position in any security referenced in this article. No information accessed through the Investing Caffeine (IC) website constitutes investment, financial, legal, tax or other advice nor is to be relied on in making an investment or other decision. Please read disclosure language on IC Contact page.
Chasing Headlines

It’s been an amazing start to the year. First the market cratered on slowing China economic concerns, domestic recessionary fears, deteriorating oil prices, and negative interest rates abroad. In response to all these worries (and others), stocks dove more than -11% (S&P 500 Index) in January, before settling down. Subsequently, the market has made a screaming recovery, in part due to dovish monetary policy comments (i.e., reduction in forecasted interest rate hikes) and diminished anxiety over a potential global collapse. Month-to-date stocks are up an impressive +5.4%, and year-to-date equities are flattish, or down less than -1%.
With an endless amount of information flowing across our smart phones and computers, it becomes quite easy and tempting to chase news headlines, just like a hyper dog chasing a car. But even once an investor catches up (or reacts) to a headline, there’s confusion around how to profit from the fleeting information. First of all, every plugged-in hedge fund and institutional investor has likely already traded on the stale information you received. Second of all, rarely is the data relevant to the long-term cash generating capabilities of the company or economy. And lastly, the news is more often than not, instantly factored into the stock price. Chasing news headlines only eaves individual investors holding the bag of performance-shattering transactions costs, taxes, and worn-out pricing.
The heightened volatility in late 2015 and early 2016 hasn’t however prevented investors and so-called pundits from attempting to time the market. Any battle-tested investment veteran knows it’s virtually impossible to consistently time the market (see also Market Timing Treadmill), but this fact hasn’t prevented speculators from attempting the feat nonetheless. Famed investment guru, Peter Lynch, who earned an average +29% annual return from 1977-1990, summed it up well when he stated the following:
“Far more money has been lost by investors preparing for corrections, or trying to anticipate corrections, than has been lost in corrections themselves.”
The Important Factors
As I’ve written many times in the past, the keys to long-term stock performance are not knee-jerk reactions to headlines, but rather these following crucial factors (see also Don’t Be a Fool, Follow the Stool):
- Profits
- Interest Rates
- Sentiment
- Valuations
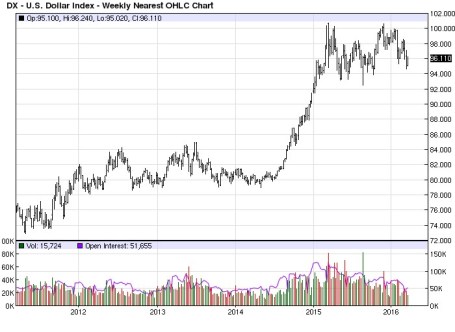
On the profit growth front, corporate income has been pressured by numerous headwinds over the last few years, including an export-shattering increase in the value of the U.S. dollar and a profit-squeezing collapse in energy sector earnings. As you can see from the chart below, the value of the U.S. dollar increased by about 25% from mid-2014 to early-2015, in part because of diverging global central bank policies (more hawkish U.S. Fed vs. more dovish ECB/international central banks). Since that spike, the dollar has settled into a broad range (95 – 100), and the former forceful headwind have now turned into modest tailwinds. This trend is important because an estimated 35-40% of corporate profits are derived from international operations.
Adding insult to injury, the roughly greater than -70% decline in forward energy earnings over the last 18 months has caused a significant hit to overall S&P 500 profits. The tide appears to be finally turning (or at least stabilizing) however, as we’ve seen oil prices rebound by about +30% this year from the lows in January. If these aforementioned trends persist, profit pressures in 2016 are likely to abate significantly, and may actually become additive to growth.
Source: Barchart.com
Profits are important, but so are interest rates. While incessant talk about the path of future Fed policy continues to blanket the airwaves (see also Fed Fatigue), absent a rapid increase in interest rates (say 300-400 basis points), interest rates remain unambiguously positive for equity markets, providing a floor for the oft-repeated volatility in financial markets. As long as stocks are providing higher yields than many bonds, and depositors are earning 0% (or negative rates) on their checking accounts, stocks may remain unloved, but not forgotten.
And speaking of unloved, the sentiment for stocks remains sour. One need look no further than the quarter-billion dollars in hemorrhaging outflows out of U.S. equity funds (see ICI Long-Term Mutual Fund Flows) since 2014. This deep underlying skepticism serves as a positive contrarian indicator for future equity prices. Right now, very few individual investors are swimming in the pool – the time to get out of the stock market pool is when everyone is jumping in.
And lastly, valuations remain very much in line with historical averages (approximatqely 17x 2016 projected earnings), especially considering the generational low in interest rates. Bears continue to point to the elevated CAPE ratio, which has been a disastrous indicator the last seven years (and longer), as a reason to remain cautious. The ironic part is that valuations are virtually guaranteed to improve a few years from now as we roll off the artificially depressed years of 2008-2010.
When you add it all up, zero (or negative) interest rates, combined with the other key factors of profits, sentiment, and valuations, equities remain an important and attractive part of a diversified long-term portfolio. Your objectives, time horizon, and risk tolerance will always drive the proportion of your equity allocation. Nevertheless, some bond exposure is essential to smooth out volatility. Regardless of your investment strategy, chasing headlines, like a dog chasing a car, serves no purpose other than leaving you with a tired, unproductive investment portfolio.
Wade W. Slome, CFA, CFP®
Plan. Invest. Prosper.
DISCLOSURE: Sidoxia Capital Management (SCM) and some of its clients own certain exchange traded funds, but at the time of publishing SCM had no direct position in any other security referenced in this article. No information accessed through the Investing Caffeine (IC) website constitutes investment, financial, legal, tax or other advice nor is to be relied on in making an investment or other decision. Please read disclosure language on IC “Contact” page.
The Art of Catching Falling Knives

“In the middle of every difficulty lies an opportunity.” ~Albert Einstein
It was a painful week for bullish investors in the stock market as evidenced by the -1,018 point drop in the Dow Jones Industrial Average, equivalent to approximately a -6% decline. The S&P 500 index did not fare any better, and the loss for the tech-heavy NASDAQ index was down closer to -7% for the week.
The media is attributing much of the short-term weakness to a triple Chinese whammy of factors: 1) Currency devaluation of the Yuan; 2) Weaker Chinese manufacturing data registering in at the lowest level in over six years; and 3) A collapsing Chinese stock market.
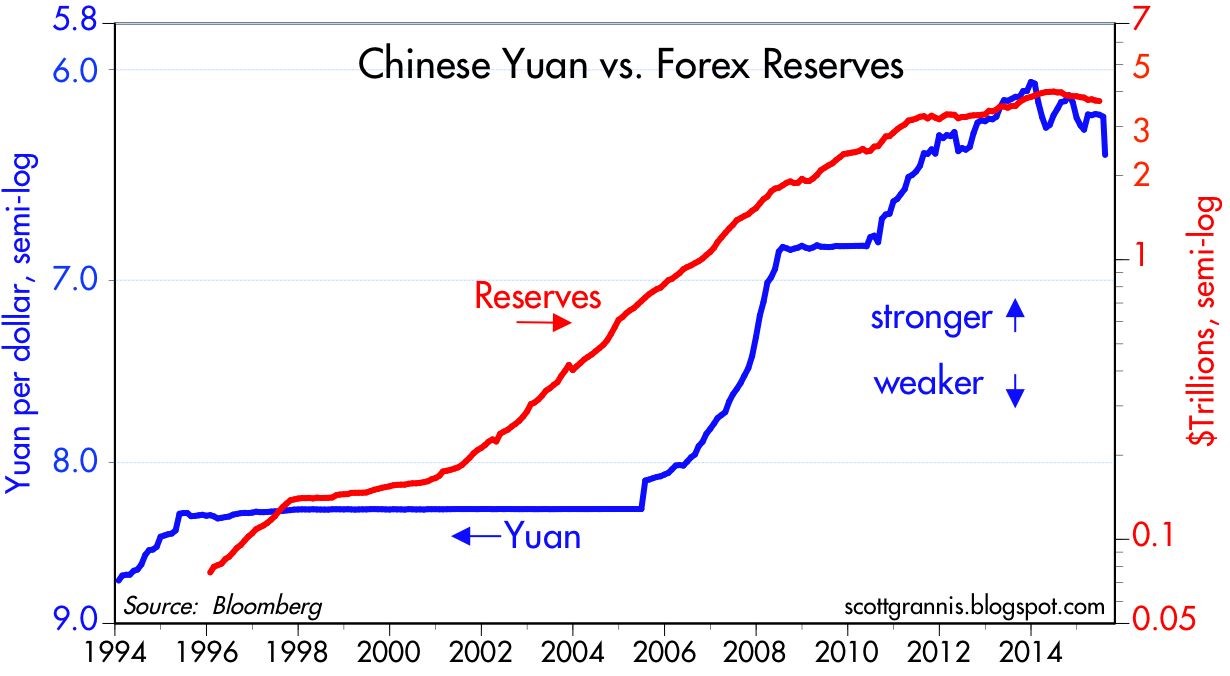
As the second largest economy on the planet, developments in China should not be ignored, however these dynamics should be put in the proper context. With respect to China’s currency devaluation, Scott Grannis at Calafia Beach Pundit puts the foreign exchange developments in proper perspective. If you consider the devaluation of the Yuan by -4%, this change only reverses a small fraction of the Chinese currency appreciation that has taken place over the last decade (see chart below). Grannis rightfully points out the -25% collapse in the value of the euro relative to the U.S. dollar is much more significant than the minor move in the Yuan. Moreover, although the move by the People’s Bank of China (PBOC) makes America’s exports to China less cost competitive, this move by Chinese bankers is designed to address exactly what investors are majorly concern about – slowing growth in Asia.
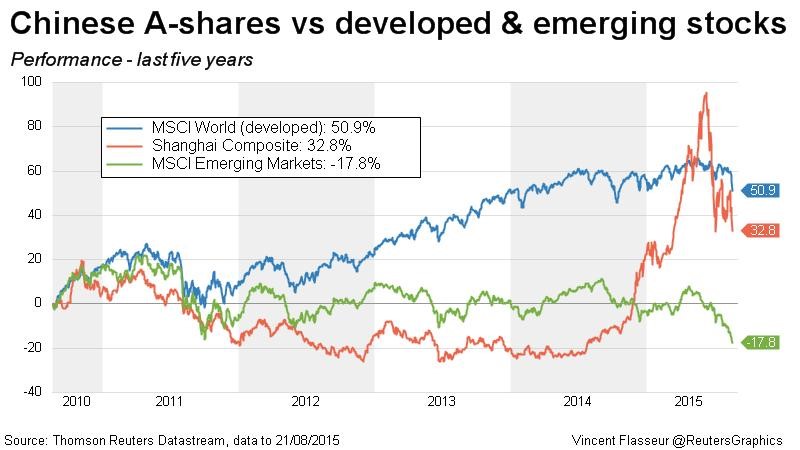
Although the weak Chinese manufacturing data is disconcerting, this data is nothing new – the same manufacturing data has been very choppy over the last four years. On the last China issue relating to its stock market, investors should be reminded that despite the massive decline in the Shanghai Composite, the index is still up by more than +50% versus a year ago (see chart below)
Fear the Falling Knife?
Given the fresh carnage in the U.S. and foreign markets, is now the time for investors to attempt to catch a falling knife? Catching knives for a living can be a dangerous profession, and many investors – professionals and amateurs alike – have lost financial fingers and blood by attempting to prematurely purchase plummeting securities. Rather than trying to time the market, which is nearly impossible to do consistently, it’s more important to have a disciplined, unemotional investing framework in place.
Hall of Fame investor Peter Lynch sarcastically highlighted the difficulty in timing the market, “I can’t recall ever once having seen the name of a market timer on Forbes‘ annual list of the richest people in the world. If it were truly possible to predict corrections, you’d think somebody would have made billions by doing it.”
Readers of my blog, Investing Caffeine understand I am a bottom-up investor when it comes to individual security selection with the help of our proprietary S.H.G.R. model, but those individual investment decisions are made within Sidoxia’s broader, four-pronged macro framework (see also Don’t be a Fool, Follow the Stool). As a reminder, driving our global views are the following four factors: a) Profits; b) Interest rates; c) Sentiment; and Valuations. Currently, two of the four indicators are flashing green (Interest rates and Sentiment), and the other two are neutral (Profits and Valuations).
- Profits (Neutral): Profits are at record highs, but a strong dollar, weak energy sector, and sluggish growth internationally have slowed the trajectory of earnings.
- Valuation (Neutral): At an overall P/E of about 18x’s profits for the S&P 500, current valuations are near historical averages. For CAPE investors who have missed the tripling in stock prices, you can reference prior discussions (see CAPE Smells Like BS). I could make the case that stocks are very attractive with a 6% earnings yield (inverse P/E ratio) compared to a 2% 10—Year Treasury bond, but I’ll take off my rose-colored glasses.
- Interest Rates (Positive): Rates are at unambiguously low levels, which, all else equal, is a clear-cut positive for all cash generating asset classes, including stocks. With an unmistakably “dovish” Federal Reserve in place, whether the 0.25% interest rate hike comes next month, or next year will have little bearing on the current shape of the yield curve. Chairman Yellen has made it clear the trajectory of rate increases will be very gradual, so it will take a major shift in economic trends to move this factor into Neutral or Negative territory.
- Sentiment (Positive): Following the investment herd can be very dangerous for your financial health. We saw that in spades during the late-1990s in the technology industry and also during the mid-2000s in the housing sector. As Warren Buffett says, it is best to “buy fear and sell greed” – last week we saw a lot of fear.
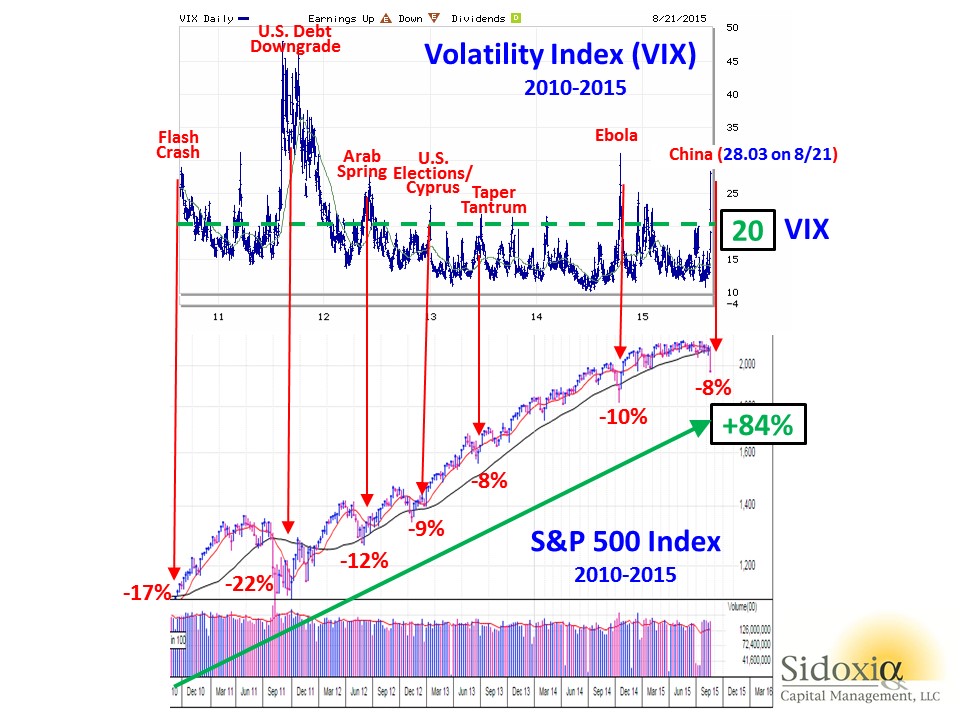
In addition to the immense outflows out of stock funds (see also Great Rotation) , panic was clearly evident in the market last week as shown by the Volatility Index (VIX), a.k.a., the “Fear Gauge.” In general, volatility over the last five years has been on a declining trend, however every 6-12 months, some macro concern inevitably rears its ugly head and volatility spikes higher. With the VIX exploding higher by an amazing +118% last week to a level of 28.03, it is proof positive how quickly sentiment can change in the stock market.
Not much in the investing world works exactly like science, but buying stocks during previous fear spikes, when the VIX level exceeds 20, has been a very lucrative strategy. As you can see from the chart below, there have been numerous occasions over the last five years when the over-20 level has been breached, which has coincided with temporary stock declines in the range of -8% to -22%. However, had you held onto stocks, without adding to them, you would have earned an +84% return (excluding dividends) in the S&P 500 index. Absent the 2011 period, when investors were simultaneously digesting a debt downgrade, deep European recession, and domestic political fireworks surrounding a debt ceiling, these periods of elevated volatility have been relatively short-lived.
Whether this will be the absolute best time to buy stocks is tough to say. Stocks are falling like knives, and in many instances prices have been sliced by more than -10%, -20%, or -30%. It’s time to compile your shopping list, because valuations in many areas are becoming more compelling and eventually gravity will run its full course. That’s when your strategy needs to shift from avoiding the falling knives to finding the bouncing tennis balls…excuse me while I grab my tennis racket.

Wade W. Slome, CFA, CFP®
Plan. Invest. Prosper.
DISCLOSURE: Sidoxia Capital Management (SCM) and some of its clients hold positions in certain exchange traded funds (ETFs) including emerging market/Chinese ETFs, but at the time of publishing, SCM had no direct position in any other security referenced in this article. No information accessed through the Investing Caffeine (IC) website constitutes investment, financial, legal, tax or other advice nor is to be relied on in making an investment or other decision. Please read disclosure language on IC Contact page.
Sector Weightings: Another Financial Toolbox Gizmo

The ever-elusive $64,000 question of “Where does the stock market go from here?” is as popular a question today as it was a century ago. All you have to do is turn on CNBC to find an endless number of analysts, strategists, journalists, economists, and other talking heads guessing on the direction of stock prices. So many people are looking to make a quick buck or get a hot tip, but unfortunately investing is like dieting…it takes hard work and there are no simple solutions. As much as the pundits would like to make this investment game sound like a scientific certainty, in reality there is a lot of subjective art, experience, and luck that goes into successful investment outcomes. Consistent followers of Investing Caffeine understand there are a number of tools I use to guide me on the direction and level of stock prices, and three of my toolbox gizmos include the following:
- Earnings (Stock prices positively correlated)
- Interest Rates (Stock prices inversely correlated)
- Sentiment (Stock prices inversely correlated)
While these and other devices (see SHGR Holy Grail) are great for guesstimating the direction of longer-term stock prices, sector weightings are also great tools for identifying both overheated and unloved segments of the market. Take an extreme example, such as the S&P 500 Technology historical sector weighting in the year 2000. As you can see from the Bespoke Investment charts, the Technology sector went from about a 5% weighting of the overall market in the early 1990s to around 36% at the 2000 peak before dropping back down to 15% after the Tech Bubble burst. If you fast forward to the 2008-2009 Financial Crisis, we saw a similar “bubblicious” phenomenon rupture in the Financial sector. During 1980 the Financial segment accounted for approximately 5% of the total S&P 500 Index market capitalization in 1980 and skyrocketed to a peak of 23% in 2007, thanks in large part to a three decade bull-run in declining interest rates coupled with financial regulators asleep at the oversight switch.
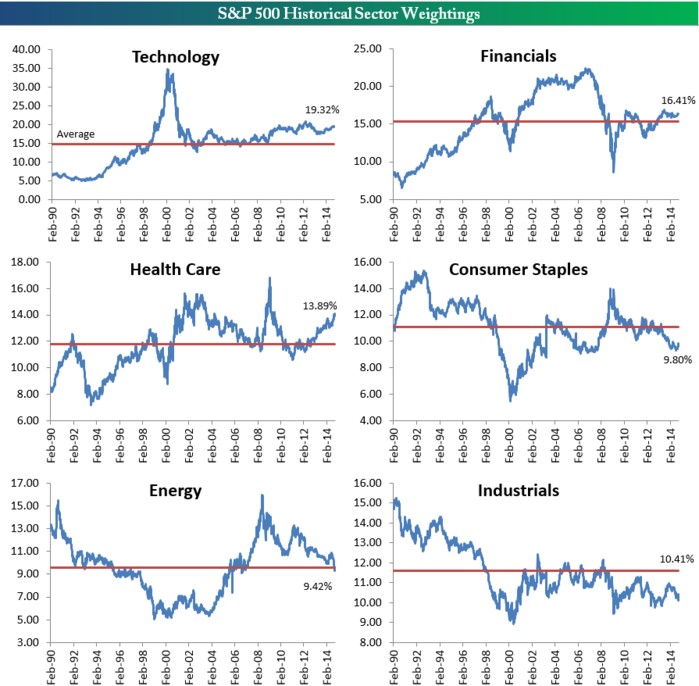
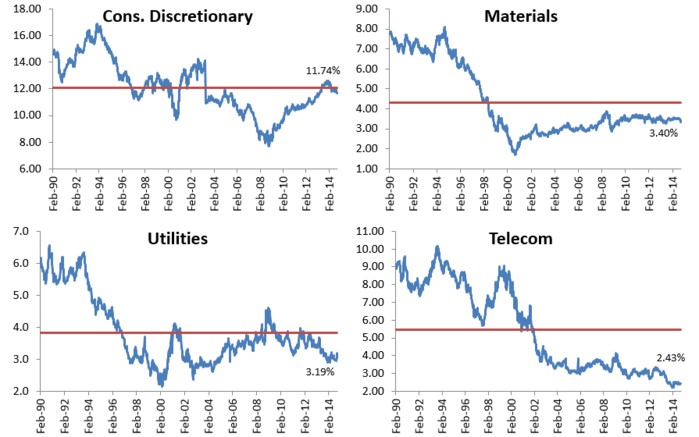
Source: Bespoke Investment
While some segment weightings are currently above and below historical averages, the chart shows there is a tendency for mean reversion to occur over time. As I’ve written in the past, while I believe the broader market can be objectively be interpreted as reasonably priced in light of record earnings, record low interest rates, and a broader skeptical investing public ( see Markets Soar and Investors Snore), I’m still finding expensive, frothy sub-sectors in areas like money losing biotech and social media companies. The reverse can be said if you examined the 2000 period – the overall stock market was overpriced at its 3/24/00 peak (P/E ratio of about ~31x), but within the S&P 500 stocks there were bargains of a lifetime if you looked outside the Tech sector. Consider many of the unloved “Old Economy” stocks that got left behind in the 1990s. Had you invested in these forgotten stocks at the peak of the 2000 market (March 24, 2000), you would have earned an equal-weighted average return of +430% (and significantly higher than that if you included dividends):
Caterpillar Inc (CAT): +416%
Deere & Co (DE): +367%
FedEx Corp (FDX): +341%
Ingersoll-Rand Co (IR): +260%
Lockheed Martin Corp (LMT): +811%
Three M Company (MMM): +254%
Schlumberger Ltd (SLB): +158%
Union Pacific Corp (UNP): +1,114%
Exxon Mobil Corp (XOM): +148%
Average +430%
That +430% compares to a much more modest +36% return for the S&P 500 over the same period. What this data underscores are the perils of pure index investing and highlights the room for active investment managers like Sidoxia Capital Management to generate alpha.
There are many ways of analyzing “Where does the stock market go from here?,” but whatever methods you use, the power of examining sector weightings and mean reversion gizmos should be readily accessible in your investment toolbox.

Wade W. Slome, CFA, CFP®
Plan. Invest. Prosper.
DISCLOSURE: Sidoxia Capital Management (SCM) and some of its clients own FDX; non-discretionary positions in DE, LMT, MMM, SLB, XOM, and a range of positions in certain exchange traded fund positions, but at the time of publishing SCM had no direct position in CAT, IR, UNP, or any other security referenced in this article. No information accessed through the Investing Caffeine (IC) website constitutes investment, financial, legal, tax or other advice nor is to be relied on in making an investment or other decision. Please read disclosure language on IC Contact page.
What’s Going on with This Crazy Market?!

The massive rally of the stock market since March 2009 has been perplexing for many, but the state of confusion has reached new heights as the stock market has surged another +2.0% in May, surpassing the Dow 15,000 index milestone and hovering near all-time record highs. Over the last few weeks, the volume of questions and tone of disbelief emanating from my social circles has become deafening. Here are some of the questions and comments I’ve received lately:
“Wade, why in the heck is the market up so much?”; “This market makes absolutely no sense!”; “Why should I buy at the peak when I can buy at the bottom?”; “With all this bad news, when is the stock market going to go down?”; “You must be shorting (betting against) this market, right?”
If all the concerns about the Benghazi tragedy, IRS conservative targeting, and Federal Reserve bond “tapering” are warranted, then it begs the question, “How can the Dow Jones and other indexes be setting new all-time highs?” In short, here are a few reasons:
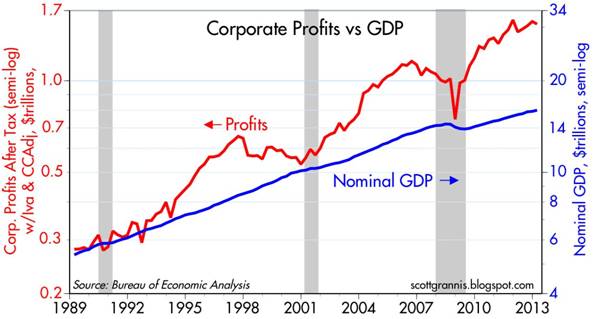
You hear a lot of noise on TV and read a lot of blathering in newspapers/blogs, but what you don’t hear much about is how corporate profits have about tripled since the year 2000 (see red line in chart above), and how the profit recovery from the recent recession has been the strongest in 55 years (Scott Grannis). The profit collapse during the Great Recession was closely chronicled in nail-biting detail, but a boring profit recovery story sells a lot less media advertising, and therefore gets swept under the rug.
II.) Reasonable Prices (Comparing Apples & Oranges):
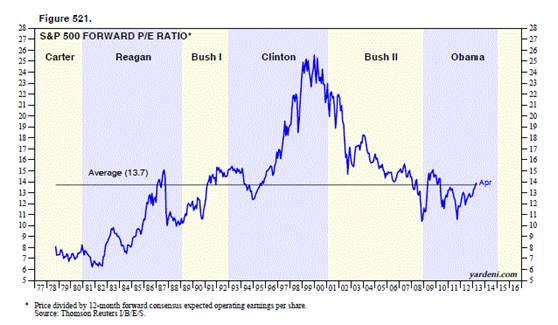
Source: Dr. Ed’s Blog
The Price-Earnings ratio (P/E) is a general barometer of stock price levels, and as you can see from the chart above (Ed Yardeni), current stock price levels are near the historical average of 13.7x – not at frothy levels experienced during the late-1990s and early 2000s.
Comparing Apples & Oranges:

At the most basic level of analysis, investors are like farmers who choose between apples (stocks) and oranges (bonds). On the investment farm, growers are generally going to pick the fruit that generates the largest harvest and provide the best return. Stocks (apples) have historically offered the best prices and yielded the best harvests over longer periods of time, but unfortunately stocks (apples) also have wild swings in annual production compared to the historically steady crop of bonds (oranges). The disastrous apple crop of 2008-2009 led a massive group of farmers to flood into buying a stable supply of oranges (bonds). Unfortunately the price of growing oranges (i.e., buying bonds) has grown to the highest levels in a generation, with crop yields (interest rates) also at a generational low. Even though I strongly believe apples (stocks) currently offer a better long-term profit potential, I continue to remind every farmer (investor) that their own personal situation is unique, and therefore they should not be overly concentrated in either apples (stocks) or oranges (bonds).
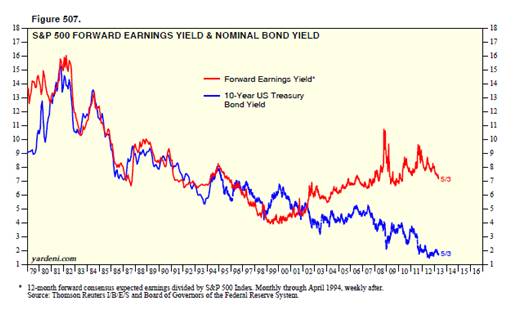
Source: Dr. Ed’s Blog
Regardless, you can see from the chart above (Dr. Ed’s Blog), the red line (stocks) is yielding substantially more than the blue line (bonds) – around 7% vs. 2%. The key for every investor is to discover an optimal balance of apples (stocks) and oranges (bonds) that meets personal objectives and constraints.
III.) Skepticism (Market Climbs a Wall of Worry):

Source: Calafia Beach Pundit
Although corporate profits are strong, and equity prices are reasonably priced, investors have been withdrawing hundreds of billions of dollars from equity funds (negative blue lines in chart above – Calafia Beach Pundit). While the panic of 2008-2009 has been extinguished from average investors’ psyches, the Recession in Europe, slowing growth in China, Washington gridlock, and the fresh memories of the U.S. financial crisis have created a palpable, nervous skepticism. Most recently, investors were bombarded with the mantra of “Selling in May, and Going Away” – so far that advice hasn’t worked so well. To buttress my point about this underlying skepticism, one need not look any further than a recent CNBC segment titled, “The Most Confusing Market Ever” (see video below):
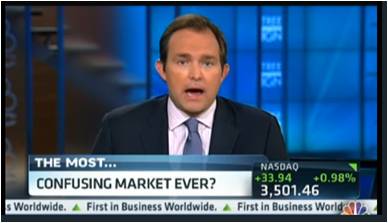
Source: CNBC
It’s clear that investors remain skittish, but as legendary investor Sir John Templeton so aptly stated, “Bull markets are born on pessimism, grow on skepticism, mature on optimism and die on euphoria.” The sentiment pendulum has been swinging in the right direction (see previous Investing Caffeine article), but when money flows sustainably into equities and optimism/euphoria rules the day, then I will become much more fearful.
Being a successful investor or a farmer is a tough job. I’ll stop growing apples when my overly optimistic customers beg for more apples, and yields on oranges also improve. In the meantime, investors need to remember that no matter how confusing the market is, don’t put all your oranges (bonds) or apples (stocks) in one basket (portfolio) because the financial markets do not need to get any crazier than they are already.
Wade W. Slome, CFA, CFP®
Plan. Invest. Prosper.
DISCLOSURE: Sidoxia Capital Management (SCM) and some of its clients hold positions in certain exchange traded funds (ETFs), but at the time of publishing SCM had no direct position in any other security referenced in this article. No information accessed through the Investing Caffeine (IC) website constitutes investment, financial, legal, tax or other advice nor is to be relied on in making an investment or other decision. Please read disclosure language on IC Contact page.


