Posts tagged ‘oil prices’
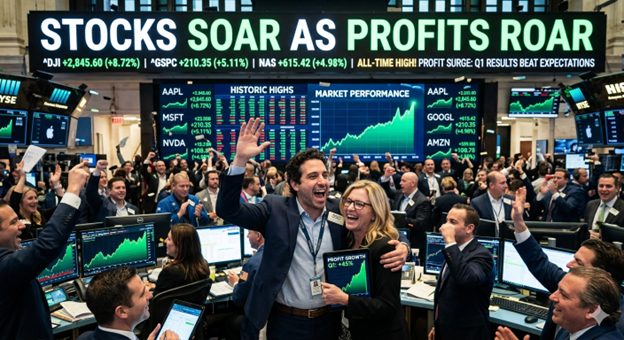
Stocks Soar as Profits Roar
The Geopolitical Dilemma: Iran Gone Wrong
It has been a volatile and unsettling period in the Middle East. Following more than a month of continuous bombing in Iran, the United States reached a tenuous ceasefire. While the active conflict has paused, the U.S. continues to maintain a financially crippling blockade against the Iranian regime.
If that geopolitical stress isn’t enough, oil prices remain elevated at $105 per barrel (WTI), roughly 57% above levels seen before the bombings began. Furthermore, gasoline prices hovering around the $4.40 per gallon threshold are acting like a brake that is slowing down global economic activity.
On the surface, this negative narrative sounds like a disastrous backdrop for financial markets. Yet, last month’s stock market performance tells a completely different story:
· S&P 500: +10.4%
· NASDAQ: +15.3%
· Dow Jones Industrial Average: +7.1%
Why the Disconnect?
Followers of my firm, Sidoxia Capital Management, and my blog, Investing Caffeine, know that geopolitics are rarely the primary drivers of long-term stock performance. Instead, we look to the “four legs of the Sidoxia stool”: profits, interest rates, valuations, and sentiments. For a deeper dive, check out my article: Don’t Be a Fool, Follow the Stool. The vital leg supporting the recent move in stocks has been soaring profits. As illustrated by data from Yardeni.com, S&P 500 profits (red line) are accelerating at a much steeper pace than those of the S&P 400 MidCap (blue line) and S&P 600 SmallCap (green line).
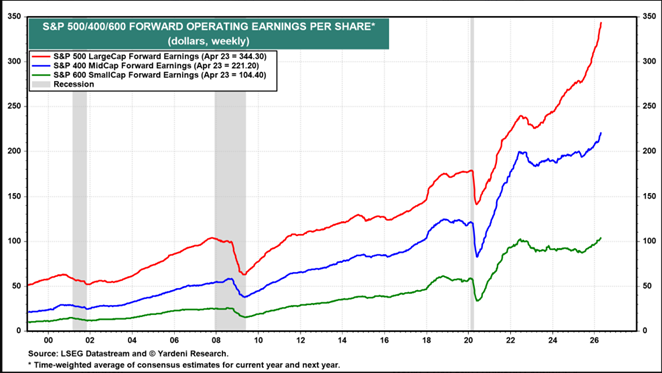
Source: Yardeni.com
A major contributor to this profit expansion is rising profit margins. Today, companies are earning a profit of approximately11 cents per dollar of sales, compared to just 5.5 cents during the 1970s and 1980s. The chart below highlights this phenomenon.
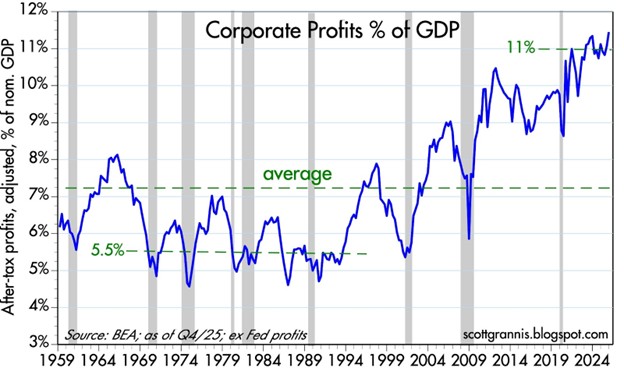
Source: Calafia Beach Pundit
The AI Productivity Revolution
What is driving much of this margin expansion? You guessed it: Artificial Intelligence.
We need to look no further than the mega-cap tech companies that reported Q1 financial results this week (Alphabet, Amazon, Microsoft, and Meta Platforms) to see how AI is helping companies cut costs and grow revenues:
- Combined, these four companies boast a revenue run-rate exceeding $1.7 trillion, with an accelerating growth rate above +22%.
- Meanwhile, headcount growth at these firms has remained virtually flat at < 2%. In fact, Meta and Microsoft recently announced a combined 20,000 in job cuts, raising concerns over an AI labor crisis.
These sales increases and expense reductions help explain last month’s surge in the performance of these stocks:
- Alphabet-Google (GOOGL): +33.9%
- Amazon.com Inc. (AMZN): +27.3%
- Microsoft Corp. (MSFT): +10.2%
- Meta Platforms Inc. (META): +6.8%
AI Driving the IPO Pipeline The AI boom is also creating massive value in the private markets. High-profile expected IPOs – including Elon Musk’s xAI, OpenAI (makers of ChatGPT), and Anthropic – are expected to exceed a combined $2 trillion in valuation. The graphic below shows the gargantuan size of these expected IPOs.
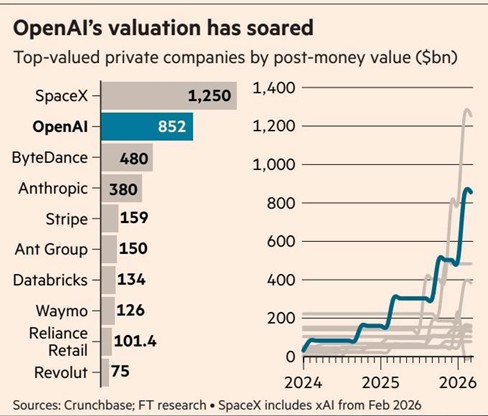
Source: Financial Times
The AI Train is Leaving the Station
AI is impacting every industry and every worker in some way, and this disruptive wave will undoubtedly displace some jobs. However, investors have the opportunity to jump on the train rather than be left behind.
As I noted in my recent article, The Saaspocalypse Has Arrived—or Has It?, if history repeats itself, the rollout of new technologies creates an influx of new industries and jobs that offset initial disruptions. If you work in an industry vulnerable to AI proliferation, taking advantage of the AI profit revolution can help offset potential financial disruption.
Of course, not everything is rainbows and unicorns. The Iranian conflict could still spiral out of control, which could quickly reverse recent stock market gains.
As I recapped for investors last month:
“History reminds us that while geopolitical shocks are terrifying in the moment, their impact on diversified portfolios is almost always temporary… In the world of investing, the best time to stay disciplined is exactly when everyone else is looking for the exit.”
Suffice it to say, geopolitics can and will impact short-term performance, but they rarely dictate long-term trends. When analyzing the market, it is crucial to remember a fundamental truth: When profits roar, stock prices often soar.
Wade W. Slome, CFA, CFP®
Plan. Invest. Prosper.
This article is an excerpt from a previously released Sidoxia Capital Management complimentary newsletter (May 1, 2026). Subscribe Here to view all monthly articles.
DISCLOSURE: Sidoxia Capital Management (SCM) and some of its clients hold positions in GOOGL, META, AMZN, MSFT, and certain exchange traded funds (ETFs), but at the time of publishing had no direct position in any other security referenced in this article. No information accessed through the Investing Caffeine (IC) website constitutes investment, financial, legal, tax or other advice nor is to be relied on in making an investment or other decision. Please read disclosure language on IC Contact page.
Bombs Away – Iran & Oil Spark an Explosive Month

The stock market felt the blast of geopolitical tension last month as all three major domestic indexes all retreated. In March, the S&P 500 fell -5.1%, the Dow Jones Industrial Average dropped -5.4%, and the NASDAQ slid -4.8%.
While a -5% monthly drop grabs headlines, perspective and context are key. Since the start of 2023, the S&P 500 remains up approximately +70% (excluding dividends). Even after the recent -7% pullback from January’s record highs, the index is still trading +35% above its April 2025 lows.
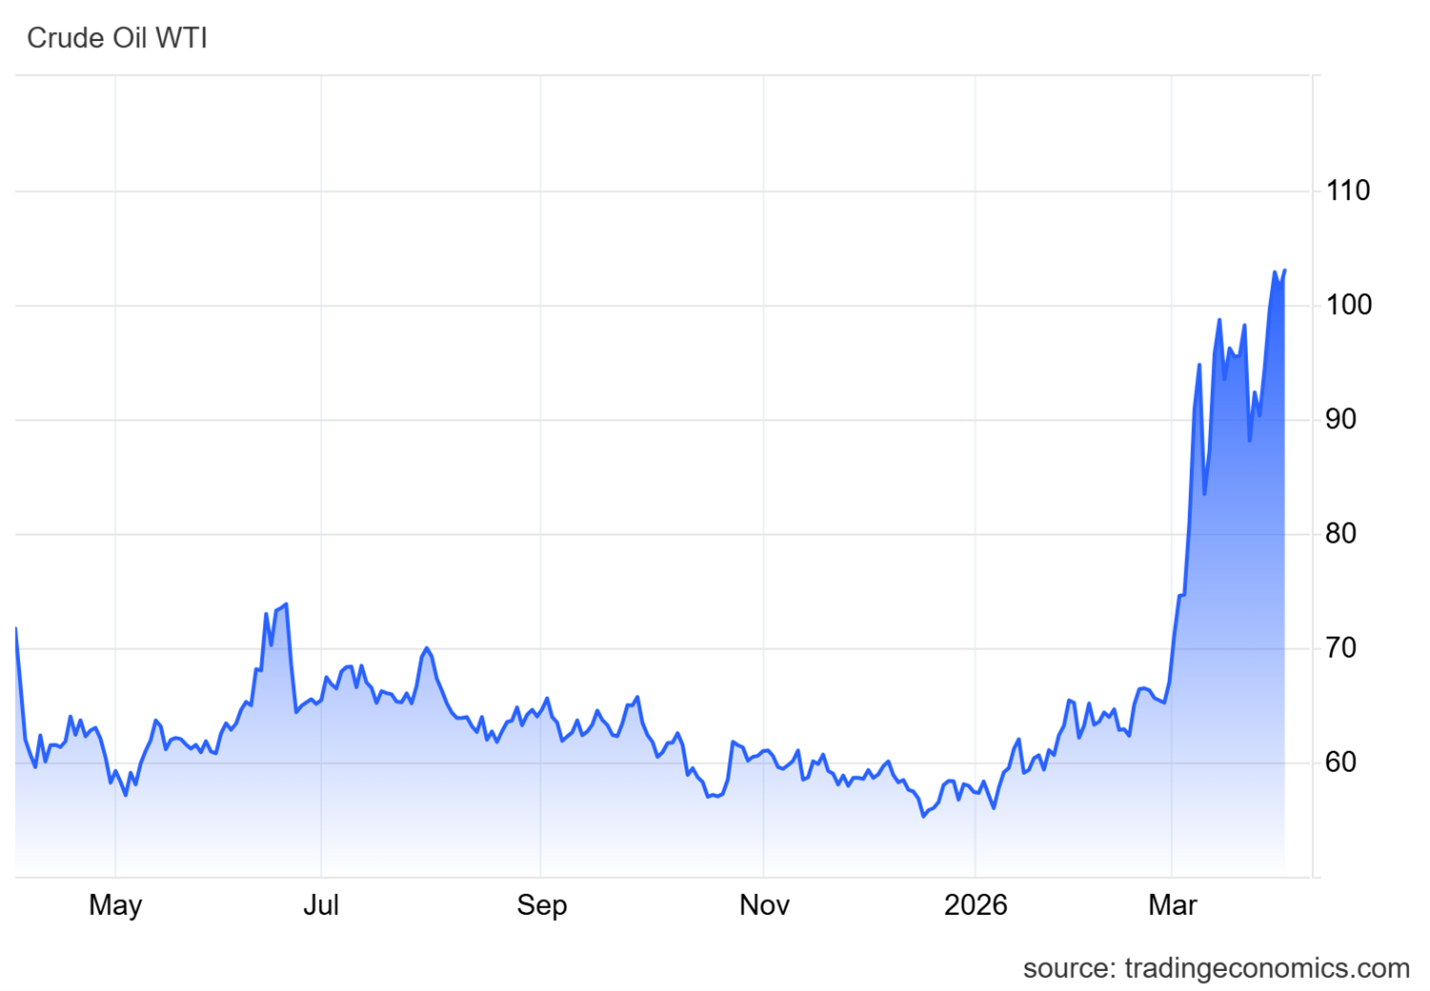
The Strait Has Created An Oil Gate
The primary catalyst for the market volatility is the escalating conflict involving the U.S., Israel, and Iran. Beyond the tragic human cost, the economic “bomb” has been the disruption of the Strait of Hormuz, which handles the flow of roughly 20% of the world’s oil supply.
Basic economics dictates that when supply is choked, prices skyrocket. We saw exactly that: WTI Crude spiked roughly +54% over the last month, surging from $67 to a peak near $103 per barrel (see chart below).
The “energy tax” from higher oil prices has introduced four major stressors for investors:
- Drained Consumer Wallets: Every extra dollar spent at the pump is a dollar not spent on groceries, healthcare, or retail. Since consumers disproportionately control the U.S. economy, cuts in discretionary spending on things like vacations, cars, and houses has a material negative impact on the nation’s financial output.
- Widespread Industrial Shock: High oil prices inflate costs for almost every physical industry, including airline fuel, trucking logistics, petroleum-based fertilizers, and construction inputs like asphalt and steel.
- Labor Market Cooling: The February jobs report was a wake-up call, showing a loss of -92,000 jobs (well below the expected gain of +130,000). While AI-driven displacement is a factor, the sudden spike in energy overhead has clearly contributed to employers pausing their hiring.
- Recessionary Red Flags: Prediction markets like Polymarket now place the probability of a U.S. recession by the end of 2026 at 34.5%, up significantly from just a few months ago (see chart below).
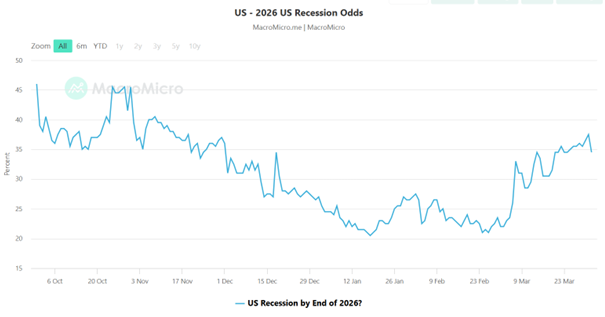
Source: MacroMicro & Polymarket
Geopolitical Noise vs. Market Reality
While current volatility feels unique, seasoned investors have seen this movie before. It is easy to forget that the S&P 500 slumped -21% last year as markets grappled with the administration’s aggressive tariff strategies, only to see prices roar back once the initial shock subsided. Even with the recent -7% pullback from January’s record highs, the S&P 500 remains +35% higher than the lows of April 2025.
Both the tariff friction and the Iranian conflict could be viewed as “self-inflicted” geopolitical maneuvers. While the long-term economic gains of these high-stakes decisions are still being debated, one short-term reality is certain: the November midterm elections are fast approaching.
History suggests that as elections loom, the administration will prioritize stability and “voter-friendly” economic conditions. We are already seeing a shift in rhetoric that suggests an “off-ramp” for the Iran conflict may be closer than the headlines imply. President Trump is addressing the nation today with an update on the current situation. When political capital is on the line, pragmatic pivots often follow unpopular volatility. What does this mean for investors? This means we are likely closer to the end of this Iranian conflict than we are to the beginning.
The Resilience of History
The last decade has been a relentless cycle of “unprecedented” global unrest. However, as the timeline below illustrates, geopolitical shocks have historically acted as speed bumps, not roadblocks, for long-term equity growth:
- 2026: Maduro Kidnapping (Venezuela)
- 2025: Operation Midnight Hammer (Iran)
- 2024: Collapse of the Assad Regime (Syria) & Moscow Terrorist Attack
- 2024: Houthi Red Sea Attacks
- 2023: Israel-Hamas Conflict
- 2022: Russia-Ukraine Invasion
- 2021: U.S. Withdrawal from Afghanistan
- 2017: North Korean “Fire and Fury”
- 2016: Brexit
- 2015: Paris Terrorist Attacks
The Bottom Line: Since the beginning of 2015, the S&P 500 has more than tripled (+217%). The data is clear: even in the face of horrific global events, the market’s primary engine – corporate innovation and earnings – tends to prevail. In the world of investing, a timeless (if cynical) truth remains: “When missiles fly, it’s time to buy!”
The Fed’s “Wet Towel”
This oil-driven inflation has also doused hopes for aggressive monetary easing. At the start of the year, the appointment of Kevin Warsh as the incoming Fed Chairman (set to succeed Jerome Powell in May) led markets to price in multiple rate cuts. However, the March “dot plot” (see chart below) revealed a much more hawkish reality. The Federal Reserve now projects only one 25-basis-point cut for the remainder of 2026, bringing the target range to 3.25%–3.50%. Seven officials now see zero cuts this year, reflecting a “higher for longer” stance as they battle renewed energy-led inflation.
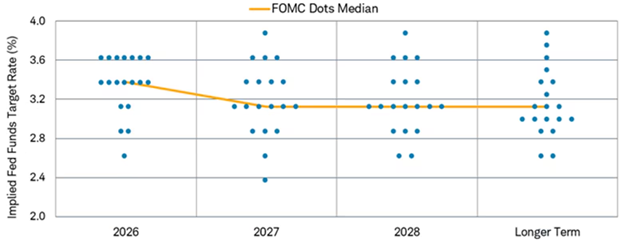
Source: Charles Schwab
The Sidoxia Strategy: Don’t Fear the Turbulence
History reminds us that while geopolitical shocks are terrifying in the moment, their impact on diversified portfolios is almost always temporary. Since 2015, the S&P 500 has more than tripled (+217%) despite a decade defined by the Russia-Ukraine war, the collapse of the Assad regime, and various “Operation Midnight Hammer” style conflicts.
As we look toward the November midterm elections, we expect political rhetoric to shift toward stabilization. President Trump has already signaled that an “offramp” for the Iranian conflict may be approaching, as high energy prices are rarely a winning campaign strategy. At Sidoxia, we aren’t distracted by the noise of the “bombs.” We continue to focus on fundamental valuations and opportunistically use this volatility to improve our clients’ positioning. In the world of investing, the best time to stay disciplined is exactly when everyone else is looking for the exit.
Wade W. Slome, CFA, CFP®
Plan. Invest. Prosper.
This article is an excerpt from a previously released Sidoxia Capital Management complimentary newsletter (Apr. 1, 2026). Subscribe Here to view all monthly articles.
DISCLOSURE: Sidoxia Capital Management (SCM) and some of its clients hold positions in certain exchange traded funds (ETFs), but at the time of publishing had no direct position in any other security referenced in this article. No information accessed through the Investing Caffeine (IC) website constitutes investment, financial, legal, tax or other advice nor is to be relied on in making an investment or other decision. Please read disclosure language on IC Contact page.
Huh… Stocks Reach a Record High?

This article is an excerpt from a previously released Sidoxia Capital Management complimentary newsletter (September 1, 2016). Subscribe on the right side of the page for the complete text.
The stock market hit all-time record highs again in August, but despite the +6.2% move in 2016 S&P 500 stock prices (and +225% since early 2009), investors continue to scratch their heads in confusion. Individuals continue to ask, “Huh, how can stocks be trading at or near record levels (+6% for the year) when Brexit remains a looming overhang, uncertainty surrounds the U.S. presidential election, global terrorist attacks are on the rise, negative interest rates are ruling the day, and central banks around the globe are artificially propping up financial markets (see also Fed Myths vs. Reality)? Does this laundry list of concerns stress you out? If you said “yes”, you are not alone.
As I’ve pointed out in the past, we live in a different world today. In the olden days, terrorist attacks, natural disasters, currency crises, car chases, bank failures, celebrity DUIs, and wars happened all the time. However, before the internet existed, people either never heard about these worries, or they just didn’t care (or both). Today, we live in a Twitter, Facebook, Instagram, Snapchat, society with 500+ cable channels, and supercomputers in the palm of our hands (i.e., smartphones) with more computing power than existed on the Apollo mission to the moon. In short, doom-and-gloom captures human attention and sells advertising, the status quo does not.
- Record corporate profits are on the rise
- Stabilizing value of the dollar
- Stabilizing energy and commodity prices
- Record low interest rates
- Skeptical investing public
Fortunately, the stock market pays more attention to these important dynamics, rather than the F.U.D. (Fear, Uncertainty, Doubt) peddled by the pundits, bloggers, and TV talking heads. Certainly, any or all of the previously mentioned positive factors could change or deteriorate over time, but for the time being, the bulls are winning.
Let’s take a closer look at the influencing components that are driving stock prices higher:
Record Corporate Profits

Source: Yardeni.com
Profits are the mother’s milk that feeds the stock market. During recessions, profits are starved and stock prices decline. On the flip side, economic expansions feed profits and cause share prices to rise. As you can see from the chart above, there was a meteoric rise in corporate income from 2009 – 2014 before a leveling off occurred from 2015 going into 2016. The major headwinds causing profits to flatten was a spike of 25% in the value of the U.S. dollar relative to the value of other global currencies, all within a relatively short time span of about nine months (see chart below).

Why is this large currency shift important? The answer is that approximately 40% of multinational profits derived by S&P 500 companies come from international markets. Therefore, when the value of the dollar rose 25%, the cost to purchase U.S. products and services by foreign buyers became 25% costlier. Selling dramatically higher cost goods abroad squeezed exports, which in turn led to a flattening of profits. Time will tell, but as I showed in the first chart, the slope of the profit line has resumed its upwards trajectory, which helps explain why stock prices have been advancing in recent months.
Besides a strong dollar, another negative factor that temporarily weakened earnings was the dramatic decline in oil prices (see chart below) Two years ago, WTI oil prices were above $100 per barrel. Today, prices are hovering around $45 per barrel. As you can imagine, this tremendous price decline has had a destructive impact on the profits of the energy sector in general. The good news is that after watching prices plummet below $30 earlier this year, prices have since stabilized at higher levels. In other words, the profits headwind has been neutralized, and if global economic growth recovers further, the energy headwind could turn into an energy tailwind.

Record Low Interest Rates
Stocks were not popular during the early 1980s. In fact, the Dow Jones Industrial Average traded at 2,600 in 1980 vs 18,400 today. The economy was much smaller back then, but another significant overhang to lower stock prices was higher interest rates (and inflation). Back in 1980, the Federal Funds target rate set by the Federal Reserve reached a whopping 20.0% versus today the same rate sits at < 0.5%.
Why is this data important? When you can earn a 16.99% yield in a one-year bank CD (see advertisement below), generally there is a much smaller appetite to invest in riskier, more volatile stocks. Another way to think about rates is to equate interest rates to the cost of owning stocks. When interest rates were high, the relative cost to own stocks was also high, so many investors liquidated stocks. It makes perfect sense that stocks in that high interest rate environment of 1980 would be a lot less attractive compared to a relatively safe CD that paid 17% over a 12-month period.

On the other hand, when interest rates are low, the relative cost of owning stocks is low, so it makes sense that stock prices are rising in this environment. Just like profits, interest rates are not static, and they too can change rapidly. But as long as rates remain near record lows, and profits remain healthy, stocks should remain an appealing asset class, especially given the scarcity of strong alternatives.
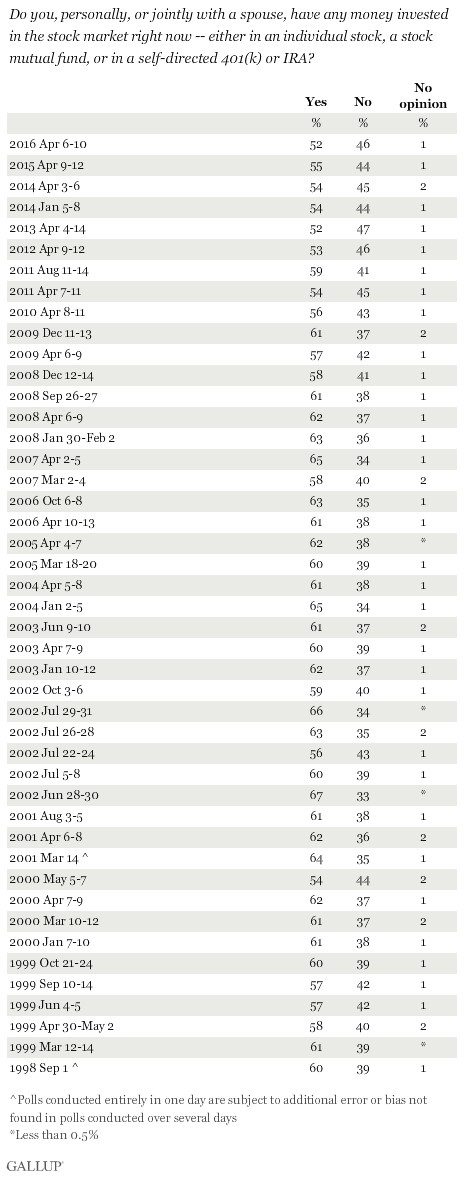
Skeptical Investing Public
The last piece of the puzzle to examine in order to help explain the head-scratching record stock prices is the pervasive skepticism present in the current stock market. How can Brexit, presidential election, terrorism, negative interest rates, and uncertain Federal Reserve policies be good for stock prices? Investing in many respects can be like navigating through traffic. When everyone wants to drive on the freeway, it becomes congested and a bad option, therefore taking side-streets or detours is a better strategy. The same principle applies to the stock market. When everyone wants to invest in the stock market (like during the late 1990s) or buy housing (mid-2000s), prices are usually too inflated, and shrewd investors decide to choose a different route by selling.
The same holds true in reverse. When nobody is interested in investing (see also, 18-year low in stock ownership and two trillion of stocks sold), then generally that is a strong sign that it is a good time to buy. Currently, skepticism is plentiful, for all the reasons cited above, which is a healthy investment indicator. Many individuals continue reading the ominous headlines and scratching their heads in confusion over today’s record stock prices. In contrast, at Sidoxia, we have opportunistically benefited from investors’ skepticism by discovering plenty of attractive opportunities for our clients. There’s no confusion about that.

Wade W. Slome, CFA, CFP®
Plan. Invest. Prosper.
DISCLOSURE: Sidoxia Capital Management (SCM) and some of its clients hold positions in certain exchange traded funds (ETFs) and FB, but at the time of publishing had no direct position in TWTR or any other security referenced in this article. No information accessed through the Investing Caffeine (IC) website constitutes investment, financial, legal, tax or other advice nor is to be relied on in making an investment or other decision. Please read disclosure language on IC Contact page.
Spring Has Sprung: Market Weather Turning

This article is an excerpt from a previously released Sidoxia Capital Management complimentary newsletter (April 1, 2016). Subscribe on the right side of the page for the complete text.
It was a cold winter for stocks, but as we approached the spring season in March, the flowers have begun to bloom. More specifically, during the month of March, the Dow Jones Industrial index catapulted +7.1% and the S&P 500 index jumped +6.6%. While this roughly +80% annualized rate is unlikely to sustain itself, this flurry of strong performance could be the sign of warmer weather conditions in the economic forecast.
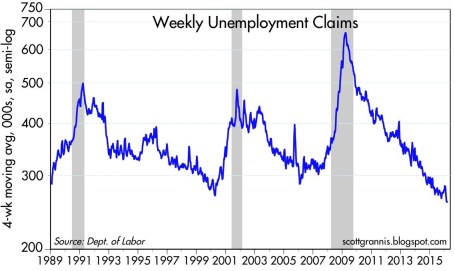
What started out as a cold and blustery January, with stocks posting one of the worst beginning months in history (S&P 500 down -5.1%), quickly thawed out in February and March. Fears over deteriorating economic conditions in the U.S., China along with plummeting oil prices proved fleeting. In fact, as Scott Grannis at Calafia Beach Pundit pointed out, there is no sign of recession in the U.S. as evidenced by a 43-year low in unemployment claims and a 4.9% unemployment rate (see chart below).
As I’ve stated for many years, focusing on the never-ending hurricane of pessimistic headlines is a wasteful use of time and destructive force on performance, if acted upon. Offsetting the downpour of negative news stories are the record low interest rates (now incomprehensibly negative in parts of the globe), which serve as a protective umbrella against the short-term stormy volatility. When investors face the soggy reality of earning a near-0% return on their bank savings and a sub-2% Treasury bond market for 10-year maturities, suddenly a 6-7% earnings yield on stocks certainly looks pretty sunny. There have been very few times in history when dividends earned on stocks have exceeded the payments received on a 10 year Treasury bond, but that is exactly the extreme environment we are living in today. No doubt, if the interest rate climate changes, and rates spike higher, stocks will face a more thunderous environment.
However, fortunately for stock market investors (and unfortunately for savers), this week Federal Reserve Chair Janet Yellen reiterated her forceful view of maintaining interest rates at a low, stimulative level for an extended period of time.
If It Bleeds It Leads – At the Expense of Your Portfolio
Even in the face of European terrorist attacks in Brussels and a turbulent (but entertaining) political presidential election season, the four pillars of earnings, interest rates, valuations, and sentiment are still protecting stock investors from an economic flood (see also Don’t Be a Fool, Follow the Stool). Scary news headlines may sell newspapers and attract advertising dollars, but the real money is made by following the four investing pillars.
Also contributing to a clearer outlook this spring is the steadying value of the U.S. dollar and stabilizing trend realized in oil prices.
For most of 2015, multinational corporations saw their profits squeezed due to a 20-25% spike in the dollar. For example, an auto manufacturer selling a car for $20,000 in the U.S. could suddenly see the price of the same car changed to $25,000 in Europe. Meanwhile, a different German competitor could price a similar car manufactured in their country at the lower $20,000. This all translates into diminished sales and profits for American companies. Mercifully, we are beginning to see these currency headwinds abate, and even begin to shift into a slight tailwind (see 5-year chart below).
Source: barchart.com
From copper and corn to silver and soy beans, commodity prices have been in a downward death spiral over the last five years. And crude oil hasn’t escaped the commodity collapse either…until recently. The supply glut, created by factors like the U.S. shale revolution and new added Iranian post-sanction reserves, led to price declines from a 2009 high of $147 per barrel to a 2016 low of $26. With China and U.S. dollar fears abating, oil prices have bounced about +45% from the 2016 lows to about $38 per barrel.
While the weather has been improving on our shores, not everyone appreciates the fact the U.S. has been the “best house in a bad global neighborhood.” As the chart below shows (February 2016), international stock markets have gone into a bear market (down > -20%) since the 2011 and 2014 peaks, while the U.S. has performed about 100% better. Even in the U.S. market, small-midcap stocks (small & midsize companies) fell about -22% from their 2015 peak before recouping much of the losses.
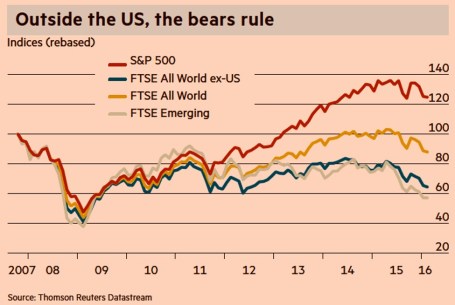
Source: Financial Times
Whether large companies, as measured by the S&P 500 index, which fell about -15% from the peak, suffer a true, technical -20% “bear market” or continue the current seven-year bull market is debatable. Regardless, what we do know is investors survived another cold winter and spring has produced a weather forecast that is currently predicting warmer weather and sunnier economic skies.
Wade W. Slome, CFA, CFP®
Plan. Invest. Prosper.
DISCLOSURE: Sidoxia Capital Management (SCM) and some of its clients hold positions in certain exchange traded funds (ETFs), but at the time of publishing had no direct position in any security referenced in this article. No information accessed through the Investing Caffeine (IC) website constitutes investment, financial, legal, tax or other advice nor is to be relied on in making an investment or other decision. Please read disclosure language on IC Contact page.
Chasing Headlines

It’s been an amazing start to the year. First the market cratered on slowing China economic concerns, domestic recessionary fears, deteriorating oil prices, and negative interest rates abroad. In response to all these worries (and others), stocks dove more than -11% (S&P 500 Index) in January, before settling down. Subsequently, the market has made a screaming recovery, in part due to dovish monetary policy comments (i.e., reduction in forecasted interest rate hikes) and diminished anxiety over a potential global collapse. Month-to-date stocks are up an impressive +5.4%, and year-to-date equities are flattish, or down less than -1%.
With an endless amount of information flowing across our smart phones and computers, it becomes quite easy and tempting to chase news headlines, just like a hyper dog chasing a car. But even once an investor catches up (or reacts) to a headline, there’s confusion around how to profit from the fleeting information. First of all, every plugged-in hedge fund and institutional investor has likely already traded on the stale information you received. Second of all, rarely is the data relevant to the long-term cash generating capabilities of the company or economy. And lastly, the news is more often than not, instantly factored into the stock price. Chasing news headlines only eaves individual investors holding the bag of performance-shattering transactions costs, taxes, and worn-out pricing.
The heightened volatility in late 2015 and early 2016 hasn’t however prevented investors and so-called pundits from attempting to time the market. Any battle-tested investment veteran knows it’s virtually impossible to consistently time the market (see also Market Timing Treadmill), but this fact hasn’t prevented speculators from attempting the feat nonetheless. Famed investment guru, Peter Lynch, who earned an average +29% annual return from 1977-1990, summed it up well when he stated the following:
“Far more money has been lost by investors preparing for corrections, or trying to anticipate corrections, than has been lost in corrections themselves.”
The Important Factors
As I’ve written many times in the past, the keys to long-term stock performance are not knee-jerk reactions to headlines, but rather these following crucial factors (see also Don’t Be a Fool, Follow the Stool):
- Profits
- Interest Rates
- Sentiment
- Valuations
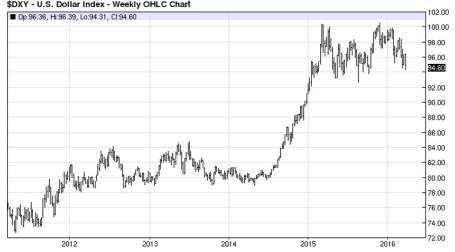
On the profit growth front, corporate income has been pressured by numerous headwinds over the last few years, including an export-shattering increase in the value of the U.S. dollar and a profit-squeezing collapse in energy sector earnings. As you can see from the chart below, the value of the U.S. dollar increased by about 25% from mid-2014 to early-2015, in part because of diverging global central bank policies (more hawkish U.S. Fed vs. more dovish ECB/international central banks). Since that spike, the dollar has settled into a broad range (95 – 100), and the former forceful headwind have now turned into modest tailwinds. This trend is important because an estimated 35-40% of corporate profits are derived from international operations.
Adding insult to injury, the roughly greater than -70% decline in forward energy earnings over the last 18 months has caused a significant hit to overall S&P 500 profits. The tide appears to be finally turning (or at least stabilizing) however, as we’ve seen oil prices rebound by about +30% this year from the lows in January. If these aforementioned trends persist, profit pressures in 2016 are likely to abate significantly, and may actually become additive to growth.
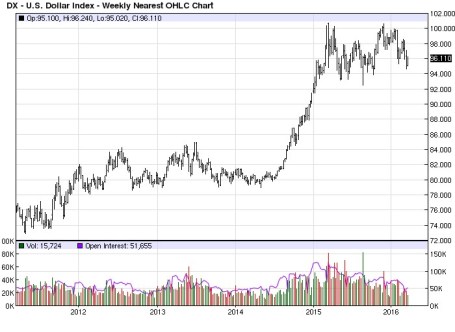
Source: Barchart.com
Profits are important, but so are interest rates. While incessant talk about the path of future Fed policy continues to blanket the airwaves (see also Fed Fatigue), absent a rapid increase in interest rates (say 300-400 basis points), interest rates remain unambiguously positive for equity markets, providing a floor for the oft-repeated volatility in financial markets. As long as stocks are providing higher yields than many bonds, and depositors are earning 0% (or negative rates) on their checking accounts, stocks may remain unloved, but not forgotten.
And speaking of unloved, the sentiment for stocks remains sour. One need look no further than the quarter-billion dollars in hemorrhaging outflows out of U.S. equity funds (see ICI Long-Term Mutual Fund Flows) since 2014. This deep underlying skepticism serves as a positive contrarian indicator for future equity prices. Right now, very few individual investors are swimming in the pool – the time to get out of the stock market pool is when everyone is jumping in.
And lastly, valuations remain very much in line with historical averages (approximatqely 17x 2016 projected earnings), especially considering the generational low in interest rates. Bears continue to point to the elevated CAPE ratio, which has been a disastrous indicator the last seven years (and longer), as a reason to remain cautious. The ironic part is that valuations are virtually guaranteed to improve a few years from now as we roll off the artificially depressed years of 2008-2010.
When you add it all up, zero (or negative) interest rates, combined with the other key factors of profits, sentiment, and valuations, equities remain an important and attractive part of a diversified long-term portfolio. Your objectives, time horizon, and risk tolerance will always drive the proportion of your equity allocation. Nevertheless, some bond exposure is essential to smooth out volatility. Regardless of your investment strategy, chasing headlines, like a dog chasing a car, serves no purpose other than leaving you with a tired, unproductive investment portfolio.
Wade W. Slome, CFA, CFP®
Plan. Invest. Prosper.
DISCLOSURE: Sidoxia Capital Management (SCM) and some of its clients own certain exchange traded funds, but at the time of publishing SCM had no direct position in any other security referenced in this article. No information accessed through the Investing Caffeine (IC) website constitutes investment, financial, legal, tax or other advice nor is to be relied on in making an investment or other decision. Please read disclosure language on IC “Contact” page.
Dolphin or Shark…Time for Concern?

This article is an excerpt from a previously released Sidoxia Capital Management complimentary newsletter (March 1, 2016). Subscribe on the right side of the page for the complete text.
Through the choppy stock market waters of February, investors nervously tried to stay afloat as they noticed a fin cutting through the water. The only problem is determining whether the fin approaching is coming from a harmless dolphin or a ferocious shark? The volatility in 2016 has been disconcerting for many, but a life preserver was provided during the month with the Dow Jones Industrial Average up a modest 50 points (+0.30%).
Remaining calm can be challenging when facing a countless number of ever-changing concerns. Stock investors have caught lots of fish since early 2009 (prices have about tripled), but here are some of the scary headlines (fins) floating out in the financial markets:
- Recession? Overall corporate profits have slowed in the face of plummeting energy prices and the headwind of a strong dollar. However, corporate profit margins remain near record levels and if you exclude the decline in the troubled oil patch, core profits keep chugging along. If an imminent recession were actually on the horizon, you wouldn’t expect to see a 4.9% unemployment rate (8-year low); record auto sales; an improving housing market; and stimulative national gasoline prices at $1.75/gallon (recent recessions have been caused by high energy prices).
- Negative Interest Rates: Would you like to get paid to borrow money? With $6 trillion dollars of negative interest rate bonds in the market (see chart below), that’s exactly what is happening. Just imagine walking into your local Best Buy, and asking the salesman, “Can I borrow $2,000 to buy that big screen TV there…and oh by the way, can you pay me interest every month after you give me the money?” Scary to think many people are panicked over the stock market when they should be more alarmed over negative interest rates. Would you rather earn 6.4% on the average stock (S&P 500 earnings yield) and a 2.2% dividend yield vs negative interest rate bonds? As I always caution investors, even though interest rates are at/near a generational low, diversified portfolios still need exposure to bonds, even if you’re at/near retirement because of the stability they provide. Bonds act like expensive pillows – they are necessary to sleep at night. Although some observers point to negative rates as a sign of a global collapse, low inflation, aggressive foreign central bank monetary policies, and a lingering risk aversion hangover from the 2008-09 financial crisis probably have more to do with the current strange status of interest rates.
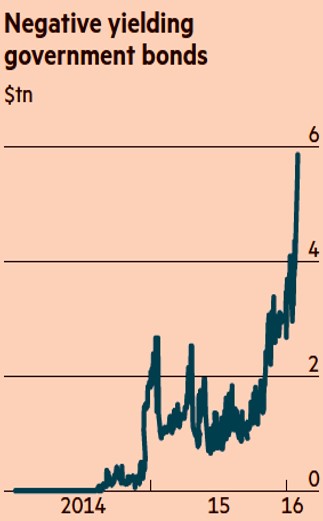
Source: Financial Times
- Political Turbulence: Uncertainty abounds in another election year, just as is the case every other four years. As we head into Super Tuesday, the day in the presidential primary season when the largest number of states hold primary elections, the Republicans are set to battle for approximately half of the delegates necessary to secure the party nomination. The Democrats will be competing for about one-third of the delegates. While many individuals are placing paramount importance on the outcomes of the presidential elections, history teaches us otherwise. The ultimate person elected as president will certainly have a significant impact on the direction of the country, but there are other contributing factors as important (or more important) to economic growth, including the Federal Reserve, and the two houses of Congress. On numerous occasions, I have pointed out the irrelevance of presidential politics (see also Who Said Gridlock is Bad?). As the chart shows below, the past confirms there is no consistency to stock market performance based on political party affiliations. Stocks have performed strongly (and poorly) under both party affiliations.

- Brexit? After lengthy negotiations with EU leaders in Brussels, Britain’s Prime Minister David Cameron set June 23rd as the referendum date for voters to determine whether Britain stays in the European Union. Opinions remain divided (see chart below), but we have seen this movie before with Greece’s threat to leave the EU. As we experienced with the Greece exit (“Grexit”) drama, calmer heads are likely to prevail again. Nevertheless, until the end of June, regrettably we will be forced to listen to continued Brexit fears (see also Brexit article in the Economist for a more thorough review).

- Collapsing Oil Prices: The violent decline in oil prices over the last few years has been swift from about $100/barrel to $34/barrel today. However, the economic slowdown in China, coupled with a stronger U.S. dollar, has led to a broad downfall in commodity prices over the last five years as well. As much as declining demand has hurt commodities and been stimulative for buyers, over-building and excess supply has pressured prices equally. Fortunately, there are signs commodity prices could be in the process of bottoming (see CRB Index).
Financial market volatility in early 2016 has frayed some nerves, and the appearance of swirling fins has many investors wondering whether now’s the time to swim for shore or remain calm and catch the next growth wave. Despite the concerns over a potential recession, negative interest rates, bitter politics, Brexit fears, and depressed oil prices, our economy keeps slowly-but-surely powering forward. While U.S. corporations have been negatively impacted by a strong currency, compressed banking profits (i.e., lower interest rates), and a weak energy sector, S&P 500 companies are rewarding investors by returning a record $1 trillion in dividends and share buybacks (up from $500 million in 2005). When swimming in the current financial markets, you will be better served by swimming with the harmless dolphins rather than panicking over imaginary sharks.
Wade W. Slome, CFA, CFP®
Plan. Invest. Prosper.
DISCLOSURE: Sidoxia Capital Management (SCM) and some of its clients hold positions in certain exchange traded funds (ETFs), but at the time of publishing had no direct position in BBY or any other security referenced in this article. No information accessed through the Investing Caffeine (IC) website constitutes investment, financial, legal, tax or other advice nor is to be relied on in making an investment or other decision. Please read disclosure language on IC Contact page.
Groundhog Day All Over Again

This article is an excerpt from a previously released Sidoxia Capital Management complimentary newsletter (February 1, 2016). Subscribe on the right side of the page for the complete text.
It’s that time of the year when the masses gather in eager anticipation of Groundhog Day to predict whether the furry rodent will see its shadow in 2016, thereby extending winter for an additional six weeks.
In the classic movie Groundhog Day, actor Bill Murray plays character Phil Connors, an arrogant, self-centered TV weatherman who, during an assignment covering the annual Groundhog Day event in Punxsutawney, Pennsylvania, finds himself stuck in a time loop, repeating the same day over and over. With a feeling of nothing to lose, Phil repeatedly decides to indulge in reckless hedonism and criminal behavior. After being resigned to perpetually reliving the same day forever, Phil begins to re-examine his life and falls in love with his co-worker Rita Hanson (see scene here). Ultimately, Phil’s pure focus on the important priorities of life allows himself to break the painful monotonous time loop and win Rita’s love.
Stock market investors are lining up in a similar fashion to predict whether the financial winter experienced in January will persist through the rest of the year. The groundhog, equipped with a thick fur coat, certainly would have been more optimally prepared for the icy January financial market conditions. More specifically, the S&P 500 index declined -5.1% for the month and the Dow Jones fell -5.5%.
Unfortunately for many investors, they too have been trapped in a never-ending news cycle, which painfully buries the public with a monotonous loop of daily pessimistic headlines. As a result of the eternally distorted media cycle, many investors have lost sight of important priorities like Phil Connors. Since the beginning of 2011, the investors who have endured the relentless wave of media gloom have been handsomely rewarded. From 2011-2016, the S&P 500 stock index has ascended approximately 54%, even after accounting for the significant January 2016 decline.
Unless you were burrowed in a hole like a groundhog, you will probably recognize a number of these ominous headlines spanning across the 2011 – 2015 headlines:
- 2011: Debt Downgrade/Debt Ceiling Debate/European PIIGS Crisis (-22% correction)
- 2012: Arab Spring/Greek “Gr-Exit” Fears (-11% correction)
- 2013: Fed Taper Tantrum (-8% correction)
- 2014: Ebola Outbreak (-10% correction)
- 2015: China Slowdown Fears (-13% correction)
Similar to the Groundhog Day movie, the headlines of 2016 match the tone and mood we’ve seen in recent years. Here’s an abbreviated list of the recurring worries-du-jour in January:
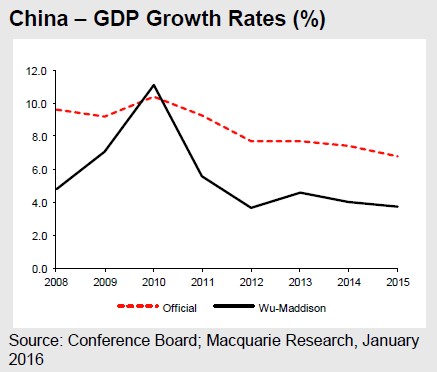
China Slowdown: Is this something new? As you can see from the chart below, China has been slowing since 2010. Due to the law of large numbers, and as the second largest economy on the globe, it is natural to see such an enormous economic engine eventually slow. Rather than panic over China’s slowing, observers should be applauding. China’s Q4 GDP growth recently came in at +6.8%, almost 10x the level recorded by the U.S. in Q4 (+0.7%). Even if you mistrust the official Chinese government’s reported data, our economy would kill for the still impressive independently reported growth statistics (see chart below). While the concerted effort of the political regime to migrate the country from an export-driven economy to a consumption-based one has caused some growing pains, nevertheless in recent months we have seen China report record automobile purchases, retail sales, oil consumption, and industrial production.
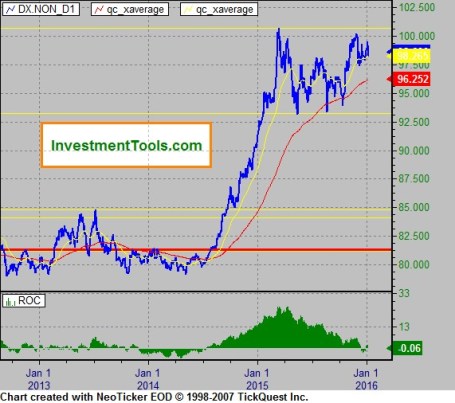
Rise of the U.S. Dollar: This is a legitimate concern that has had tangible negative impacts on the U.S. economy. As you can see from the chart below (blue line), in less than one year, the value of the U.S. dollar spiked by approximately +25%. If you are a multinational company exporting a product to Europe for $100, and consumers wake up a year later having to pay $125 for the same product, it should come as no surprise to anyone that this phenomenon is squeezing profits. The good news is that U.S. corporations have already absorbed the worst of this currency pain dating back to early 2015, so if the stabilizing foreign exchange trends remain near current levels, as they have over the last year, there should be no additional economic drag.
Oil Prices Down: Somehow the U.S. media is trying to convince the public that lower oil prices are bad for the economy. Yes, it is true, the financial restructurings and lost jobs associated with oil price declines will hurt the economy and the banks overall. However, the benefits of lower oil prices on the broader economy (i.e., more money in consumers’ pockets) is unambiguously positive and will overwhelm any indirect damage. Every penny decrease in gasoline prices (now roughly $1.83 per gallon nationally) equates to about a $1 billion tax cut for consumers (see chart below). Many people are worried about oil prices being a signal of weakness, but if you look at the last few recessions, they were all preceded by an oil price spike, not a price collapse.
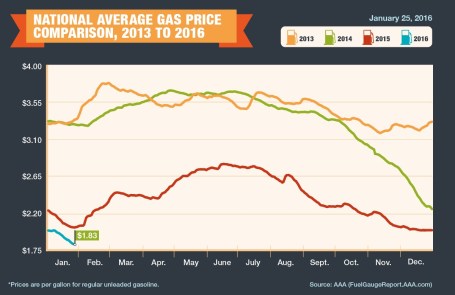
Source: AAA
Federal Reserve Monetary Policy: The first interest rate hike in nine years took place in 2015, but that did not prevent investors from fretting about the timing of the next interest rate hike. As I’ve written many times (see Fed Fatigue Setting In), the Fed has barely budged its target rate to 0.375%, so this is much to do about nothing. Wake me up when we get to 2.00%, at which point we will still be far below the long-term average but at a more meaningful level (see chart below).
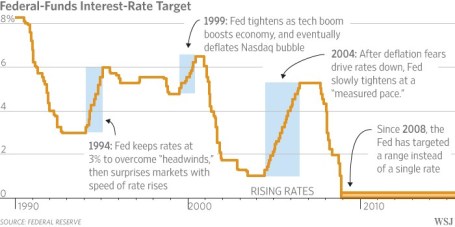
Source: The Wall Street Journal
Presidential Elections: Congress’s approval rating is abysmal, but like it or not, primary season is just starting and we are stuck in a presidential election cycle until the second Tuesday of November. Guess what? If you want to know the impact of the elections on the financial markets, then I will give you the short answer…it just does not matter who gets elected. History shows us that the markets go up and down under both Republican and Democratic parties. If you are comparing the track record on the political parties’ track record on debt creation, it is a mixed bag as well (see chart below). Arguably, in half the cases, the nomination of the Federal Reserve chairs will have as large (or larger) an impact than the elected president. If you were to factor in the inevitable splits in Congress to the equation, the result is gridlock. I have contended for some time that gridlock is a positive outcome because it structurally forces a lid on disciplined government spending (see Who Said Gridlock is Bad?). If this isn’t a good enough explanation, see Barry Ritholtz’s take on the subject of politics and the stock market…I couldn’t sum it up any better (click here)
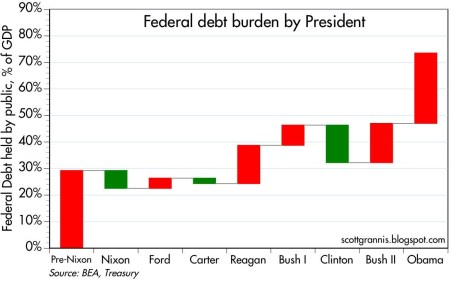
Source: Calafia Beach Pundit
Fortunately for groundhogs, and long-term investors, dealing with challenging and volatile climates is nothing new. Both burrowing marmots and emotional investors need to adapt to ever-changing environments…sunny or overcast. In addition to a cold 2016 start, January was also a chilly month in 2014 and 2015, with the S&P 500 down -3.6% and -3.1%, respectively. Despite this seasonal sour sentiment, there is a silver lining. In both instances (2014 & 2015), the market rebounded significantly in subsequent months after the slow start at the beginning of the year. For the remainder of the year, the S&P advanced +15.5% in 2014, and +2.5% in 2015.
In Groundhog Day the movie, Bill Murray relived the same day over and over again, and repeated the same missteps until he learned from his mistakes. Long-term investors will be served best by applying this same philosophy to their investments. Like a groundhog, investors have a tendency to become scared of their own shadows. It’s easy to succumb to the infinite time loop of worrisome headlines, but rather than burrowing away in hibernation, creating a diversified, low-cost, tax-efficient portfolio customized for your specific time horizon, risk tolerance, and liquidity needs is a better way of celebrating this year’s Groundhog Day.
Wade W. Slome, CFA, CFP®
Plan. Invest. Prosper.
DISCLOSURE: Sidoxia Capital Management (SCM) and some of its clients hold positions in certain exchange traded funds (ETFs), but at the time of publishing had no direct position in any other security referenced in this article. No information accessed through the Investing Caffeine (IC) website constitutes investment, financial, legal, tax or other advice nor is to be relied on in making an investment or other decision. Please read disclosure language on IC Contact page.
Have Peripheral Colds Caused a U.S. Recession Flu?

At the trough of the recent correction, which was underscored by a brief but sharp -1,100 point drop in the Dow Jones Industrial Average, the Dow had temporarily corrected by -16.2% from its peak in May, earlier this year. Whether we retest or break below the 15,370 level again is debatable, but with the Dow almost reaching “bear market” (-20%) territory, it begs the question of whether the U.S. has caught a recessionary flu from the ill international markets’ colds?
Certainly, several factors have investors concerned about a potential recession, including the following: slowing growth and financial market instability in China; contraction of -0.4% in Japan’s Q2 GDP growth; and turmoil in emerging markets like Russia and Brazil. With stock prices down more than double digits, it appears investors factored in a significant chance of a recession occurring. Although the Tech Bubble of 2000 and generational Great Recession of 2008-2009 were no ordinary recessions, your more garden variety recessions like the 1980 and 1990 recessions resulted in peak to trough declines in the Dow Jones Industrial Average of -20.5% and -22.5%, respectively.
In other words, with the Dow recently down -16.2% in three months, investors were awfully close to factoring in a full blown U.S. recession. Should this be the case? In answering this question, one must certainly understand the stock market is a predicting or discounting mechanism. However, if we pull out our economic thermometers, right now there are no definitive indicators sending us to the recessionary doctor’s office. Here are a number of the indicators to review.
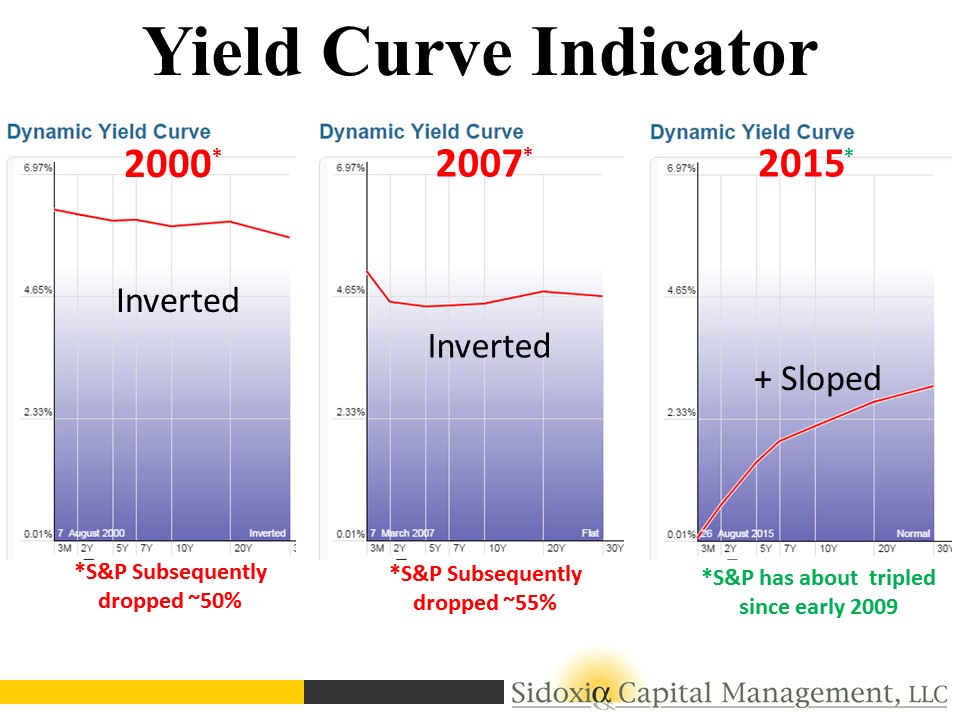
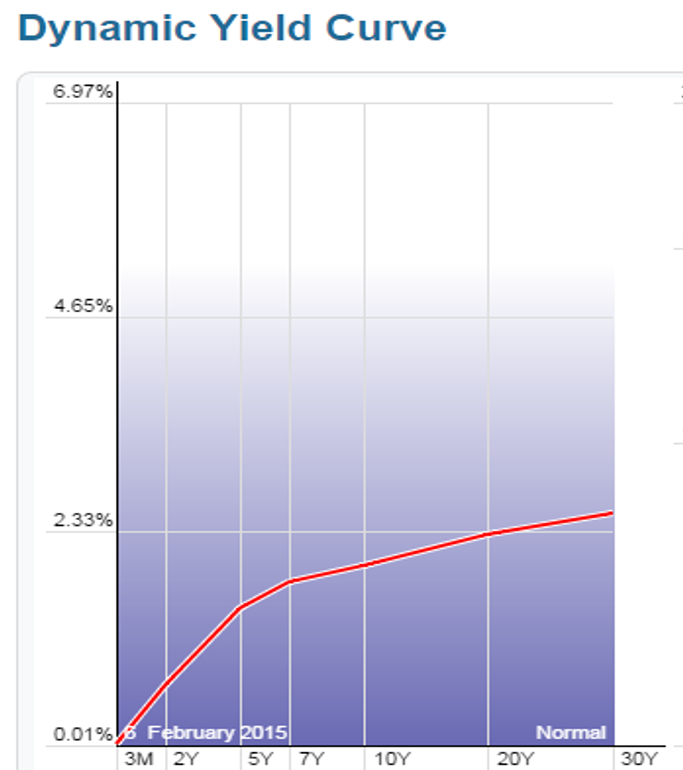
Yield Curve Indicator
For starters, let’s take a look at the yield curve. Traditionally, in a normally expanding economy, we would normally expect inflationary expectations and a term premium for holding longer maturity bonds to equate to a positively shaped yield curve (e.g., shorter term 2-Year Treasuries with interest rates lower than 30-Year Treasuries). Interestingly, historically an inverted yield curve (shorter term interest rates are higher than longer term rates) has been an excellent leading indicator and warning signal for unhealthy stock market conditions forthcoming.
As you can see in the charts below, before the two preceding recessions, in the years 2000 and 2007, we experienced an inverted yield curve that served as a tremendous warning signal in advance of significant downdrafts in stock prices. If you fast forward to today, the slope of the yield curve is fairly steeply sloped – nowhere close to inverted. When the yield curve flattens meaningfully, I will become much more cautious.
The Oil Price Indicator
There is substantial interest and focus on the recessionary conditions in the energy sector, and more specifically the high yield (junk bond) issuers that could suffer. It is true that high yield energy credit spreads have widened, but typically this sector’s pain has been the economy’s gain, and vice versa. The chart below shows that the gray shaded recessionary time periods have classically been preceded by spikes upward in oil prices. As you know, we currently are experiencing the opposite trend. Over the last 12 months, WTI oil prices have been chopped by more than half to $45 per barrel. This is effectively a massive tax for consumers, which should help support the economy.
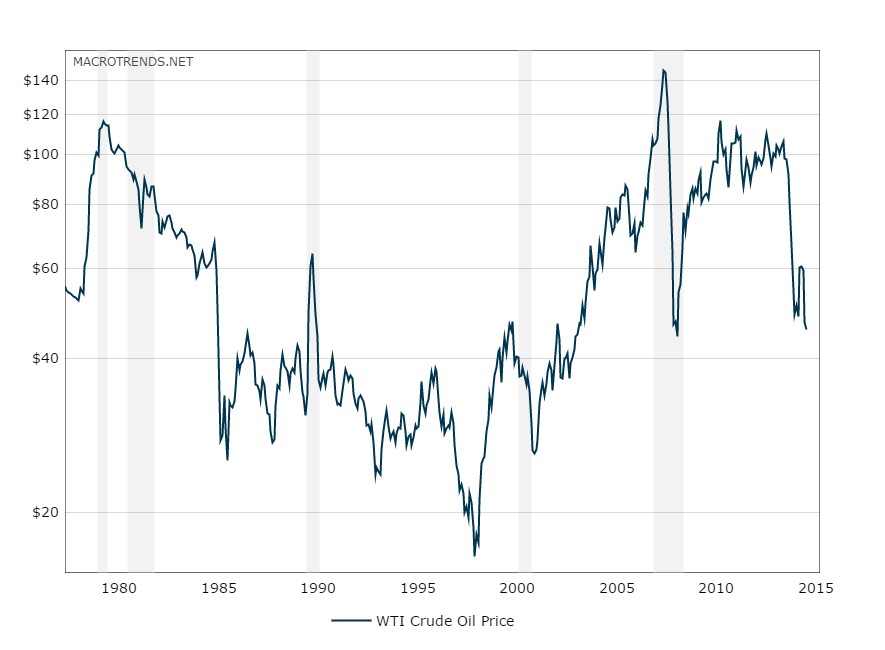
Source: MacroTrends.Net
Other Macro Statistics
Toward the top of any recession-causing, fear factor list right now is China. Slowing economic growth and an unstable Shanghai stock market has investors nervously biting their nails. Although China is the 2nd largest global economy behind the U.S., China still only accounts for about 15% of overall global economic activity, and U.S. exports to the region only account for about 0.7% of our GDP, according to veteran Value investor Bill Nygren. If on top of the China concern you layer a fairly strong U.S. labor market, an improving housing market (albeit slowly), and a recently revised higher GDP statistics, you could probably agree the economic dashboard is not signaling bright red flashing lights.
There is never a shortage of concerns to worry about, including most recently the slowing growth and stock market turbulence in China. While volatility may be implying sickness and international markets may be reaching for the Kleenex box, the yield curve, oil prices, and other macroeconomic indicators are signaling the outlook for U.S. stock remains relatively healthy.

Wade W. Slome, CFA, CFP®
Plan. Invest. Prosper.
DISCLOSURE: Sidoxia Capital Management (SCM) and some of its clients hold positions in certain exchange traded funds (ETFs) , but at the time of publishing, SCM had no direct position in any other security referenced in this article. No information accessed through the Investing Caffeine (IC) website constitutes investment, financial, legal, tax or other advice nor is to be relied on in making an investment or other decision. Please read disclosure language on IC Contact page.
Is Good News, Bad News?

The tug-of-war is officially on as investors try to decipher whether good news is good or bad for the stock market? On the surface, the monthly January jobs report released by the Bureau of Labor Statistics (BLS) appeared to be welcomed, positive data. Total jobs added for the month tallied +257,000 (above the Bloomberg consensus of +230,000) and the unemployment rate registered 5.7% thanks to the labor participation rate swelling during the month (see chart below). More specifically, the number of people looking for a job exceeded one million, which is the largest pool of job seekers since 2000.
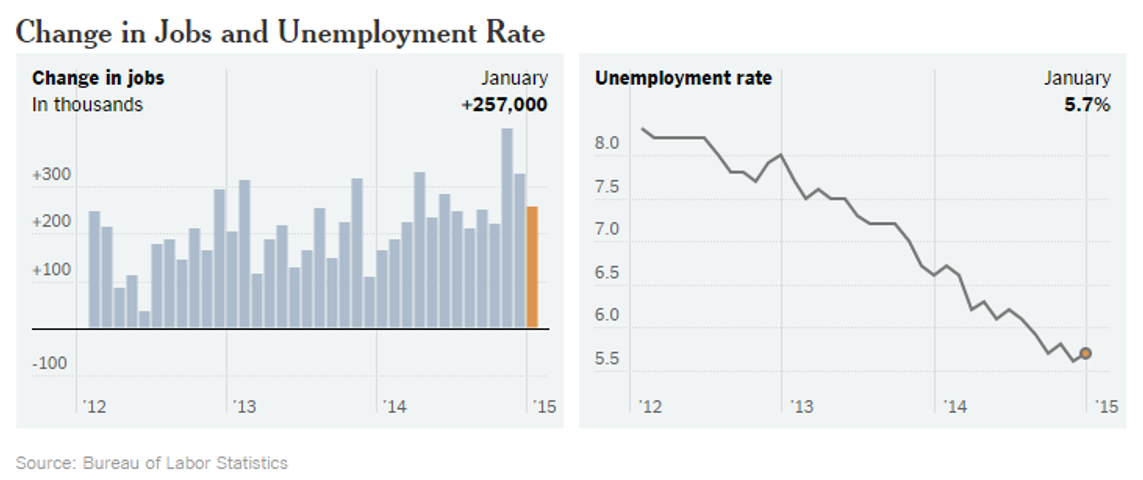
Source: BLS via New York Times
Initially the reception by stocks to the jobs numbers was perceived positively as the Dow Jones Industrial index climbed more than 70 points on Friday. Upon further digestion, investors began to fear an overheated employment market could lead to an earlier than anticipated interest rate hike by the Federal Reserve, which explains the sell-off in bonds. The yield on the 10-Year Treasury proceeded to spike by +0.13% before settling around 1.94% – that yield compares to a recent low of 1.65% reached last week. The initial euphoric stock leap eventually changed direction with the Dow producing a -180 point downward reversal, before the Dow ended the day down -62 points for the session.
Crude Confidence?
The same confusion circling the good jobs numbers has also been circulating around lower oil prices, which on the surface should be extremely positive for the economy, considering consumer spending accounts for roughly 70% of our country’s economic output. Lower gasoline prices and heating bills means more discretionary spending in the pockets of consumers, which should translate into more economic activity. Furthermore, it comes as no surprise to me that oil is both figuratively and literally the lubricant for moving goods around our country and abroad, as evidenced by the Dow Jones Transportation index that has handily outperformed the S&P 500 index over the last 18 months. While this may truly be the case, many journalists, strategists, economists, and analysts are nevertheless talking about the harmful deflationary impacts of declining oil prices. Rather than being viewed as a stimulative lubricant to the economy, many of these so-called pundits point to low oil prices as a sign of weak global activity and an omen of worse things to come.
This begs the question, as I previously explored a few years ago (see Good News=Good News?), is it possible that good news can actually be good news? Is it possible that lower energy costs for oil importing countries could really be stimulative for the global economy, especially in regions like Europe and Japan, which have been in a decade-long funk? Is it possible that healthier economies benefiting from substantial job creation can cause a stingy, nervous, and scarred corporate boardrooms to finally open up their wallets to invest more significantly?
Interest Rate Doom May Be Boom?
Quite frankly, all the incessant, never-ending discussions about an impending financial market Armageddon due to a potential single 0.25% basis point rate hike seem a little hyperbolic. Could I be naively whistling past the graveyard? From my perspective, although it is a foregone conclusion the Fed will have to increase interest rates above 0%, this is nothing new (I’m really putting my neck out there on this projection). Could this cause some volatility when it finally happens…of course. Just look at what happened to financial markets when former Federal Reserve Chairman Ben Bernanke merely threatened investors with a wind-down of quantitative easing (QE) in 2013 and investors had a taper tantrum. Sure, stocks got hit by about -5% at the time, but now the S&P 500 index has catapulted higher by more than +25%.
Looking at how stocks react in previous rate hike cycles is another constructive exercise. The aggressive +2.50% in rate hikes by former Fed Chair Alan Greenspan in 1995 may prove to be a good proxy (see also 1994 Bond Repeat?). After suffering about a -10% correction early in 1994, stocks rallied in the back-half to end the year at roughly flat.
And before we officially declare the end of the world over a single 0.25% hike, let’s not forget that the last rate hike cycle (2004 – 2006) took two and a half years and 17 increases in the targeted Federal Funds rate (1.00% to 5.25%). Before the rate increases finally broke the stock market’s back, the bull market moved about another +40% higher…not too shabby.
Lastly, before writing the obituary of this bull market, it’s worth noting the yield curve has been an incredible leading indicator and currently this gauge is showing zero warnings of any dark clouds approaching on the horizon (see chart below). As a matter of fact, over the last 50 years or so, the yield curve has turned negative (or near 0%) before every recession.
Source: StockCharts.com
As the chart above shows, the yield curve remains very sloped despite modest flattening in recent quarters.
While many skeptics are having difficulty accepting the jobs data and declining oil prices as good news because of rate hike fears, history shows us this position could be very misguided. Perhaps, once again, this time around good news may actually be good news.
Wade W. Slome, CFA, CFP®
Plan. Invest. Prosper.
DISCLOSURE: Sidoxia Capital Management (SCM) and some of its clients hold positions in certain exchange traded funds (ETFs), but at the time of publishing SCM had no direct position in any other security referenced in this article. No information accessed through the Investing Caffeine (IC) website constitutes investment, financial, legal, tax or other advice nor is to be relied on in making an investment or other decision. Please read disclosure language on IC Contact page.
After 2014 Stock Party, Will Investors Have a 2015 Hangover?

This article is an excerpt from a previously released Sidoxia Capital Management complementary newsletter (January 2, 2015). Subscribe on the right side of the page for the complete text.
Investors in the U.S. stock market partied their way to a sixth consecutive year of gains during 2014 (S&P 500 +11.4%; Dow Jones Industrial Average +7.5%; and NASDAQ +13.4%). From early 2009, at the worst levels of the crisis, the S&P 500 has more than tripled – not too shabby. But similar to recent years, this year’s stock bubbly did not flow uninterrupted. Several times during the party, neighbors and other non-participants at the stock party complained about numerous concerns, including the Fed Tapering of bond purchases; the spread of the deadly Ebola virus; tensions in Ukraine; the rise of ISIS; continued economic weakness across the eurozone; the decline of “The Fragile Five” emerging markets (Brazil, India, Indonesia, Turkey and South Africa), and other headline grabbing stories to name just a few. In fact, the S&P 500 briefly fell -10% from its mid-September level to mid-October before a Santa Claus rally pushed the index higher by +4% in the last quarter of the year.
Even though the U.S. was partying hardy in 2014, it was not all hats and horns across all segments of the market. Given all the geopolitical trepidation and sluggish economic growth abroad, international markets as measured by the Total World Stock ETF (VT) gained a paltry +1.2% for the year. This dramatic underperformance was also seen in small capitalization stocks (Russell 2000 Index ETF – IWM), which only rose +3.7% last year, and the Total Bond Market (BND), which increased +2.9%.
Despite these anxieties and the new Federal Reserve Chairwoman Janet Yellen removing the Quantitative Easing (QE) punchbowl in 2014, there were still plenty of festive factors that contributed to gains last year, which should prevent any hangover for stocks going into 2015. As I wrote in Don’t Be a Fool, corporate profits are the lifeblood for stock prices. Fortunately for investors, the news on this front remains positive (see chart below). As strategist Dr. Ed Yardeni pointed out a few weeks ago, profit growth is still expected to accelerate to +9.3% in 2015, despite the recent drag from plummeting oil prices on the energy sector.
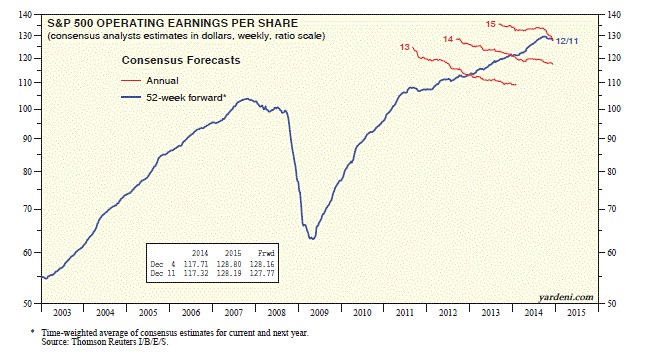
Source: Dr. Ed’s Blog
While a -50% decline in oil prices may depress profits for some energy companies, the extra discretionary spending earned by consumers from $2.24 per gallon gasoline at the pump has been a cheery surprise. This consumer spending tailwind, coupled with the flow-through effect to businesses, should provide added stimulative benefit to the economy in 2015 too. Let’s not forget, this economic energy boost comes on the heels of the best economic growth experienced in the U.S. in over a decade. More specifically, the recently reported third quarter U.S. GDP (Gross Domestic Product) statistics showed growth accelerating to +5%, the highest rate seen since 2003.
Another point to remember about lower energy prices is how this phenomenon positively circulates into lower inflation and lower interest rate expectations. If energy prices remain low, this only provides additional flexibility to the Federal Reserve’s monetary policy decisions. With the absence of any substantive inflation data, Chairwoman Yellen can remain “patient” in hitting the interest rate brakes (i.e., raising the Federal Funds rate) in 2015.
Geographically, our financial markets continue to highlight our country’s standing as one of the best houses in a sluggish global growth neighborhood. Not only do we see this trend in our outperforming stock indexes, relative to other countries, but we also see this in the rising value of the U.S. dollar. It is true that American exports become less competitive internationally in a strong dollar environment, but from an investment standpoint, a rising dollar makes U.S. stock markets that much more attractive to foreign investors. To place this dynamic into better perspective, I would note the U.S. Dollar index rose by approximately +13% in 2014 against a broad basket of currencies (including the basket case Russian Rouble). With the increasing likelihood of eurozone Quantitative Easing to take place, in conjunction with loose monetary policies in large developed markets like Japan, there is a good chance the dollar will continue its appreciation in the upcoming year.
On the political front, despite the Republicans winning a clean sweep in the midterm elections, we should still continue to expect Washington gridlock, considering a Democrat president still holds the all-important veto power. But as I have written in the past (see Who Said Gridlock is Bad?), gridlock has resulted in our country sitting on a sounder financial footing (i.e., we have significantly lower deficits now), which in turn has contributed to the U.S. dollar’s strength. At the margin however, one can expect any legislation that does happen to get passed by the Republican majority led Congress will likely be advantageous for businesses and the stock market.
When Will the Party End?
What could cause the party to come to a screeching halt? While I can certainly point out some obvious potential negative scenarios (e.g., European financial mayhem, China economic speed bump, interest rate spike), history shows us it is usually unforeseen events (surprises) that cause significant downdrafts in stock market prices. The declines rarely come from factors you read in current newspaper headlines or hear on television.
Just like any party, this year is likely to include high points and low points in the financial markets – and of course some lull periods mixed in as well. However, with the economy improving and risk appetites increasing, we are bound to see more party poopers on the sidelines come join the celebration in 2015. It will be a while before the cops arrive and stop the party, so there should be plenty of time to prepare for any hypothetical hangover.
Wade W. Slome, CFA, CFP®
Plan. Invest. Prosper.
DISCLOSURE: Sidoxia Capital Management (SCM) and some of its clients own a range of positions, including positions in certain exchange traded funds positions (including BND), but at the time of publishing SCM had no direct position in VT, IWM or any other security referenced in this article. No information accessed through the Investing Caffeine (IC) website constitutes investment, financial, legal, tax or other advice nor is to be relied on in making an investment or other decision. Please read disclosure language on IC Contact page.


