Posts tagged ‘Las Vegas’
Sports, Stocks, & the Magic Quadrants

Picking stocks is a tricky game and so is sports betting. With the NFL and NCAA football seasons only a few months away, we can analyze the professional sports-betting industry to better understand the complexities behind making money in the stock market. Anybody who has traveled to Las Vegas, and bet on a sporting event, understands that simply choosing a game winner is not enough for a casino to pay you winnings. You also need to forecast how many points you think a certain team will win or lose by (i.e., the so-called “spread”) – see also What Happens in Vegas, Stays on Wall Street. In the world of stocks, winning/losing is not measured by spreads but rather equities are measured by valuation (e.g., Price/Earnings or P/E ratios).
To make my point, here is a sports betting example from some years back:
Florida Gators vs. Charleston Southern Buccaneers: Without knowing a lot about the powerhouse Southern Buccaneers squad from South Carolina, 99% of respondents polled before the game are likely to unanimously select the winner as Florida – a consistently dominant, nationally ranked powerhouse program. The tougher question becomes trickier if football observers are asked, “Will the Florida Gators win by more than 63 points?”(see picture below). Needless to say, although the Buccs kept it close in the first half, and only trailed by 42-3 at halftime, the Gators still managed to squeak by with a 62-3 victory. Importantly, if you had bet on this game and placed money on the Florida Gators, the overwhelming pre-game favorite, the 59 point margin of victory would have resulted in a losing wager. In order for Gator fans to win money, they would have needed Florida to win by 64 points.

If investing and sports betting were easy, everybody would do it. The reason sports betting is so challenging is due to very intelligent statisticians and odds-makers that create very accurate point spreads. In the investing world, a broad swath of traders, market makers, speculators, investment bankers, and institutional/individual investors set equally efficient valuations over the long-term.
The goal in investing is very similar to sports betting. Successful professionals in both industries are able to consistently identify inefficiencies and then exploit them. Inefficiencies occur for a bettor when point spreads are too high or low, while investors identify inefficient prices in the marketplace by shorting expensive stocks and buying cheap stocks (i.e., undervalued or overvalued).
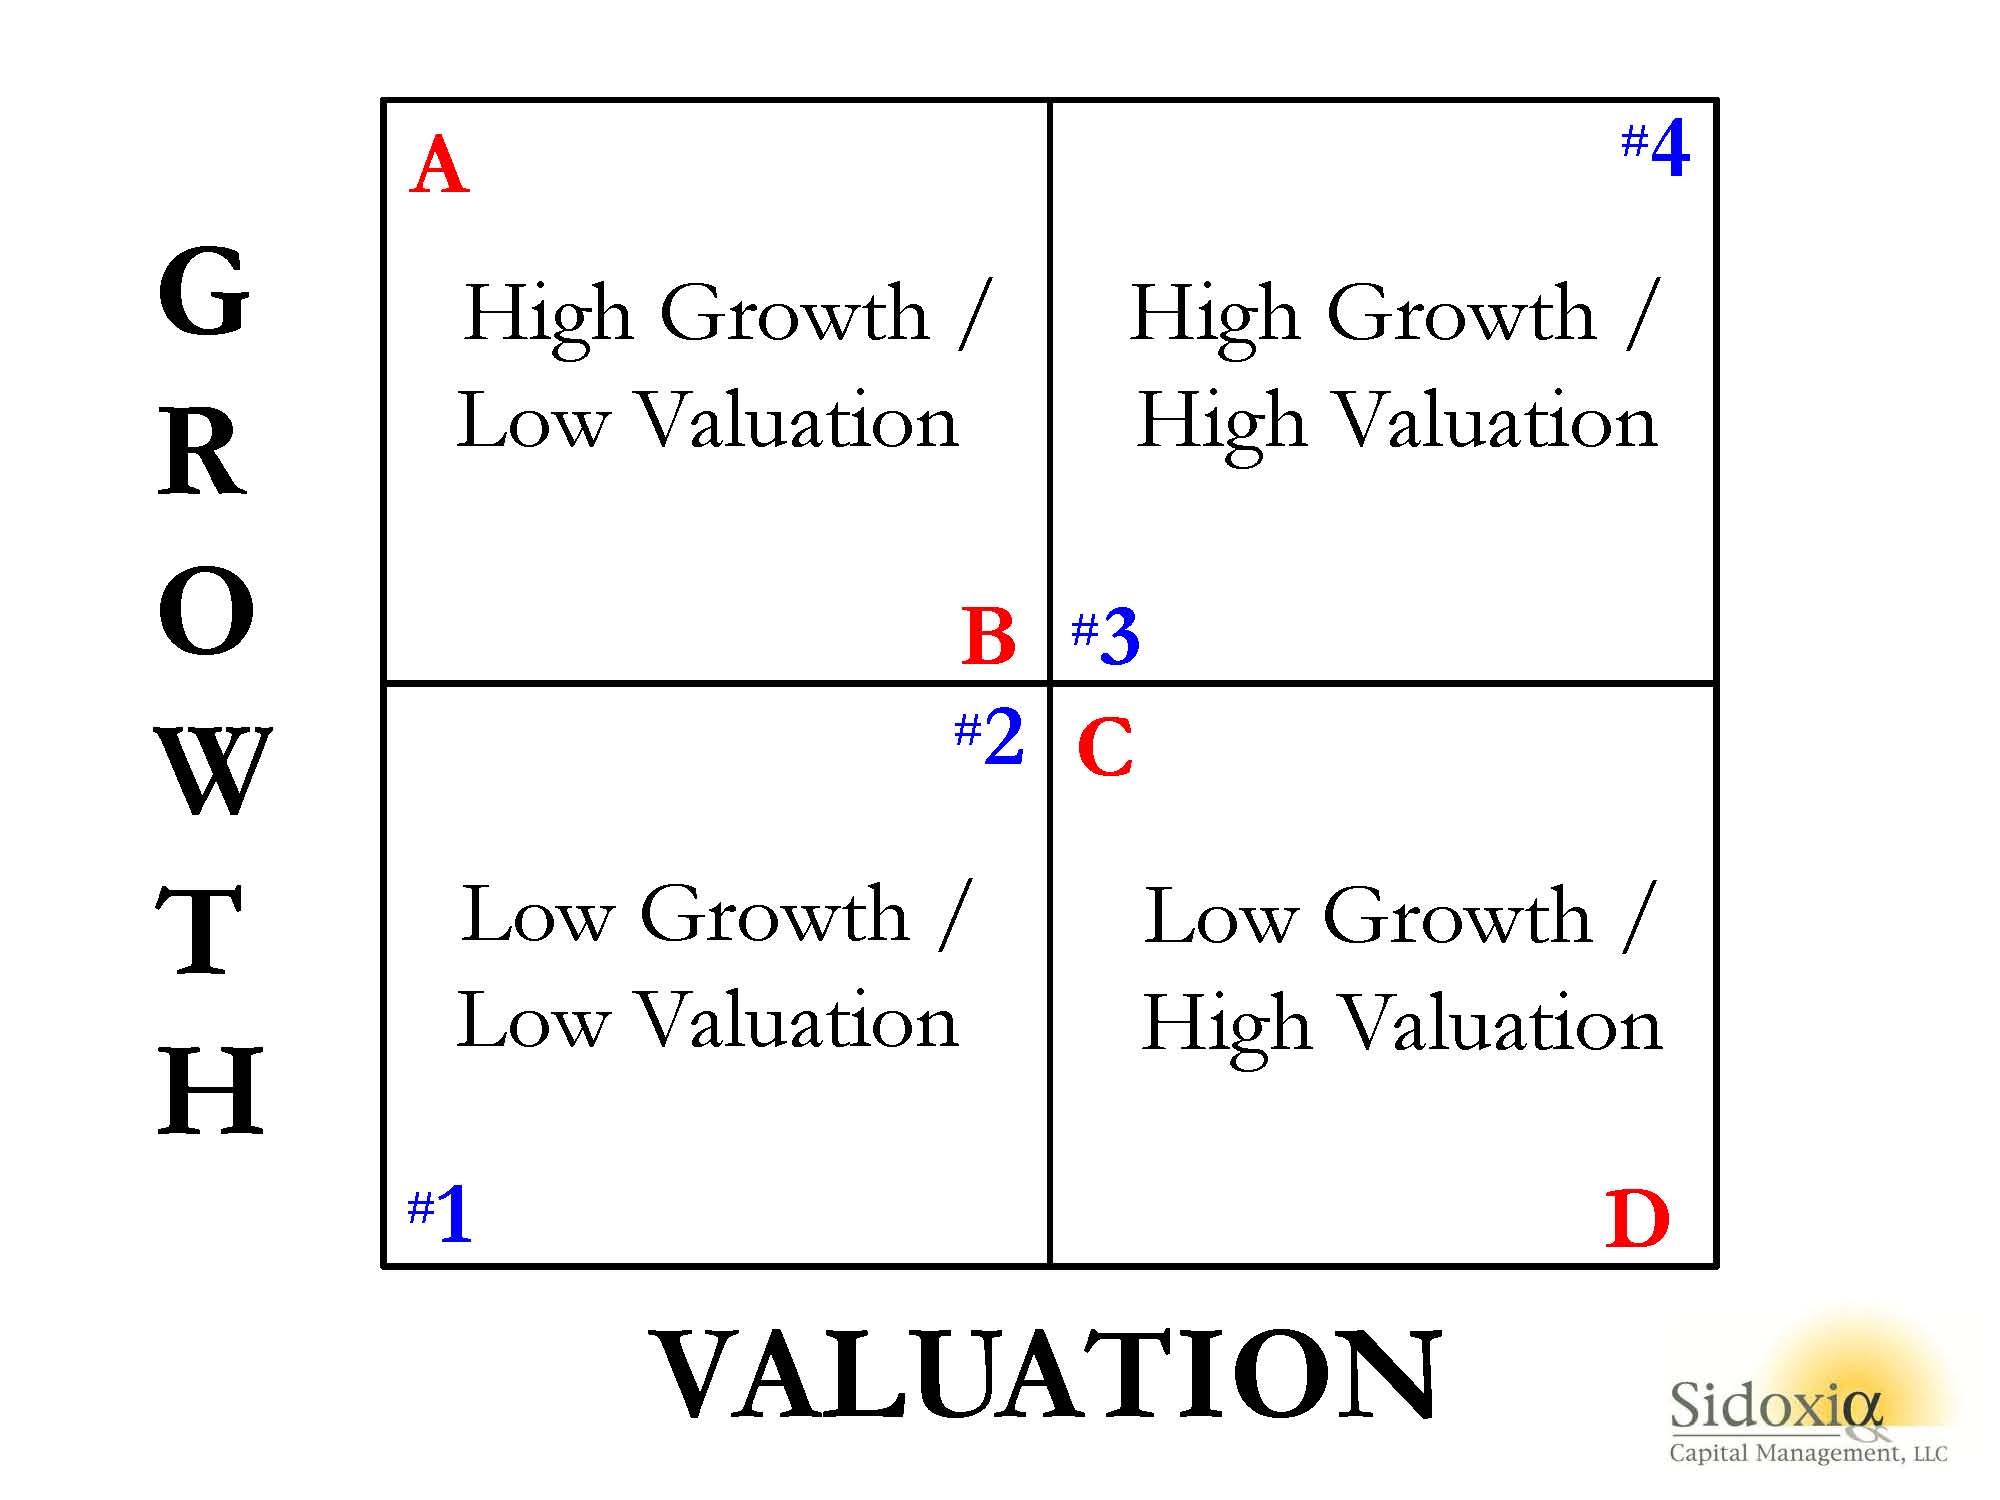
To illustrate my point, let’s take a look at Sidoxia’s “Magic Quadrant“:
 A-B-Cs & 1-2-3s
What Sidoxia’s “Magic Quadrant” demonstrates is a framework for evaluating stocks. By devoting a short period of time reviewing the quadrants, it becomes apparent fairly quickly that Stock A is preferred over Stock B, which is preferred over Stock C, which is preferred over Stock D. In each comparison, the former is preferred over the latter because the earlier letters all have higher growth, and lower (cheaper) valuations. The same relative attractive relationships cannot be applied to stocks #1, #2, #3, and #4. Each successive numbered stock has higher growth, but in order to obtain that higher growth, investors must pay a higher valuation. In other words, Stock #1 has an extremely low valuation with low growth, while Stock #4 has high growth, but an investor must pay an extremely high valuation to own it.
While debating the efficiency of the stock market can escalate into a religious argument, I would argue the majority of stocks fall in the camp of #1, #2, #3, or #4. Or stated differently, you get what you pay for. For example, investors are paying a much higher valuation (high P/E) for Tesla Motors, Inc (TSLA) for its rapid electric car growth vs. paying a much lower valuation (low P/E) for Pitney Bowes Inc (PBI) for its more mature mail equipment business.
The real opportunities occur for those investors capable of identifying companies in the upper-left quadrant (i.e., Stock A) and lower-right quadrant (i.e., Stock D). If the analysis is done correctly, investors will load up on the undervalued Stock A and aggressively short the expensive Stock D. Sidoxia has its own proprietary valuation model (Sidoxia Holy Grail Ranking – SHGR or a.k.a. “SUGAR”) designed specifically to identify these profitable opportunities.
The professions of investing and sports betting are extremely challenging, however establishing a framework like Sidoxia’s “Magic Quadrants” can help guide you to find inefficient and profitable investment opportunities.

Wade W. Slome, CFA, CFP®
Plan. Invest. Prosper.
DISCLOSURE: Sidoxia Capital Management (SCM) and some of its clients hold positions in certain exchange traded funds (ETFs) and TSLA, but at the time of publishing, SCM had no direct position in PBI, or any other security referenced in this article. No information accessed through the Investing Caffeine (IC) website constitutes investment, financial, legal, tax or other advice nor is the information to be relied on in making an investment or other decision. Please read disclosure language on IC Contact page.
Sports, Stocks, & the Magic Quadrants
Picking stocks is a tricky game and so is sports betting. With the NFL and NCAA football seasons swinging into full gear, understanding the complexity of making money in the stock market can be explained in terms of professional sports-betting. Anybody who has traveled to Las Vegas and bet on a sporting event, understands that choosing a winner of a game simply is not enough…you also need to forecast how many points you think a certain team will win by (see also What Happens in Vegas, Stays on Wall Street). In the world of sports, winning/losing is measured by point spreads. In the world of stocks, winning/losing is measured by valuation (e.g., Price/Earnings ratios).
To make my point, here is a sports betting example from a handful years back:
Florida Gators vs. Charleston Southern Buccaneers (September 2009): Without knowing a lot about the powerhouse Southern Buccaneers squad from South Carolina, 99% of respondents, when asked before the game who would win, would unanimously select Florida – a consistently dominant, national franchise, powerhouse program. The question becomes a little trickier when participants are asked, “Will the Florida Gators win by more than 63 points?” Needless to say, although the Buccs kept it close in the first half, and only trailed by 42-3 at halftime, the Gators still managed to squeak by with a 62-3 victory. Worth noting, had you selected Florida, the overwhelming favorite, the 59 point margin of victory would have resulted in a losing wager (see picture below).
If investing and sports betting were easy, everybody would do it. The reason sports betting is so challenging is due to very intelligent statisticians and odds-makers that create very accurate point spreads. In the investing world, a broad swath of traders, market makers, speculators, investment bankers, and institutional/individual investors set equally efficient valuations.
The goal in investing is very similar to sports betting. Successful professionals in both industries are able to consistently identify inefficiencies and then exploit them. Inefficiencies occur for a bettor when point spreads are too high or low, while investors identify inefficient prices in the marketplace (undervalued or overvalued).
To illustrate my point, let’s take a look at Sidoxia’s “Magic Quadrant“:
A-B-Cs & 1-2-3s
What Sidoxia’s “Magic Quadrant” demonstrates is a framework for evaluating stocks. By devoting a short period of time reviewing the quadrants, it becomes apparent fairly quickly that Stock A is preferred over Stock B, which is preferred over Stock C, which is preferred over Stock D. In each comparison, the former is preferred over the latter because the earlier letters all have higher growth, and lower (cheaper) valuations. The same relative attractive relationships cannot be applied to stocks #1, #2, #3, and #4. Each successive numbered stock has higher growth, but in order to obtain that higher growth, investors must pay a higher valuation. In other words, Stock #1 has an extremely low valuation with low growth, while Stock #4 has high growth, but an investor must pay an extremely high valuation to own it.
While debating the efficiency of the stock market can escalate into a religious argument, I would argue the majority of stocks fall in the camp of #1, #2, #3, or #4. Or stated differently, you get what you pay for. For example, investors are paying a much higher valuation (~100x 2014 P/E) for Tesla Motors, Inc (TSLA) for its rapid electric car growth vs. paying a much lower valuation (~10x 2014 P/E) for Pitney Bowes Inc (PBI) for its mature mail equipment business.
The real opportunities occur for those investors capable of identifying companies in the upper-left quadrant (i.e., Stock A) and lower-right quadrant (i.e., Stock D). If the analysis is done correctly, investors will load up on the undervalued Stock A and aggressively short the expensive Stock D. Sidoxia has its own proprietary valuation model (Sidoxia Holy Grail Ranking – SHGR or a.k.a. “SUGAR”) designed specifically to identify these profitable opportunities.
The professions of investing and sports betting are extremely challenging, however establishing a framework like Sidoxia’s “Magic Quadrants” can help guide you to find inefficient and profitable investment opportunities.
Wade W. Slome, CFA, CFP®
Plan. Invest. Prosper.
DISCLOSURE: Sidoxia Capital Management (SCM) and some of its clients hold positions in certain exchange traded funds (ETFs), but at the time of publishing, SCM had no direct position in TSLA, PBI, or any other security referenced in this article. No information accessed through the Investing Caffeine (IC) website constitutes investment, financial, legal, tax or other advice nor is the information to be relied on in making an investment or other decision. Please read disclosure language on IC Contact page.
“De-Risking” – It’s All Greek to Me

Source: Photobucket
In the classic comedy Animal House John Belushi (who played the character Bluto) gave new meaning to the Greek toga party (who cares if the Romans actually invented the garment?). Belushi also added some flare to Sam Cooke’s timeless song, Wonderful World:
“Don’t know much about history
Don’t know much biology
Don’t know much about the science book
Don’t know much about the French I took.”
Another line should have been added: “Don’t know much about Wall Street jargon.”
“Derisking” – New Wall Street Word Du Jour
Wading through and keeping up with the ever expanding dictionary of Wall Street lingo and acronyms can be a difficult task – much like deciphering the Greek writings of Plato, the famous ancient philosopher.
A recent term repeated constantly by CNBC commentators and hedge fund managers at the annual SALT (SkyBridge Alternatives) conference in Las Vegas, Nevada deserves some more attention…“derisking.” Elegant, simple, chic, and yes, pure B.S. Why not use “mis-risking,” “un-risking,” “dis-risking?” I suppose when charging people 2 and 20 (a 2% management fee plus 20% of profits above a hurdle), one must try to make the most prosaic terms and expressions sound mysterious and dazzling.
Asking one hedge fund manager after another, CNBC commentator David Faber continually asked managers at the May conference what investing strategies were being employed. Faber asked Marc Lasry, CEO and Co-Founder of Avenue Capital Group, the following:
“I have spoken to number of other large hedge fund managers this morning. Derisking, that’s what they are all talking about Marc. So, given that, are you derisking at all?”
Translation: “The market is going down, so are you following all the other lemmings and becoming more conservative because of the panicked-induced headlines we’re shoveling 24/7?”
Glenn Dubin, Co-Founder and CEO of Highbridge Capital Management, a hedge fund company owned by JP Morgan (JPM) got in the “derisking” mood too: “At this point…we are seeing massive de-risking.”
At the time of the SALT conference, European economic concerns were top of mind for all the fast-money traders, as fears of a credit contagion spreading from Greece to larger countries like Italy and Spain felt more palpable to many. Some nine weeks later, the European bank stress tests have been completed, some overseas economic indicators have come in better than anticipated (i.e., U.K. GDP, German business confidence, exports), and some European markets are up about +10% from the “derisking” phase. So, I wonder what those same hedge funds and traders are doing now?
Perhaps they are “rerisking?” I just made that one up out of thin air, but if I hear “rerisking” on CNBC or see it in the Wall Street Journal, I demand a credit in the Merriam-Webster dictionary, or a citation in Wikipedia at a minimum.
The “derisking” wave did not stop at the SALT conference, but remains alive and well today. In fact, a conference has been created in its honor: The 3rd Annual De-Risking Strategies Summit for Pension Funds, Foundations, and Endowments on October 25 – 27, 2010 in New York.
Obviously, this is just one of many terms, acronyms, and euphemisms that the Wall Street machine is constantly churning out. If “derisking” doesn’t float your boat, then why not try on a “swaption” and “straddle” or “contango” and “crawling peg?”
If the never-ending list of Wall Street jargon is weighing you down and a financial professional is speaking Greek to you with confusing financial terminology, then do yourself a favor and slap that person into silence. More often than not, these financial concepts can be explained to a fifth grader (or Bluto). Unfortunately, a convoluted combination of jargon and acronyms is often used in an attempt to impress the listener. The result is usually confusion and a blank stare.
If you are frustrated with learning the language of Wall Street, you are not alone. I recommend you “derisk” your education by adding Greek 101 to your coursework. If you are going to be confused, you might as well do it with a gyro and some Ouzo in hand.
Wade W. Slome, CFA, CFP®
Plan. Invest. Prosper.
*DISCLOSURE: Sidoxia Capital Management (SCM) and some of its clients own certain exchange traded funds, but at the time of publishing SCM had no direct position in JPM or any security referenced in this article. No information accessed through the Investing Caffeine (IC) website constitutes investment, financial, legal, tax or other advice nor is to be relied on in making an investment or other decision. Please read disclosure language on IC “Contact” page.


