Posts tagged ‘interest rates’
Will Rising Rates Murder Market?

After an obituary of Mark Twain had been mistakenly published in the United States, Twain sent a cable from London stating, “The reports of my death have been greatly exaggerated.” Similar reports about the death of the stock market have been prematurely published as well. If you were to listen to the talking heads on TV or other self-proclaimed media pundits, the prevailing opinion is that rising interest rates will murder the stock market. In reality, the benchmark 10-Year Treasury Note has risen a whopping 0.23% so far this year. Could this be a start of a more prolonged increase in interest rates? It is certainly possible. Most investors have a very short memory because we have seen this movie before. It was just two short years ago that we witnessed a near doubling of 10-Year Treasury yields exploding from 1.76% to 3.03% in 2013. Did the stock market crater? In fact, quite the contrary. The S&P 500 index catapulted higher by a whopping +30%.
Even if we go back a litter further in recent history, interest rates were quite a bit higher. For example in early 2010, 10-Year Treasury yields breached 4.0%. Where was the Dow Jones Industrial index then? A mere 11,000 vs 17,850 today. Or in other words, when interest rates were significantly higher than today’s 2.40% yield, the stock market managed to climb +62% higher. Not too shabby, eh? As I have talked about in the past (see Don’t Be a Fool, Follow the Stool), there are other factors besides interest rates that are contributing to positive stock returns – primarily profits, valuations, and sentiment are the other key factors in determining stock prices. Suffice it to say, over the last five years, stocks have survived quite well in the face of multiple interest rate spikes; the 2013 “Taper Tantrum”; and the subsequent completion of quantitative easing – QE (see chart below).
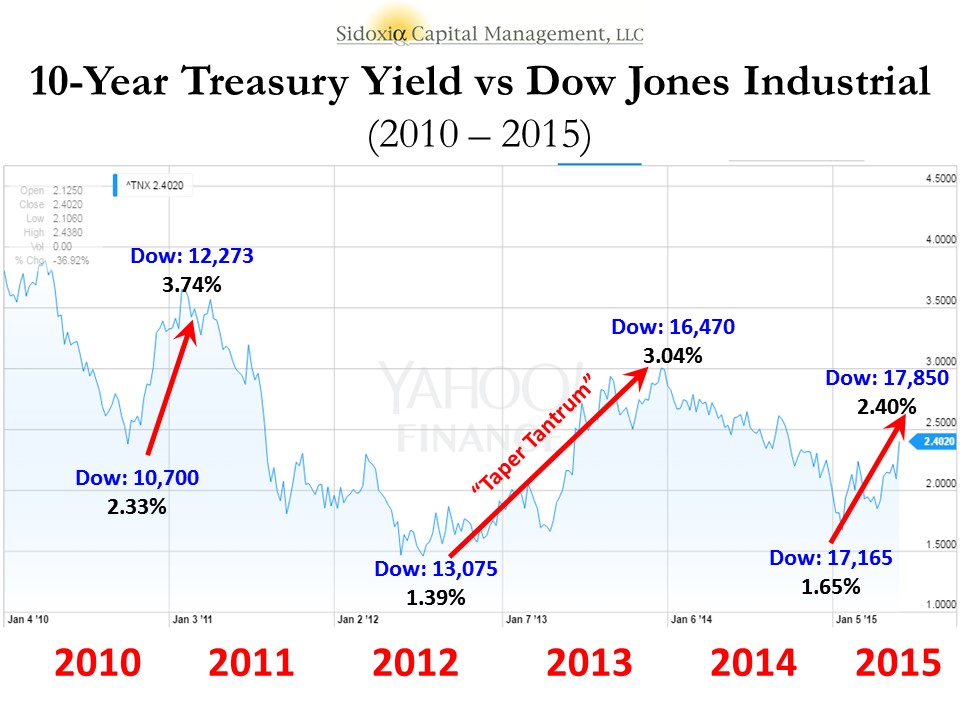
Underlying Chart: Yahoo Finance!
Yield Curve on the Side of Bulls
Despite the trepidation over a series of potential Fed rate hikes, stocks continue to grind higher. If the fears are based on the expectation of a slowing economy on the horizon, then we would generally see two things happening. First, rising short-term interest rates would cause the yield curve to flatten, and then secondly, the yield curve would invert (typically a leading indicator for a recession). Currently, there are no signs of flattening or inverting. Actually, the recent better than expected jobs report for May (280,000 jobs added vs. estimate of 226,000) created a steeper yield curve – long-term interest rates increased more than short-term interest rates. Just as I wrote in 2009 about the recovery (see Steepening Yield Curve Recovery), right now the bond market is flashing recovery…not slowdown.
In the face of the mini-interest rate spike, bank stocks are also signaling economic recovery – evidenced by the 2.75% surge in the KBW Bank Index (KBX) last week. If there were signs of dark clouds on the horizon, a flattening yield curve would squeeze bank net interest margins and profits, which ultimately would send bank investors to the exit. That phenomenon will eventually happen later in the economic cycle, but right now investors are voting in the opposite direction with their dollars.
The media, economists, strategists, and other nervous onlookers will continue fretting over the Federal Reserve’s eventual rate increases. As long as dovish Janet Yellen is at the helm of the Fed, future rate increases will be measured, and rather than murdering the stock market, the policies will merely reflect a removal of the economy from artificial life support.

Wade W. Slome, CFA, CFP®
Plan. Invest. Prosper.
DISCLOSURE: Sidoxia Capital Management (SCM) and some of its clients hold positions in certain exchange traded funds (ETFs), but at the time of publishing, SCM had no direct position in any other security referenced in this article. No information accessed through the Investing Caffeine (IC) website constitutes investment, financial, legal, tax or other advice nor is to be relied on in making an investment or other decision. Please read disclosure language on ICContact page.
U.S. Takes Breather in Windy Economic Race

This article is an excerpt from a previously released Sidoxia Capital Management complementary newsletter (May 1, 2015). Subscribe on the right side of the page for the complete text.
Looking back, in the race for financial dominance, the U.S. economy sprinted out to a relatively quick recovery from the 2008-2009 financial crisis injury compared to its other global competitors. The ultra-loose monetary policies implemented by the Federal Reserve (i.e., zero percent Fed Funds rate, quantitative easing – QE, Operation Twist, etc.) and the associated weakening in the value of the U.S. dollar served as tailwinds for growth. The low interest rate byproduct created cheaper borrowing costs for consumers and businesses alike for things like mortgages, refinancings, stock buybacks, and infrastructure investments. The cheaper U.S. dollar also helped domestically based, multinational companies sell their goods abroad at more attractive prices.
However, those positive dynamics have now changed. With the end of stimulative bond buying (QE) and threats of imminent interest rate hikes coming from the Federal Reserve and its Chairwoman Janet Yellen, the tailwinds for the U.S. economy have now transitioned into headwinds. The measly +0.2% growth recently reported in the 1st quarter – Gross Domestic Product (GDP) results are evidence of an economy currently sucking wind (see chart below).
As it relates to the stock market, the Dow Jones crept up +0.4% for the month of April to 17,841, and is essentially flat for all of 2015. Small Cap stocks in the Russell 2000® Index (companies with an average value of $2 billion – IWM), pulled a muscle in April as shown by the index’s -2.6% tumble. A slight increase in the yield of the 10-Year Treasury to 2.05% caused bond prices to contract a modest -0.5% for the month.
Beyond a strengthening dollar and threats of rising interest rates, debilitating port strikes on the West Coast and abnormally cold weather especially back east also contributed to weak trade data and sub par economic performance. Although a drop in oil and gasoline prices should ultimately be stimulative for broader consumer and industrial activity, the immediate negative impacts of job losses and declining drilling in the energy sector added to the drag on 1st quarter GDP results.
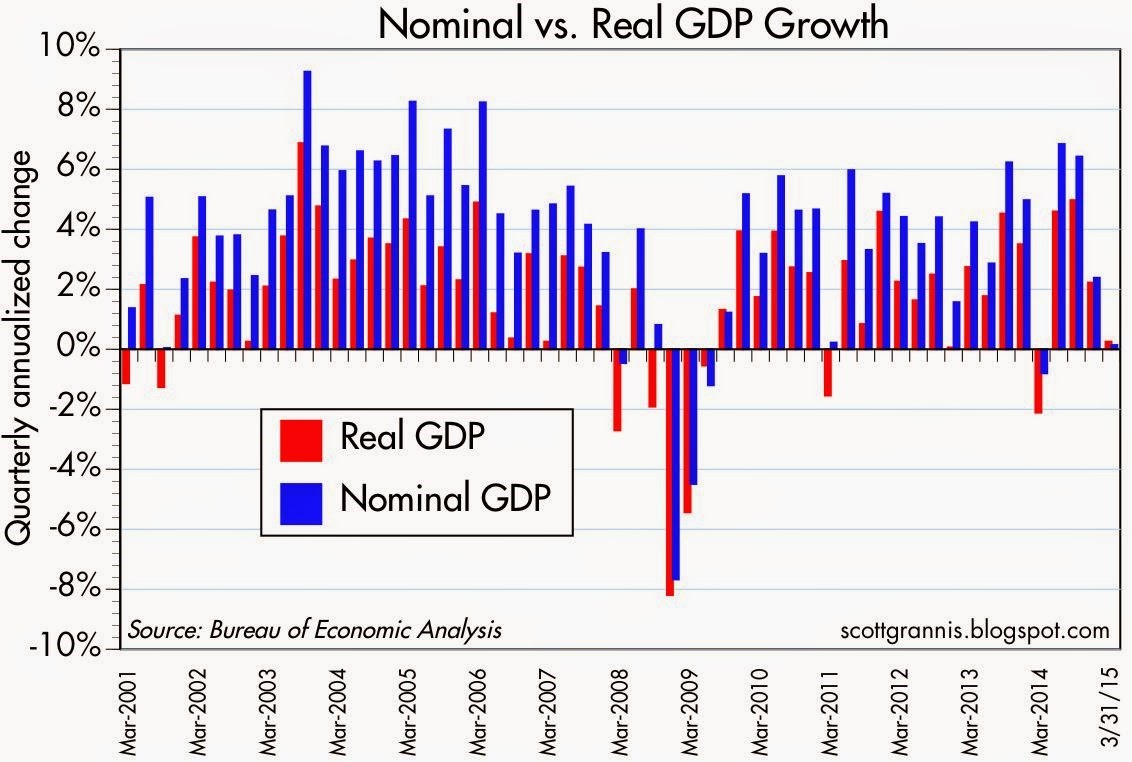
Source: Scott Grannis (Calafia Beach Pundit)
The good news is that many of the previously mentioned negative factors are temporary in nature and should self-correct themselves as we enter the 2nd quarter. One positive aspect to our country’s strong currency is cheaper imports. So, as the U.S. recovers from its temporary currency cramps, foreigners will continue pumping out cheap exports to Americans for purchase. If this import phenomenon lasts, these lower priced goods, coupled with discounted oil prices, should keep a lid on broader inflation. The benefit of lower inflation means the Federal Reserve is more likely to postpone slamming the brakes on the economy with interest rate hikes. The decision of when to lift interest rates will ultimately be data-dependent. Due to the lousy 1st quarter numbers, it will probably take some time for economic momentum to reemerge, and therefore the Fed is unlikely to raise interest rates until September, at the earliest.
The great thing about financial markets and economics is many of these swirling monetary winds eventually self-correct themselves. And during April, we saw these self-correcting mechanisms up close and in person. For example, from March 2014 to March 2015 the U.S. dollar appreciated in value by about +25% versus the euro currency (FXE). However, from the peak exchange rate seen this March, the value of the U.S. dollar declined by about -7%. The same self-correcting principle applies to the oil market. From the highs reached in mid-2014 at about $108 per barrel, crude oil prices plunged by about -60% to a low of $42 per barrel in March. Since then, oil prices have recovered significantly by spiking over +40% to about $60 per barrel today.
Competitors Narrow the Gap with the U.S.
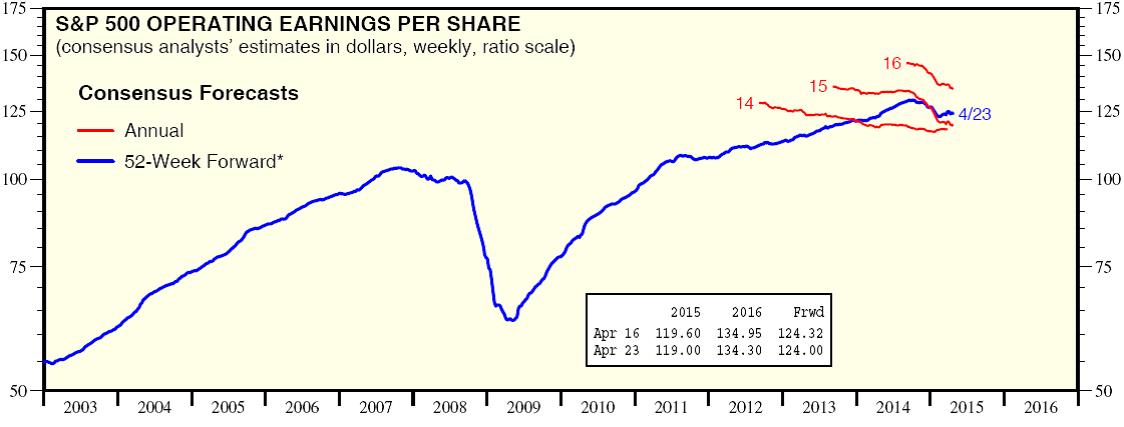
Source: Dr. Ed Yardeni
As I’ve written many times in the past, one of the ultimate arbiters of stock price performance is the long-term direction of corporate profits. And as you can see from the chart above, profits have hit a bump in the road after a fairly uninterrupted progression over the last six years. The decline is nowhere near the collapse of 2008-2009, but given the rise in stock prices, investors should be prepared for the bears and skeptics to become more vocal.
And while the U.S. has struggled a bit, European and Asian shares have advanced significantly. To that point, Asian equities (FXI) spiked an impressive +16% in April (see chart below) and European stocks jumped a respectable +4% (VGK) over the same timeframe.
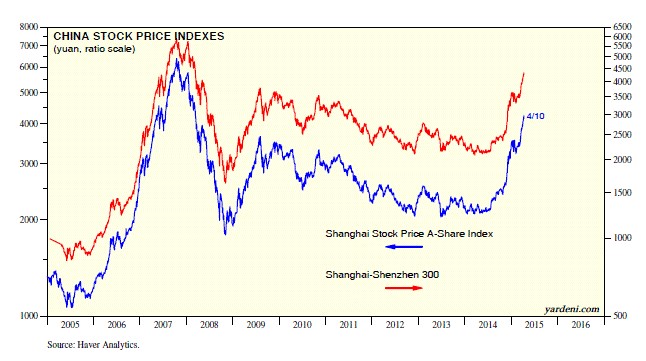
Source: Dr. Ed’s Blog
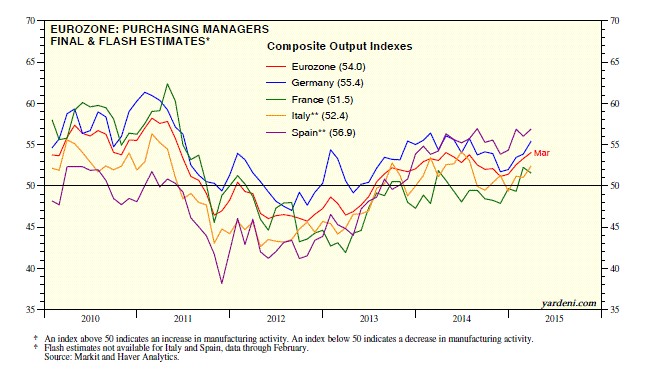
Bolstering the advance in China’s shares has been the Chinese central bank’s move to cut the amount of cash that banks must hold as reserves (“reserve requirements”). The action by the central bank is designed to spur bank lending and combat slowing growth in the world’s second largest economy. The Europeans are not sitting idly on their hands either. European central bankers have taken a cheat sheet page from the U.S. playbook and have introduced their own form of trillion dollar+ quantitative easing (see Draghi Provides Beer Goggles) in hopes of jump starting the European economy. Given the moves, how is the European business activity picture looking? Well, based on the Eurozone Purchasing Managers’ Index (PMI), you can see from the chart below that the region is finally growing (readings > 50 indicate expansion).
Source: Dr. Ed’s Blog
The economic winds in the global race for growth have been swirling in all directions, and due to temporary headwinds, the dominating lead of the U.S. has narrowed. Fortunately for long-term investors, they understand investing is a marathon and not a sprint. Holding a globally balanced and diversified portfolio will help you maintain the stamina required for these volatile and windy economic times.
Wade W. Slome, CFA, CFP®
Plan. Invest. Prosper.
DISCLOSURE: Sidoxia Capital Management (SCM) and some of its clients hold positions in certain exchange traded funds (ETFs), FXI, VGK, and a short position in FXE, but at the time of publishing, SCM had no direct position in IWM, or any other security referenced in this article. No information accessed through the Investing Caffeine (IC) website constitutes investment, financial, legal, tax or other advice nor is to be relied on in making an investment or other decision. Please read disclosure language on IC Contact page.
“Patient” Prick Proves More Pleasure than Pain

I will be the first one to admit I hate needles. In fact, I’ve been known to skip my annual flu shots out of cowardice simply to avoid the harmless prick of the syringe. The mere thought of a long needle jabbing into my arm, or other fleshy part of my body, has had the chilling effect of generating irrational decisions (i.e., I forgo flu shot benefits for no logical reason).
For months the talking heads and so-called pundits have speculated and fretted over the potential removal of the term “patient” from the periodically issued Federal Open Market Committee (FOMC) statement. Since the end of 2014, the statement read that the Fed “can be patient in beginning to normalize” monetary policy.
For investors, the linguistic fear of the removal of “patient” is as groundless as my needle fears. In the financial markets, the consensus view is often wrong. The stronger the euphoric consensus, the higher the probability the consensus will soon be wrong. You can think of technology in the late 1990s, real estate in the mid-2000s; or gold trading at $1,800/oz in 2011. The reverse holds true for the pessimistic consensus. Value guru, extraordinaire, Bill Miller stated it well,
“Stocks do not get undervalued unless somebody is worried about something. The question is not whether there are problems. There are always problems. The question is whether those problems are already fully discounted or not.”
Which brings us back to the Fed’s removal of the word “patient”. Upon release of the statement, the Dow Jones Industrial index skyrocketed about 400 points in 30 minutes. Considering the overwhelming consensus was for the Fed to remove the word “patient”, and given the following favorable factors, should anyone really be surprised that the market is trading near record highs?
FAVORABLE FACTORS:
- Queen Dove Yellen as Fed Chairwoman
- Declining interest rates near generational low
- Stimulative, low oil prices that are declining
- Corporate profits at/near record highs
- Unemployment figures approaching cyclical lows
- Core inflation in check below 2% threshold
While the short-term relief rally may feel good for the bulls, there are still some flies in the ointment, including a strong U.S. dollar hurting trade, an inconsistent housing recovery, and a slowing Chinese economy, among other factors.
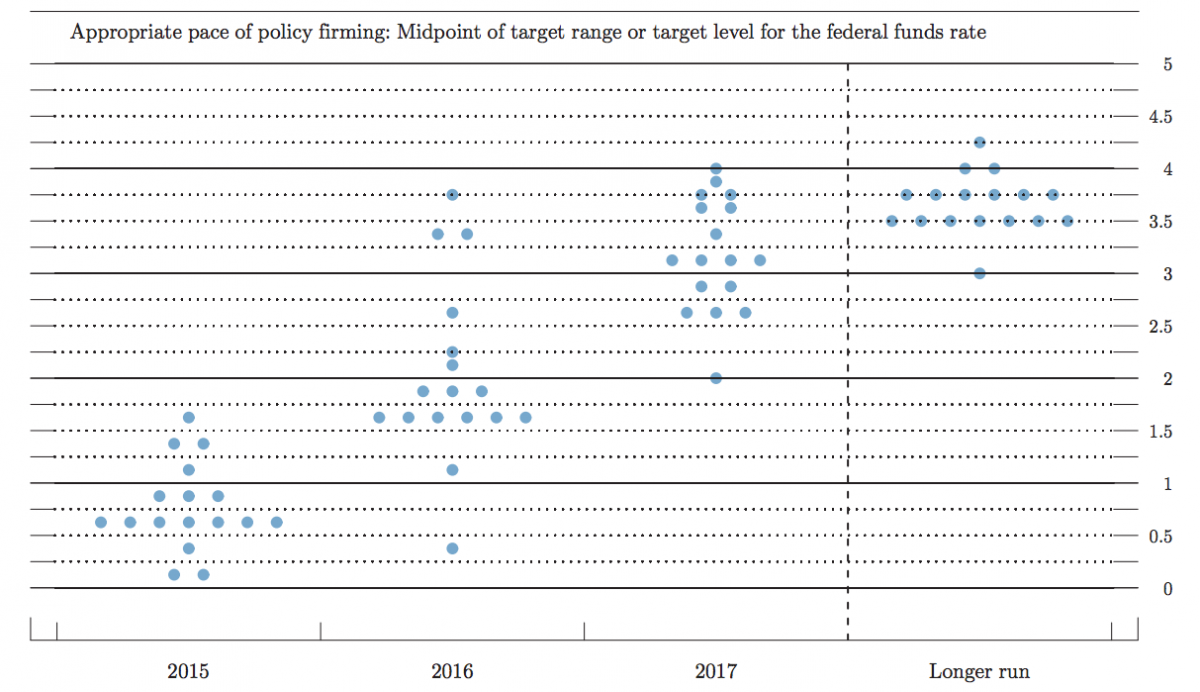
Outside the scandalous “patient” semantics was the heated debate over the Fed’s “Dot Plot,” which is just a 3rd grader’s version of showing the Fed members’ Federal Funds rate forecasts. While to a layman the chart below may look like an elementary school dot-to-dot worksheet, in reality it is a good synopsis of interest rate expectations. Part of the reason stocks reacted so positively to the Fed’s statement is because the “Dot Plot” median interest rate expectations of 0.625% came down 0.50% for 2015, and by more than 0.60% for 2016 to 1.875%. This just hammers home the idea that there are currently no dark clouds looming on the horizon that would indicate aggressive rate hikes are coming.
Source via BusinessInsider
These sub-2% interest rate expectations over the next few years hardly qualify as a “hawkish” stance. As I’ve written before, the stock market handled a 2.5% hike in stride when the Fed Funds rate increased in 1994 (see also 1994 Bond Repeat or Stock Defeat?). What’s more, the Fed Funds rate cycle peaked at 5.0% in 2007 before the market crashed in the Great Recession of 2008-2009.
Although volatility is bound to increase as the Federal Reserve transitions out of a six-year 0% interest rate policy, don’t let the irrational fear of a modest Fed hike prick scare you away from potential investment benefits.
Wade W. Slome, CFA, CFP®
Plan. Invest. Prosper.
DISCLOSURE: Sidoxia Capital Management (SCM) and some of its clients hold positions in certain exchange traded funds (ETFs), but at the time of publishing, SCM had no direct position in any other security referenced in this article. No information accessed through the Investing Caffeine (IC) website constitutes investment, financial, legal, tax or other advice nor is to be relied on in making an investment or other decision. Please read disclosure language on IC Contact page.
Here Comes the Great Rotation…Finally?

For decades interest rates have continually gravitated to zero like flies attracted to stink. For a split second in 2013, as long-term U.S. Treasury rates about doubled from 1.5% to 3.0% before reversing, it appeared the declining rate cycle could finally be broken. At the time, pundits of all types were calling for the “great rotation” out of bonds into stocks. Half of this forecast came to fruition as stocks grinded to record highs in 2014, but even I the big stock bull admittedly did not expect interest rates on 10-year Switzerland bonds to turn negative (see also Draghi QE Beer Goggles), especially after U.S. quantitative easing (QE) came to an end.
With rates already at a generational low, how could anyone be expected to accept a measly 0.3% annual return for a whole decade? Well, that’s exactly what’s happening in massive developed markets like Germany and Japan. While investors and retirees are painted into a corner by being forced to accept near-0% interest payments, savvy corporate borrowers are taking advantage of this once in a lifetime opportunity. Take for example the recently unprecedented $1.35 billion Switzerland bond issuance by Apple Inc. (AAPL), which included a tranche of bonds maturing in 2024 that yielded a paltry 0.25%.
With bonds offering lower and lower yield possibilities for investors of all stripes, at Sidoxia we are still finding plenty of opportunities in stocks, especially in high dividend-paying equity investments. In the U.S., the average S&P 500 stock is yielding approximately the same as the 10-Year Treasury Note (2.0%), but in other parts of the world, equity markets such as the following are offering significantly higher yields:
- iShares MSCI Australia (Yield 5.0% – EWA)
- Europe FTSE Europe (Yield: 4.6% – VGK)
- Market Vectors Russia (Yield 4.6% – RSX)
- iShares MSCI Brazil (Yield 4.0% – EWZ)
- iShares MSCI Sweden (Yield 3.8% – EWD)
- iShares MSCI Malaysia (Yield 3.8% – EWM)
- iShares MSCI Singapore (Yield 3.4% – EWS)
- iShares China (Yield 2.5% – FXI)
A New “Great Rotation” in 2015?
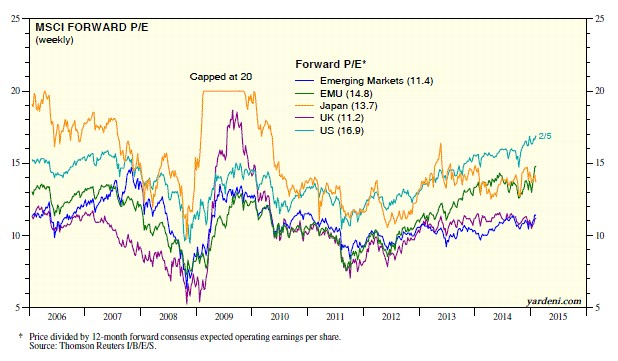
If you look at the 2014 ICI (Investment Company Institute) fund flow data, it becomes clear the great rotation out of bonds into U.S. stocks has not occurred. More specifically, despite the S&P 500 index reaching new record highs, -$60 billion flowed out of U.S. stock funds last year, and about +$44 billion flowed into all bond funds. Could the “great rotation” out of bonds into stocks finally happen in 2015? Certainly, this scenario is a possibility, but given the barren bond yield environment, perhaps the new “great rotation” in 2015 will be out of domestic equities into higher yielding international equity markets. In addition to the higher international market yields listed above, many of these foreign markets are priced more attractively (i.e., lower Price-Earnings (P/E) ratios) as you can see from the chart below created by strategist Dr. Ed Yardeni.
Source: Ed Yardeni – Dr. Ed’s Blog
Obviously, any asset shifting scenario is not mutually exclusive, and there could be a combination of investor reallocations made in 2015. It’s possible that previously unloved emerging markets and international developed markets could receive new investor capital from several areas.
With defensive sectors like utilities (up +25%) and healthcare (up +24%) leading the U.S. sector higher last year, it’s evident to me that “skepticism” remains the operative word in investors’ minds and there is no clear evidence of widespread euphoria hitting the U.S. stock market. Valuations as measured by trailing P/E ratios have objectively moved above historical averages, however this has occurred within the context of all-time record low interest rates and inflation. If you take into account the near-0% interest rate environment into your calculus, current stock prices (P/E ratios) are well within historical norms (see also The Rule of 20 Can Make You Plenty), which still leaves room for expansion.
If some of the half-glass full economic waters spill into the half-glass empty emerging markets/international markets, conceivably the eagerly anticipated “great rotation” out of bonds into U.S. stocks may also flow into even more attractively valued foreign equity opportunities.
Wade W. Slome, CFA, CFP®
Plan. Invest. Prosper.
DISCLOSURE: Sidoxia Capital Management (SCM) and some of its clients hold positions in AAPL and certain exchange traded funds (ETFs) including VGK, EWZ, FXI, but at the time of publishing SCM had no direct position in EWA, RSX, EWD, EWM, EWS, and any other security referenced in this article. No information accessed through the Investing Caffeine (IC) website constitutes investment, financial, legal, tax or other advice nor is to be relied on in making an investment or other decision. Please read disclosure language on IC Contact page.
Is Good News, Bad News?

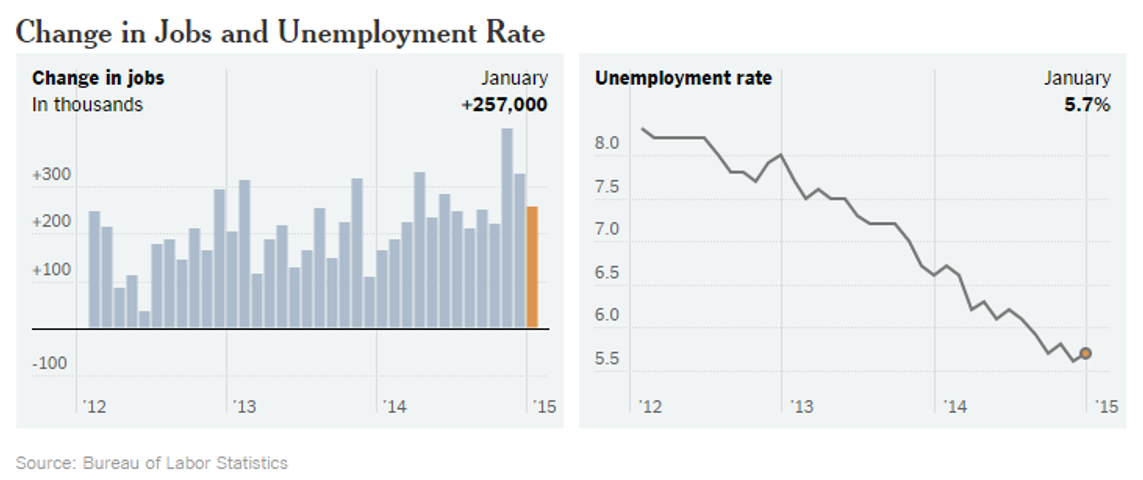
The tug-of-war is officially on as investors try to decipher whether good news is good or bad for the stock market? On the surface, the monthly January jobs report released by the Bureau of Labor Statistics (BLS) appeared to be welcomed, positive data. Total jobs added for the month tallied +257,000 (above the Bloomberg consensus of +230,000) and the unemployment rate registered 5.7% thanks to the labor participation rate swelling during the month (see chart below). More specifically, the number of people looking for a job exceeded one million, which is the largest pool of job seekers since 2000.
Source: BLS via New York Times
Initially the reception by stocks to the jobs numbers was perceived positively as the Dow Jones Industrial index climbed more than 70 points on Friday. Upon further digestion, investors began to fear an overheated employment market could lead to an earlier than anticipated interest rate hike by the Federal Reserve, which explains the sell-off in bonds. The yield on the 10-Year Treasury proceeded to spike by +0.13% before settling around 1.94% – that yield compares to a recent low of 1.65% reached last week. The initial euphoric stock leap eventually changed direction with the Dow producing a -180 point downward reversal, before the Dow ended the day down -62 points for the session.
Crude Confidence?
The same confusion circling the good jobs numbers has also been circulating around lower oil prices, which on the surface should be extremely positive for the economy, considering consumer spending accounts for roughly 70% of our country’s economic output. Lower gasoline prices and heating bills means more discretionary spending in the pockets of consumers, which should translate into more economic activity. Furthermore, it comes as no surprise to me that oil is both figuratively and literally the lubricant for moving goods around our country and abroad, as evidenced by the Dow Jones Transportation index that has handily outperformed the S&P 500 index over the last 18 months. While this may truly be the case, many journalists, strategists, economists, and analysts are nevertheless talking about the harmful deflationary impacts of declining oil prices. Rather than being viewed as a stimulative lubricant to the economy, many of these so-called pundits point to low oil prices as a sign of weak global activity and an omen of worse things to come.
This begs the question, as I previously explored a few years ago (see Good News=Good News?), is it possible that good news can actually be good news? Is it possible that lower energy costs for oil importing countries could really be stimulative for the global economy, especially in regions like Europe and Japan, which have been in a decade-long funk? Is it possible that healthier economies benefiting from substantial job creation can cause a stingy, nervous, and scarred corporate boardrooms to finally open up their wallets to invest more significantly?
Interest Rate Doom May Be Boom?
Quite frankly, all the incessant, never-ending discussions about an impending financial market Armageddon due to a potential single 0.25% basis point rate hike seem a little hyperbolic. Could I be naively whistling past the graveyard? From my perspective, although it is a foregone conclusion the Fed will have to increase interest rates above 0%, this is nothing new (I’m really putting my neck out there on this projection). Could this cause some volatility when it finally happens…of course. Just look at what happened to financial markets when former Federal Reserve Chairman Ben Bernanke merely threatened investors with a wind-down of quantitative easing (QE) in 2013 and investors had a taper tantrum. Sure, stocks got hit by about -5% at the time, but now the S&P 500 index has catapulted higher by more than +25%.
Looking at how stocks react in previous rate hike cycles is another constructive exercise. The aggressive +2.50% in rate hikes by former Fed Chair Alan Greenspan in 1995 may prove to be a good proxy (see also 1994 Bond Repeat?). After suffering about a -10% correction early in 1994, stocks rallied in the back-half to end the year at roughly flat.
And before we officially declare the end of the world over a single 0.25% hike, let’s not forget that the last rate hike cycle (2004 – 2006) took two and a half years and 17 increases in the targeted Federal Funds rate (1.00% to 5.25%). Before the rate increases finally broke the stock market’s back, the bull market moved about another +40% higher…not too shabby.
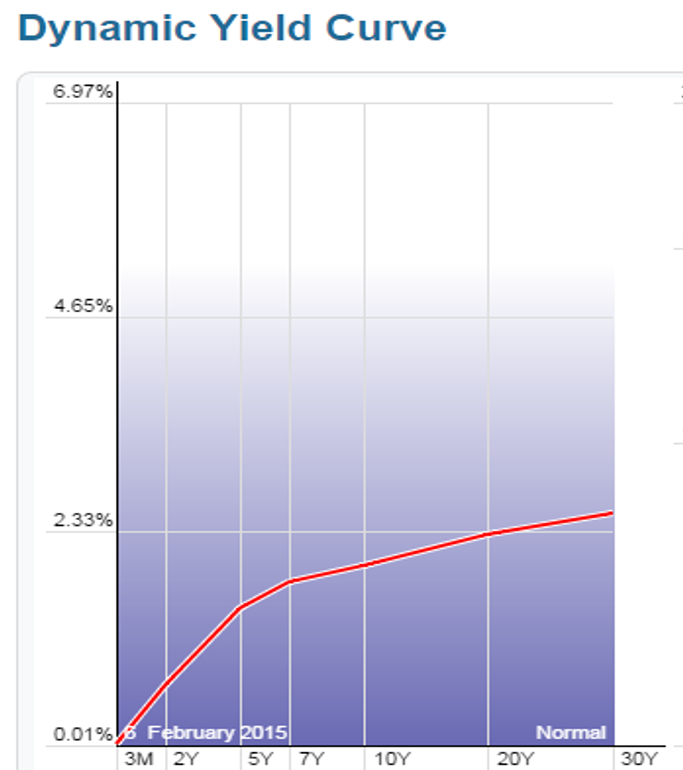
Lastly, before writing the obituary of this bull market, it’s worth noting the yield curve has been an incredible leading indicator and currently this gauge is showing zero warnings of any dark clouds approaching on the horizon (see chart below). As a matter of fact, over the last 50 years or so, the yield curve has turned negative (or near 0%) before every recession.
Source: StockCharts.com
As the chart above shows, the yield curve remains very sloped despite modest flattening in recent quarters.
While many skeptics are having difficulty accepting the jobs data and declining oil prices as good news because of rate hike fears, history shows us this position could be very misguided. Perhaps, once again, this time around good news may actually be good news.
Wade W. Slome, CFA, CFP®
Plan. Invest. Prosper.
DISCLOSURE: Sidoxia Capital Management (SCM) and some of its clients hold positions in certain exchange traded funds (ETFs), but at the time of publishing SCM had no direct position in any other security referenced in this article. No information accessed through the Investing Caffeine (IC) website constitutes investment, financial, legal, tax or other advice nor is to be relied on in making an investment or other decision. Please read disclosure language on IC Contact page.
Draghi Provides Markets QE Beer Goggles

While the financial market party has been gaining momentum in the U.S., Europe has been busy attending an economic funeral. Mario Draghi, the European Central Bank President is trying to reverse the somber deflationary mood, and therefore has sent out $1.1 trillion euros worth of quantitative easing (QE) invitations to investors with the hope of getting the eurozone party started.
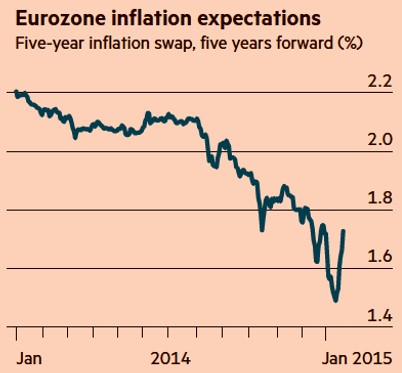
Draghi and the stubborn party-poopers sitting on the sidelines have continually been skeptical of the creative monetary punch-spiking policies initially implemented by U.S. Federal Reserve Chairman Ben Bernanke (and continued by his fellow dovish successor Janet Yellen). With the sluggish deflationary European pity party (see FT chart below) persisting for the last six years, investors are in dire need for a new tool to lighten up the dead party and Draghi has obliged with the solution…“QE beer goggles.” For those not familiar with the term “beer goggles,” these are the vision devices that people put on to make a party more enjoyable with the help of excessive consumption of beer, alcohol, or in this case, QE.
Source: The Financial Times
Although here in the U.S. “QE beer goggles” have been removed via QE expiration last year, nevertheless the party has endured for six consecutive years. Even an economy posting such figures as an 11-year high in GDP growth (+5.0%); declining unemployment (5.6% from a cycle peak of 10.0%); and stimulative effects from declining oil/commodity prices have not resulted in the cops coming to break up the party. It’s difficult for a U.S. investor to admit an accelerating economy; improving job additions; recovering housing market; with stronger consumer balance sheet would cause U.S. 10-Year Treasury Note yields to plummet from 3.04% at the beginning of 2014 to 1.82% today. But in reality, this is exactly what happened.
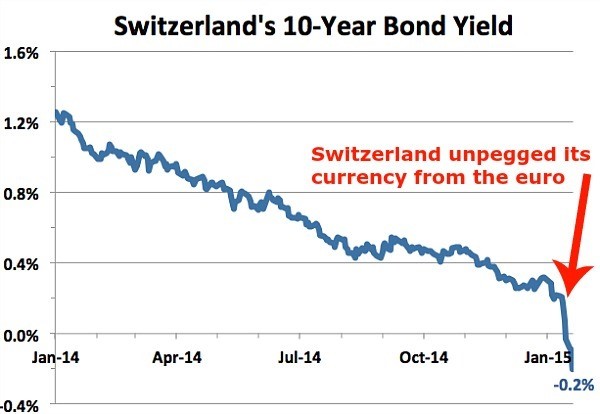
To confound views on traditional modern economics, we are seeing negative 10-year rates on Swiss Treasury Bonds (see chart below). In other words, investors are paying -1% to the Swiss government to park their money. A similar strategy could be replicated with $100 by simply burning a $1 bill and putting the remaining $99 under a mattress. Better yet, why not just pay me to hold your money, I will place your money under my guarded mattress and only charge you half price!
Does QE Work?
Debate will likely persist forever as it relates to the effectiveness of QE in the U.S. On the half glass empty side of the ledger, GDP growth has only averaged 2-3% during the recovery; the improvement in the jobs upturn is arguably the slowest since World War II; and real wages have declined significantly. On the half glass full side, however, the economy has improved substantially (e.g., GDP, unemployment, consumer balance sheets, housing, etc.), and stocks have more than doubled in value since the start of QE1 at the end of 2008. Is it possible that the series of QE policies added no value, or we could have had a stronger recovery without QE? Sure, anyone can make that case, but the fact remains, the QE training wheels have officially come off the economy and Armageddon has still yet to materialize.
I expect the same results from the implementation of QE in Europe. QE is by no means an elixir or panacea. I anticipate minimal direct and tangible economic benefits from Draghi’s $1+ trillion euro QE bazooka, however the psychological confidence building impacts and currency depreciating effects are likely to have a modest indirect value to the eurozone and global financial markets overall. The downside for these unsustainable ultra-low rates is potential excessive leverage from easy credit, asset bubbles, and long-term inflation. Certainly, there may be small pockets of these excesses, however the scars and regulations associated with the 2008-2009 financial crisis have delayed the “hangover” arrival of these risk possibilities on a broader basis. Therefore, until the party ends or the cops come to break up the fun, you may want to enjoy the gift provided by Mario Draghi to global investors…and strap on the “QE beer goggles.”
Wade W. Slome, CFA, CFP®
Plan. Invest. Prosper.
DISCLOSURE: Sidoxia Capital Management (SCM) and some of its clients own a range of positions, including positions in certain exchange traded funds positions , but at the time of publishing SCM had no direct position in any other security referenced in this article. No information accessed through the Investing Caffeine (IC) website constitutes investment, financial, legal, tax or other advice nor is to be relied on in making an investment or other decision. Please read disclosure language on IC Contact page.
Supply & Demand: The Lesson of a Lifetime

Between all the sporting events, road trips, and parties, I had a difficult time balancing my academic responsibilities just like any other college student. Nonetheless, after a few jobs and a few decades post my graduation, it is refreshing to see my economics college degree was able to teach me one valuable lesson…”supply & demand” actually works.
Emotions and animal spirits can separate fact from fiction in the short-run, but over the long-run, the economic forces of “supply & demand” will ultimately determine the direction of asset prices. If you can think of any bubble market, ranging from tulips and tech stocks (see Bubbles and Naps) to commodities and houses, sooner or later new supply will enter the market, and/or some other factor, which will prick the demand side of the bubble equation.
The same economic rules apply to currencies. Gut-based, day-traders may be skeptical, but economics’ longest enduring axiom shined last week when we saw the Swiss franc spike +20% against the euro in a single day. On the heels of a weakening euro currency and heightened demand for the franc, the Swiss National Bank (SNB) decided to remove its artificial peg to the euro. Effectively, the SNB has been selling francs and buying $490 billion in reserves (the majority of which is in euros and U.S. dollars). As a result, exports of Swiss army knives, watches, and industrial equipment will be more expensive now, which could potentially crimp demand for the country’s goods and services. The SNB, however, could no longer afford to buy euros and dollars to artificially depress the franc. Swiss bankers were very worried about the possible amplified costs of a currency war in the face of this week’s expected European Central Bank (ECB) announcements on quantitative easing (QE) monetary stimulus, so they decided to allow the franc to free-float versus global currencies.
Another asset class heavily impacted by volatile supply-demand dynamics has been the oil market. Weaker demand from Europe/Russia combined with the higher supply from U.S. shale has created a recipe for a crude price collapse (> -50% declines over the last year). Thus far, OPEC (Organization of Petroleum Exporting Countries) has remained committed to maintaining its supply/production levels.
Interest Rates and Supply-Demand
Not every asset price is affected by direct supply-demand factors. Take for example the stock market. I have been writing and commentating about the fascinating persistence and accelerated decline in global interest rates recently (see Why 0% Rates?). Near-0% rates are important because interest rates are just another name for the “cost of money” (or “opportunity cost of money”). When the Prime Rate was 20% in the early 1980s, the cost of money was high and a 16% CD at the bank looked pretty attractive relative to rolling the dice on volatile/risky stocks. Any economics, finance, or accounting student knows through their studies of the “time value of money” that interest rates have a tight inverse correlation to asset values (i.e., lower interest rates = higher asset values, and vice versa).
More practically speaking, we see stock prices supported by the lower borrowing costs tied to low interest rates. Just look at the $500,000,000,000+ conducted in share buybacks over the past 12 months (chart below). Economics works quite effectively when you can borrow at 3% and then purchase your own stock yielding 6% (the inverse percentage of the current 16x P/E ratio). What makes this mathematical equation even more accretive for corporate CFOs is the 6% rate earned today should double to 12% in 10 years, if a company resembles an average S&P 500 company. In other words, S&P 500 earnings have historically grown at a 7% annual clip, therefore the 6% earnings yield should double to 12% in about a decade, based on current prices. This basic arbitrage strategy is a no-brainer for corporate execs because it provides instantaneous EPS (earnings per share) growth with minimal risk, given the current bullet proof status of many blue-chip company balance sheets.

Source: Financial Times
I have provided a few basic examples of how straightforward supply-demand dynamics can be used to analyze market relationships and trends. Although supply-demand analysis is a great rudimentary framework at looking at markets and various asset classes, unanticipated exogenous factors such regulation, terrorism, politics, weather, and a whole host of other influences can throw a wrench into your valuation conclusions. Until rates normalize, the near-0% interest rates we are experiencing now will continue to be a significant tailwind for stock prices. As interest rates have been declining for the last three and a half decades, it appears I still have time before I will need to apply the other important concept I learned in college…mean reversion.
Wade W. Slome, CFA, CFP®
Plan. Invest. Prosper.
DISCLOSURE: Sidoxia Capital Management (SCM) and some of its clients own a range of positions, including positions in certain exchange traded funds positions , but at the time of publishing SCM had no direct position in any other security referenced in this article. No information accessed through the Investing Caffeine (IC) website constitutes investment, financial, legal, tax or other advice nor is to be relied on in making an investment or other decision. Please read disclosure language on IC Contact page.
Stretching the High Yield Rubber Band

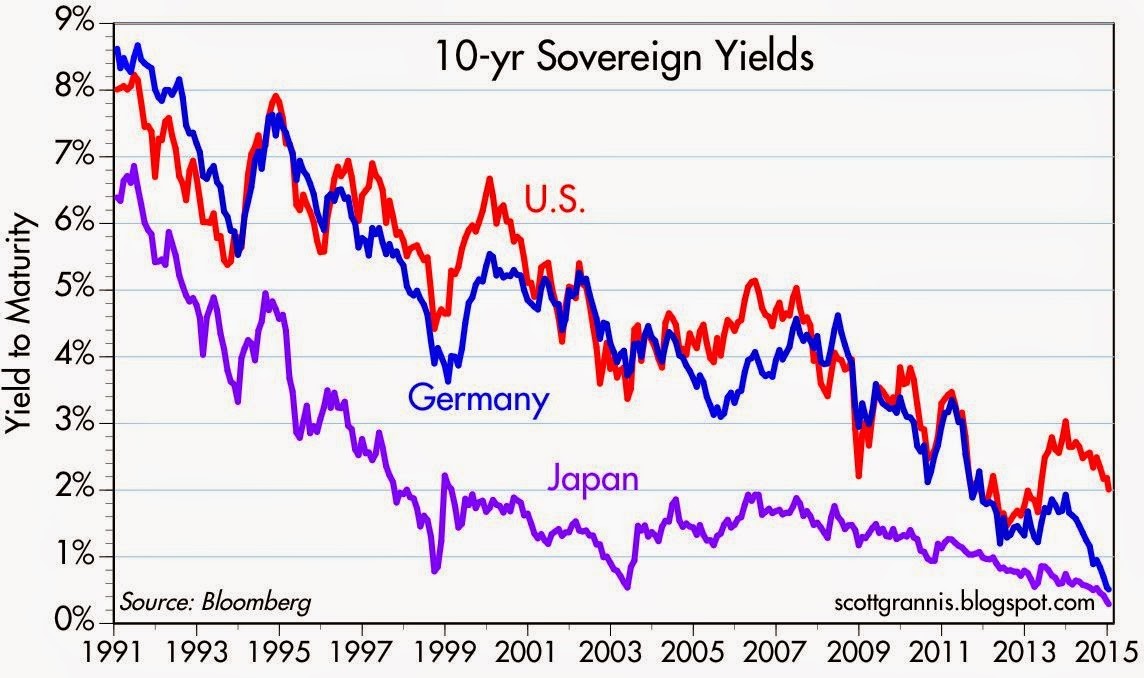
The 10-Year Treasury note recently pierced below the all-important psychological 2% level (1.97%), which has confounded many investors, especially if you consider these same rates were around 4% before the latest mega-financial crisis hit the globe. Some of the rate plunge can be explained by sluggish global growth, but the U.S. just logged a respectable +5.0% GDP growth quarter; corporate profits are effectively at all-time record highs; and the economy has added about 11 million private sector jobs over the last five years (unemployment rate of 10.0% has dropped to 5.6%). So what gives…why such low interest rates? Well, as I noted in a recent article (Why 0% Rates?), there is a whole host of countries with lower rates, which acts like an anchor dragging down our rates with them. Scott Grannis encapsulates this multi-decade, worldwide rate decline in the chart below:
It should come as no surprise to many that these abnormally low rates have had a massive ripple effect on other asset classes… including of course high-yield bonds (aka “junk bonds”). It doesn’t take a genius or rocket scientist to discern the effects of an ultra-low interest rate environment. Quite simply, investors are forced to hunt for yield. When a Bank of America (BAC) customer is forced into earning less than 1/10th of 1 cent for every dollar invested in a CD, you can easily understand why the smile in their CD advertisement looks more like a grimace. Rather than accept $8 in annual interest on a $10,000 investment, post-crisis investors frightened by the stock market have piled into junk bonds. If you don’t believe me, check out the analysis provided by the Financial Times (data from Dealogic) in the chart below, which shows about $1 trillion in U.S. high-yield debt issuance over the last three years. Europe has experienced an even more dramatic growth rate in junk issuance compared to the U.S.
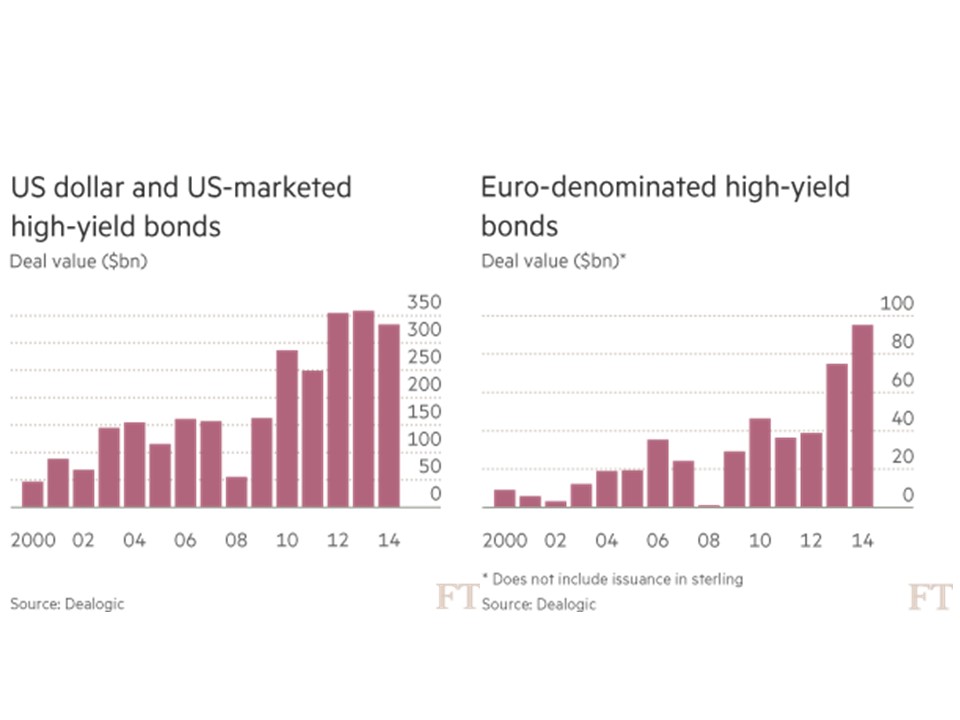
Stretching High-Yield Band
A rubber band can only stretch so far before the elasticity forces it too snap. We are getting closer to the snapping point, as more complacent investors lend money to riskier borrowers and also accept more lenient terms from issuers (e.g., cov-lite loans). Although default rates on high yield bonds remain near decade lows (1.1% through November 2014), high-yield investors keep on inching towards an ultimate day of reckoning. Thanks to a continually improving economy, Fitch Ratings is still projecting a benign default rate environment for high-yield bonds in 2015 – somewhere in the 1.5% – 2.0% range (see chart below). However, high-yield credit spreads did widen in 2014 with the help of crude oil prices getting chopped by more than -50% over the last year. Given the energy sector accounts for about 17% of the high-yield market (Barron’s), it would be natural to expect a larger number of energy company defaults to occur over the next 12-18 months, especially if crude oil prices remain depressed.
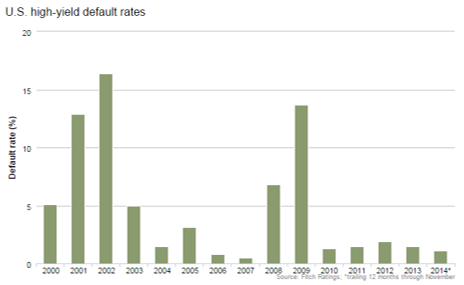
Source: Fitch Ratings
While it makes sense for you to hold a portion of your portfolio in high-yield bonds, especially for diversification purposes, don’t forget the power of mean reversion. The uncharacteristically low default rates will eventually revert towards historical averages. Stated differently, the increased risk profile of the high-yield bond market continues to stretch, so make sure you are not overly exposed to the sector because this segment will eventually snap.
Wade W. Slome, CFA, CFP®
Plan. Invest. Prosper.
DISCLOSURE: Sidoxia Capital Management (SCM) and some of its clients own a range of positions, including positions in certain exchange traded funds positions (JNK, HYG), and BAC, but at the time of publishing SCM had no direct position in any other security referenced in this article. No information accessed through the Investing Caffeine (IC) website constitutes investment, financial, legal, tax or other advice nor is to be relied on in making an investment or other decision. Please read disclosure language on IC Contact page.
Why 0% Rates? Tech, Globalization & EM (Not QE)

Recently I have written about the head-scratching, never-ending, multi-decade decline in long-term interest rates (see chart below). Who should care? Well, just about anybody, if you bear in mind the structure of interests rates impacts the cost of borrowing on mortgages, credit cards, automobiles, corporate bonds, savings accounts, and practically every other financial instrument you can possibly think of. Simplistic conventional thinking explains the race to 0% global interest rates by the loose monetary Quantitative Easing (QE) policies of the Federal Reserve. But validating that line of thinking becomes more challenging once you consider QE ended months ago. What’s more, contrary to common belief, rates declined further rather than climb higher after QE’s completion.
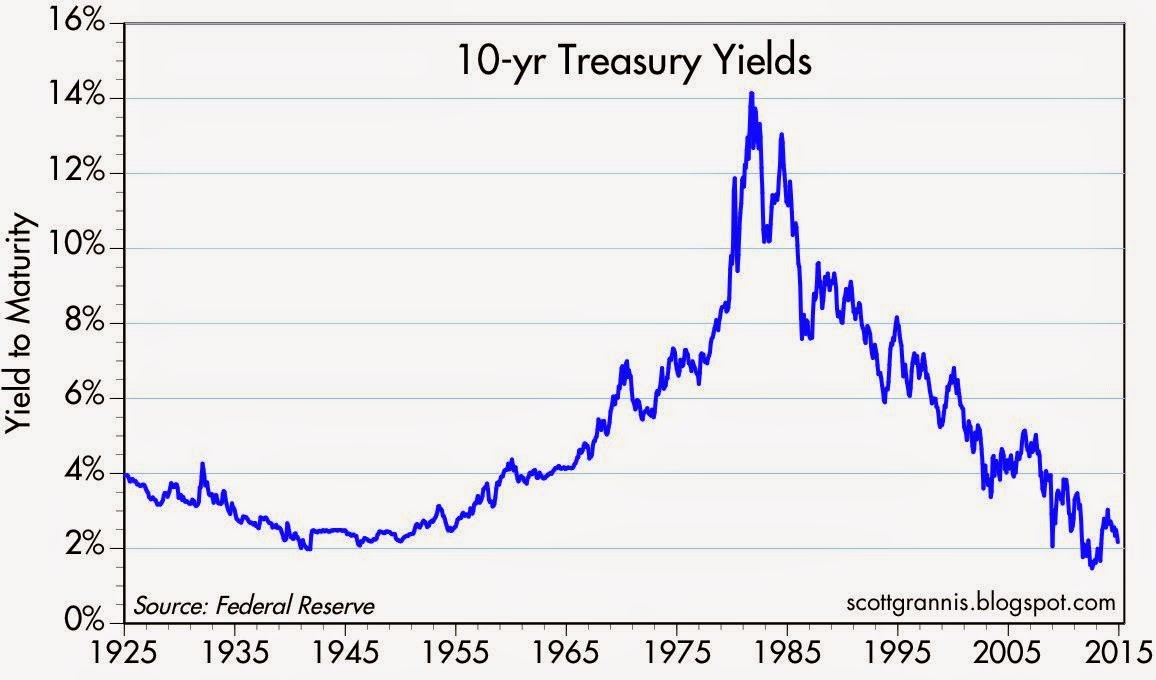
Source: Calafia Beach Pundit
More specifically, if you look at rates during this same time last year, the yield on the 10-Year Treasury Note had more than doubled in the preceding 18 months to a level above 3.0%. The consensus view then was that the eventual wind-down of QE would only add gasoline to the fire, causing bond prices to decline and rates to extend an indefinite upwards march. Outside of bond guru Jeff Gundlach, and a small minority of prognosticators, the herd was largely wrong – as is usually the case. As we sit here today, the 10-Year Note currently yields a paltry 2.26%, which has led to the long-bond iShares 20-Year Treasury ETF (TLT) jumping +22% year-to-date (contrary to most expectations).
The American Ostrich
Like an ostrich sticking its head in the sand, us egocentric Americans tend to ignore details relating to others, especially if the analyzed data is occurring outside the borders of our own soil. Unbeknownst to many, here are some key country interest rates below U.S. yields:
- Switzerland: 0.33%
- Japan: 0.34%
- Germany: 0.60%
- Finland: 0.70%
- Austria: 0.75%
- France: 0.88%
- Denmark: 0.89%
- Sweden: 0.98%
- Ireland: 1.29%
- Spain: 1.69%
- Canada 1.80%
- U.K: 1.85%
- Italy: 1.93%
- U.S.: 2.26% (are our rates really that low?)
Outside of Japan, these listed countries are not implementing QE (i.e., “Quantitative Easing”) as did the United States. Rather than QE being the main driver behind the multi-decade secular decline in interest rates, there are other more important disinflationary forces at work driving interest rates lower.
Technology, Globalization, and Emerging Market Competition (T.G.E.M.)
While tracking the endless monthly inflation statistics is a useful exercise to understand the tangible underlying pricing components of various industry segments (e.g., see 20 pages of CPI statistics), the larger and more important factors can be attributed to the somewhat more invisible elements of technology, globalization, and emerging market competition (T.G.E.M).
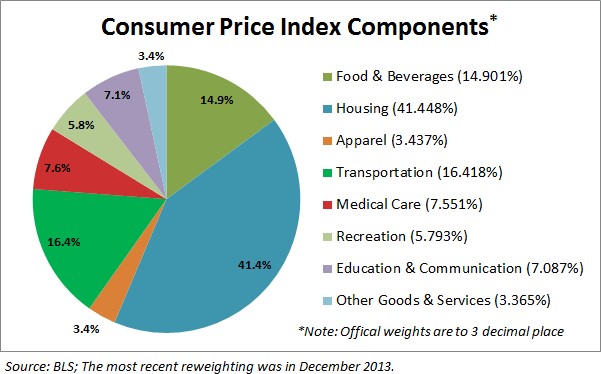
Starting with technology, to put these dynamics into perspective, consider the number of transistors, or the effective horsepower, on a semiconductor (a.k.a. computer “chip”) today. The overall impact on global standards of living is nothing short of astounding. Take an Intel chip for example – it had approximately 2,000 transistors in 1971. Today, semiconductors can cram over 10,000,000,000 (yes billions – 5 million times more) transistors onto a single semiconductor. Any individual can look no further than their smartphone to understand the profound implications this has not only on pricing in general, but society overall. To illustrate this point, I would direct you to a post highlighted by Professor Mark J. Perry, who observed the cost to duplicate an iPhone during 1991 would have been more than $3,500,000!
There are an infinite number of examples depicting how technology has accelerated the adoption of globalization. More recently, events such as the Arab Spring point out how Twitter (TWTR) displaced costly military engagement alternatives. The latest mega-Chinese IPO of Alibaba (BABA) was also emblematic of the hunger experienced in emerging markets to join the highly effective economic system of global capitalism.
I think New York Times journalist Tom Friedman said it best in his book, The World is Flat, when he made the following observations about the dynamics occurring in emerging markets:
“My mom told me to eat my dinner because there are starving children in China and India – I tell my kids to do their homework because Chinese and Indians are starving for their jobs”.
“France wants a 35 hour work week, India wants a 35 hour work day.”
There may be a widening gap between rich and poor in the United States, but technology and globalization is narrowing the gap across the rest of the world. Consider nearly half of the world’s population (3 billion+ people) live in poverty, earning less than $2.50 a day (see chart below). Technology and globalization is allowing this emerging middle class climb the global economic ladder.
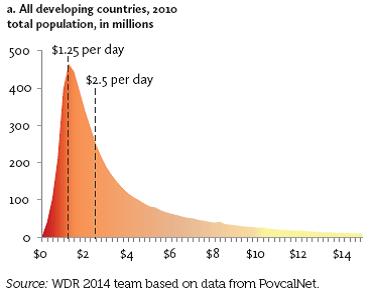
These impoverished individuals may not be imminently stealing our current jobs and driving general prices lower, but their children, and the countless educated millions in other international markets are striving for the same economic security and prosperity we have. The educated individuals in the emerging markets that have tasted capitalism are giving new meaning to the word “urgency”, which is only accelerating competition and global pricing pressures. It comes as no surprise to me that this generational migration from the poor to the middle class is putting a lid on inflation and interest rates around the world.
Declining costs of human labor from emerging markets however is not the only issue putting a ceiling on general prices. Robotics, an area in which Sidoxia holds significant investments, continues to be an area of fascination for me. With human labor accounting for the majority of business costs, it’s no wonder the C-suite is devoting more investment dollars towards automation. Rather than hire and train expensive workers, why not just buy a robot? This is not just happening in the U.S. – in fact the Chinese purchased more robots than Americans last year. And why not? An employer does not have to pay a robot overtime compensation; a robot never shows up late; robots never sue for discrimination or harassment; robots receive no healthcare or retirement benefits; and robots work 24 hours/day, 7 days/week, and 365 days/year.
While newspapers, bloggers, and talking heads like to point to the simplistic explanation of loose, irresponsible monetary policies of global central banks as the reason behind a four decade drop in interest rates that is only a small part of the story. Investors and policy makers alike should be paying closer attention to the factors of technology, globalization, and emerging market competition as the more impactful dynamics systematically driving down long term interest rates and inflation.

Wade W. Slome, CFA, CFP®
Plan. Invest. Prosper.
DISCLOSURE: Sidoxia Capital Management (SCM) and some of its clients own a range of positions, including long positions in certain exchange traded fund positions and INTC (short position in TLT), but at the time of publishing SCM had no direct position in BABA, TWTR or any other security referenced in this article. No information accessed through the Investing Caffeine (IC) website constitutes investment, financial, legal, tax or other advice nor is to be relied on in making an investment or other decision. Please read disclosure language on IC Contact page.
Santa and the Rate-Hike Boogeyman

Boo! … Rates are about to go up. Or are they? We’re in the fourth decade of a declining interest rate environment (see Don’t be a Fool), but every time the Federal Reserve Chairman speaks or monetary policies are discussed, investors nervously look over their shoulder or under their bed for the “Rate Hike Boogeyman.” While this nail-biting mentality has resulted in lost sleep for many, this mindset has also unfortunately led to a horrible forecasting batting average for economists. Santa and many equity investors have ignored the rate noise and have been singing Ho Ho Ho as stock prices hover near record highs.
A recent Deutsche Bank report describes the prognostication challenges here:
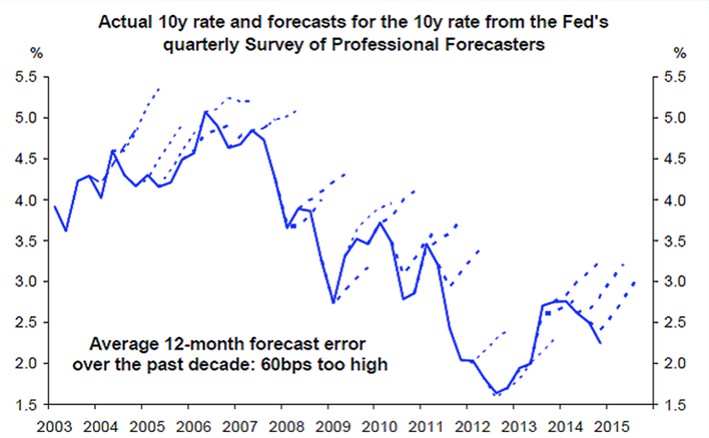
i.) For the last 10 years, professional forecasters have consistently been wrong on their predictions of rising interest rates.
Source: Deutsche Bank via Vox
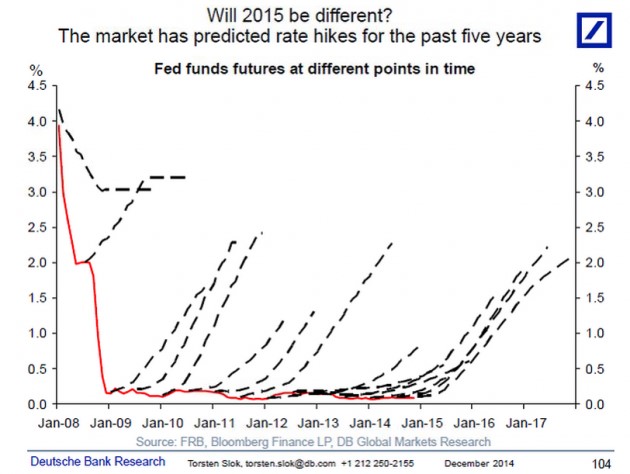
ii.) For the last five years, investors haven’t fared any better. As you can see, they too have been continually wrong about their expectations for rising interest rates.
Source: Deutsche Bank via Vox
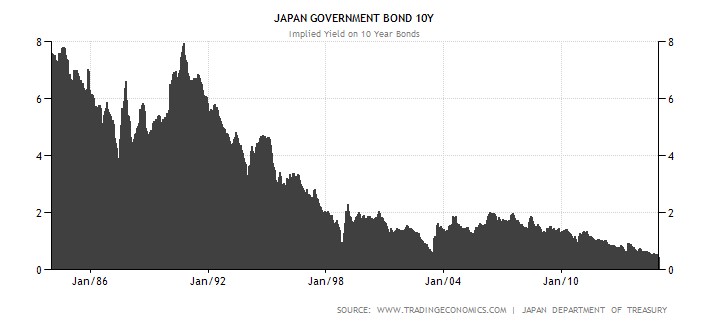
I’m the first to admit that rates have remained “lower for longer” than I guessed, but unlike many, I do not pretend to predict the exact timing of future rate increases. I strongly believe inevitable interest rate rises are not a matter of “if” but rather “when”. However, trying to forecast the timing of a rate increase can be a fool’s errand. Japan is a great case in point. If you take a look at the country’s interest rates on their long-term 10-year government bonds (see chart below), the yields have also been declining over the last quarter century. While the yield on the 10-Year U.S. Treasury Note is near all-time historic lows at 2.18%, that rate pales in comparison to the current 10-Year Japanese Bond which is yielding a minuscule 0.36%. While here in the states our long-term rates only briefly pierced below the 2% threshold, as you can see, Japanese rates have remained below 2% for a jaw-dropping duration of about 15 years.
Source: TradingEconomics.com
There are plenty of reasons to explain the differences in the economic situation of the U.S. and Japan (see Japan Lost Decades), but despite the loose monetary policies of global central banks, history has proven that interest rates and inflation can remain stubbornly low for longer than expected.
The current pundit thinking has Federal Reserve Chairwoman Yellen leading the brigade towards a rate hike during mid-calendar 2015. Even if the forecasters finally get the interest rate right for once, the end-outcome is not going to be catastrophic for equity markets. One need look no further than 1994 when Federal Reserve Chairman Greenspan increased the benchmark federal funds rate by a hefty +2.5%. (see 1994 Bond Repeat?). Rather than widespread financial carnage in the equity markets, the S&P 500 finished roughly flat in 1994 and resumed the decade-long bull market run in the following year.
Currently 15 of the 17 Fed policy makers see 2015 median short-term rates settling at 1.125% from the current level of 0-0.25%. This hardly qualifies as interest rate Armageddon. With a highly transparent and dovish Janet Yellen at the helm, I feel perfectly comfortable the markets can digest the inevitable Fed rate hikes. Will (could) there be volatility around changes in Fed monetary policy during 2015? Certainly – no different than we experienced during the “taper tantrum” response to Chairman Ben Bernanke’s rate rise threats in 2013 (see Fed Fatigue).
As 2014 comes to an end, Santa has wrapped investor portfolios with a generous bow of returns in the fifth year of this historic bull market. Not everyone, however, has been on Santa’s “nice” list. Regrettably, many sideliners have received no presents because they incorrectly assessed the elimination impact of Quantitative Easing (QE). If you prefer presents over a lump of coal in your stocking, it will be in your best interest to ignore the Rate Hike Boogeyman and jump on Santa’s sleigh.
Wade W. Slome, CFA, CFP®
Plan. Invest. Prosper.
DISCLOSURE: Sidoxia Capital Management (SCM) and some of its clients own a range of positions, including certain exchange traded fund positions, but at the time of publishing SCM had no direct position in DB or any other security referenced in this article. No information accessed through the Investing Caffeine (IC) website constitutes investment, financial, legal, tax or other advice nor is to be relied on in making an investment or other decision. Please read disclosure language on IC Contact page.