Posts tagged ‘interest rates’
Flat Pancakes & Dividends

Over the last 18 months, stock prices have been flat as a pancake. Absent a few brief China and recessionary scares, the Dow Jones Industrial Average index has spent most of 2015 and 2016 trading between the relatively tight levels of 17,000 – 18,000. Record corporate profits and faster growth than other developed and developing markets have created a tug-of-war with countervailing factors. A strong dollar, reversal in monetary policy, geopolitical turmoil, and volatile commodity markets have produced a neutralizing struggle among corporate executives with deep financial pockets and short arms. In this environment, share buybacks, stable profit margins, and growing dividends have taken precedence over accelerated capital investments and expensive new-hires.
With flat stock prices and interest rates at unprecedented low levels, it’s during times like these that stock investors really appreciate the appetizing flavor of stable, growing dividends. To this day, I still find it almost impossible to fathom how investors are burning money by irrationally speculating in $7 trillion in negative interest rate bonds (see Retire at Age 90).
Historically there are very few periods in which stock dividend yields have exceeded bond yields (2.1% S&P yield vs. 1.8% 10-Year Treasury yield). As I showed in my Dividend Floodgates article, for roughly 50 years (1960 – 2010), the yield on the 10-Year Treasury Notes have exceeded the dividend yield on stocks (S&P 500) – that longstanding trend does not hold today.
In the face of the competitive stock market, several trends are contributing to the upward trajectory in dividend payments (see chart below).
#1.) Corporate profits (ex-Energy) are growing and at/near record levels. Earnings are critical in providing fertile ground for dividend growth.
#2.) Demographics, plain and simple. As 76 million Baby Boomers transition into retirement, their income needs escalate. These shareholders whine and complain to corporate executives to share the spoils and increase dividends.
#3.) Low interest rates and disinflation are shrinking the available pool of income generating assets. As I pointed out above, when trillions of dollars are getting thrown into negative yielding investments, many investors are flocking to alternative income-generating assets…like dividend paying stocks.
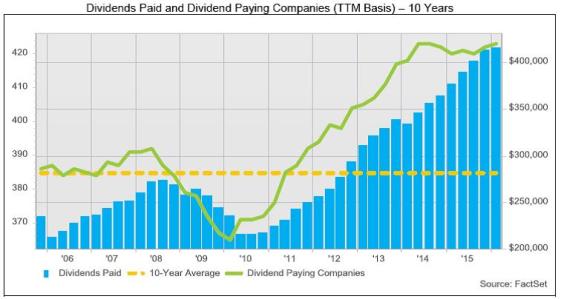
Source: FactSet
The Power of Dividends (Case Studies)
Most people don’t realize it, but over the last 100 years, dividends have accounted for approximately 40% of stocks’ total return as measured by the S&P 500. In other words, using history as a guide, if you initially invested in a stock XYZ at $100 that appreciated in value to $160 (+60%) 10 years later, that stock on average would have supplied an incremental $40 in dividends (40%) over that period, creating a total return of 100%.
Rather than using a hypothetical example, here are a few stock specific illustrations that highlight the amazing power of compounding dividend growth rates. Here are two “Dividend Aristocrats” (stocks that have increased dividends for at least 25 consecutive years):
- PepsiCo Inc (PEP): PepsiCo has increased its dividend for an astonishing 44 consecutive years. Today, the dividend yield is 2.9% based on the current share price. But had you purchased the stock in June 1972 for $1.60 per share (split-adjusted), you would currently be earning a +188% dividend yield ($3.01 dividend / $1.60 purchase price), which doesn’t even account for the +6,460% increase in the share price ($104.96 per share today from $1.60 in 1972). Over that 44 year period, the split-adjusted dividend has increased from about $0.02 per share to an annualized $3.01 dividend per share today, which equates to a mind-blowing +16,153% increase. On top of the $103 price appreciation, assuming a conservative 5% dividend reinvestment rate, my estimates show investors would have received more than $60 in reinvested dividends, making the total return that much more gargantuan.
- Emerson Electric Co (EMR): Emerson Electric too has had an even more incredible streak of dividend increases, which has now extended for 59 consecutive years. Emerson currently yields a respectable 3.6% rate, but if you purchased the stock in June 1972 for $3.73 per share (split-adjusted), you would currently be earning a +51% dividend yield ($1.92 dividend / $3.73 purchase price), which doesn’t even consider the +1,423% increase in the share price ($53.31 per share today from $3.73 in 1972).
There is never a shortage of FUD (Fear, Uncertainty, and Doubt), which has kept stock prices flat as a pancake over the last couple of years, but market leading franchise companies with stable/increasing dividends do not disappear during challenging times. Record profits (ex-energy), demographics, and a scarcity of income-generating investment alternatives are all contributing factors to the increased appetite for dividends. If you want to sweeten those flat pancakes, do yourself a favor and pour some quality dividend syrup over your investment portfolio.

Wade W. Slome, CFA, CFP®
Plan. Invest. Prosper.
DISCLOSURE: Sidoxia Capital Management (SCM) and some of its clients hold positions in certain exchange traded funds (ETFs) and PEP, but at the time of publishing had no direct position in EMR or any other security referenced in this article. No information accessed through the Investing Caffeine (IC) website constitutes investment, financial, legal, tax or other advice nor is to be relied on in making an investment or other decision. Please read disclosure language on IC Contact page.
Energizer Market… Keeps Going and Going

This article is an excerpt from a previously released Sidoxia Capital Management complimentary newsletter (May 2, 2016). Subscribe on the right side of the page for the complete text.
Boom, boom, boom…it keeps going…and going…and going…
You’ve seen the commercials: A device operating on inferior batteries dies just as a drum-beating, battery operated Energizer bunny comes speeding and spiraling across the television screen. Onlookers waiting for the battery operated toy to run out of juice, instead gaze in amazement as they watch the energized bunny keep going and going. The same phenomenon is occurring in the stock market, as many observers eagerly await for stock prices to die. The obituary of the stock market has been written many times over the last eight years (see Series of Unfortunate Events). Mark Twain summed up this sentiment well, when after a premature obituary was written about him, he quipped, “The reports of my death are greatly exaggerated.”
With fears abound, stocks added to their annual gains by finishing their third consecutive positive month with the S&P 500 indexes and Dow Jones Industrial Average advancing +0.5% and +0.3%, respectively. Skeptics and worry-warts have been concerned about stocks plummeting ever since the Financial Crisis of 2008-2009. We experienced a 100 year flood then, and as a consequence, scarred investors now expect the 100 year flood to repeat every 100 days (see also 100 Year Flood). Given the damage created in the wake of the “Great Recession,” many individuals have become afraid of their own shadow. The shadows currently scaring investors include the following:
- Negative Interest Rates: The unknown consequences of negative interest rate policies by central banks (see chart below).
- U.S. Monetary Policy: The potential continuation of the Federal Reserve hiking interest rates.
- Sluggish Economic Growth: With a GDP growth figure up only +0.5% during the first quarter many people are worried about the vulnerability of slipping into recession.
- Brexit Fears: Risk of Britain exiting the European Union (a.k.a. “Brexit”) will blanket the airwaves as the referendum approaches next month
For these reasons, and others, the U.S. central bank is likely to remain accommodative in its stance (i.e., Fed Chairwoman Janet Yellen is expected to be slow in hitting the economic brakes via interest rate hikes).
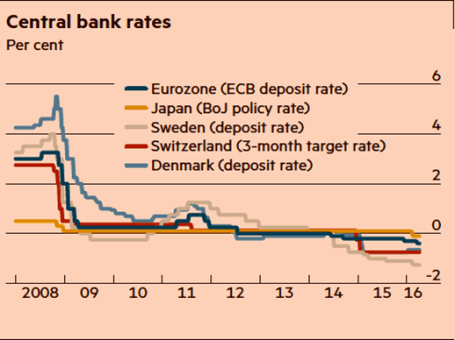
Source: Financial Times. Central banks continue with attempts to stimulate with zero/negative rates.
Climbing the Wall of Worry
Despite all these concerns, stock prices continue climbing the proverbial “wall of worry” while approaching record levels. As famed investor Sir John Templeton stated on multiple occasions, “Bull markets are born on pessimism, and they grow on skepticism, mature on optimism, and die on euphoria.” It’s obvious to me there currently is no euphoria in the overall market, if you consider investors have withdrawn $2 trillion in stock investments since 2007. The phenomenon of stocks moving higher in the face of bad news is nothing new. A recent study conducted by the Financial Times newspaper shows the current buoyant bull market entering the second longest advancing period since World War II (see chart below).
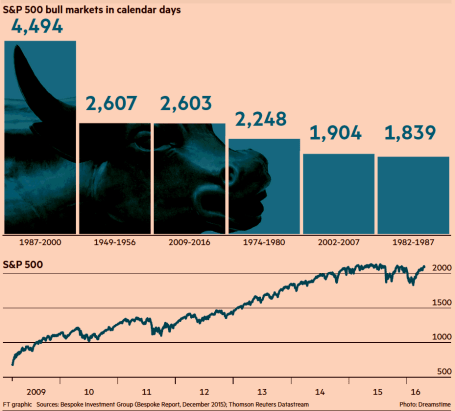
Source: Financial Times
There will never be a shortage of concerns or bad things occurring in a world of 7.4 billion people, but the Energizer bunny U.S. economy has proven resilient. Our economy is entering its seventh consecutive year of expansion, and as I recently pointed out the job market keeps plodding along in the right direction – unemployment claims are at a 43-year low (see Spring Has Sprung). Over the last few years, these job gains have come despite corporate profits being challenged by the headwinds of a stronger U.S. dollar (hurts our country’s exports) and tumbling energy profits. Fortunately, the negative factors of the dollar and oil prices have stabilized lately, and these dynamics are in the process of shifting into tailwinds for company earnings. The -5.7% year-to-date decline in the Dollar Index coupled with the recent rebound in oil prices are proof that the economic laws of supply-demand eventually respond to large currency and commodity swings. With the number of rigs drilling for oil down by approximately -80% over the last two years, it comes as no surprise to me that a drop in oil supply has steadied prices.
The volatility in oil prices has been amazing. Energy companies have been reeling as oil prices dropped -76% from a 2014-high of $108 per barrel to a 2016-low of $26 per barrel. Since then, the picture has improved significantly. Crude oil prices are now hovering around $46 per barrel, up +76%.
Energy Bankruptcy & Recessionary Fears Abate
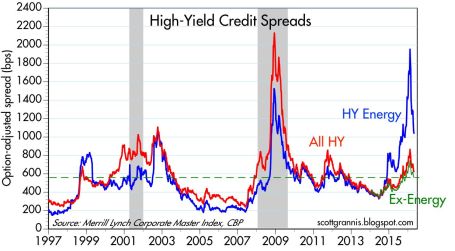
If you take a look at the borrowing costs of high-yield companies in the chart below (Calafia Beach Pundit), you can see that prior spikes in the red line (all high-yield borrowing costs) were correlated with recessions – represented by the gray periods occurring in 2001 and 2008-09. During 2016, you can see from the soaring blue line, investors were factoring in a recession for high-yield energy companies (until the oil price recovery), but the non-energy companies (red-green lines) were not anticipating a recession for the other sectors of the economy. Bottom-line, this chart is telling you the knee-jerk panic of recessionary fears during the January-February period of this year has quickly abated, which helps explain the sharp rebound in stock prices.
After a jittery start to 2016 when economic expectations were for a dying halt, investors have watched stocks recharge their batteries in March and April. There are bound to be more fits and starts in the future, as there always are, but for the time being this Energizer bunny stock market and economy keeps going…and going…and going…
Wade W. Slome, CFA, CFP®
Plan. Invest. Prosper.
DISCLOSURE: Sidoxia Capital Management (SCM) and some of its clients hold positions in certain exchange traded funds (ETFs), but at the time of publishing had no direct position in any other security referenced in this article. No information accessed through the Investing Caffeine (IC) website constitutes investment, financial, legal, tax or other advice nor is to be relied on in making an investment or other decision. Please read disclosure language on IC Contact page.
Michael Jordan and Market Statistics

Basketball is in the air as the NBA playoffs are once again upon us. While growing up in high school, Michael Jordan was my basketball idol, and he dominated the sport globally at the highest level. I was a huge fanatic. Besides continually admiring my MJ poster-covered walls, I even customized my own limited edition Air Jordan basketball shoes by applying high school colors to them with model paint – I would not recommend this fashion experiment to others.
Eventually the laws of age, physics, and gravity took over, as Jordan slowly deteriorated physically into retirement. On an infinitesimally smaller level, I also experienced a similar effect during my 30s when playing in an old man’s recreational basketball league. Day-by-day, month-by-month, and year-by-year, I too got older and slower (tough to believe that’s possible) as I watched all the 20-somethings run circles around me – not to mention my playing time was slashed dramatically. Needless to say, I too was forced into retirement like Michael Jordan, but nobody retired my number, and I still have not been inducted into the Hall of Fame.

“Air Wade” Before Retirement: No Photoshop in 1988, just an optical illusion created by an 8-foot rim.
Financial markets are subject to similar laws of science (economics) too. The stock market and the economy get old and tired just like athletes, as evidenced by the cyclical nature of bear markets and recessions. Statistics are a beautiful thing when it comes to sports. Over the long run, numbers don’t lie about the performance of an athlete, just like statistics over the long run don’t lie about the financial markets. When points per game, shooting percentage, rebounds, assists, minutes played, and other measurements are all consistently moving south, then it’s safe to say fundamentals are weakening.
I’ve stated it many times in the past, and I’ll state it again, these are the most important factors to consider when contemplating the level and direction of the stock market (see also Don’t Be a Fool, Follow the Stool).
- Profits
- Interest Rates
- Valuations
- Sentiment
While the absolute levels of these indicators are important, the trend or direction of each factor is also very relevant. Let’s review these factors a little more closely.
- Profits: Profits and cash flows, generally speaking, are the lifeblood behind any investment and currently corporate profits are near record levels. When it comes to the S&P 500, the index is currently expected to generate a 2016 profit of $117.47. Considering a recent price closing of 2,092 on the index, this translates into a price-earnings ratio (P/E) of approximately 17.8x or a 5.6% earnings yield. This earnings yield can be compared to the 1.9% yield earned on the 10-Year Treasury Note, which is even lower than the 2.1% dividend yield on the S&P 500 (a rare historical occurrence). If history repeats itself, the 5.6% earnings yield on stocks should double to more than 10% over the next decade, however the yield on 10-year Treasuries stays flat at 1.9% over the next 10 years. The strong dollar and the implosion of the energy sector has put a lid on corporate profits over the last year, but emerging signs are beginning to show these trends reversing. Stabilizing profits near record levels should be a positive contributor to stocks, all else equal.
- Interest Rates: Pundits have been pointing to central banks as the sole reason for low/negative interest rates globally (see chart below). NEWS FLASH: Central banks have been increasing and decreasing interest rates for decades, but that hasn’t stopped the nearly unabated 36-year decline in interest rates and inflation (see chart below). As I described in previous articles (see Why 0% Rates?), technology, globalization, and the rise of emerging markets is having a much larger impact on interest rates/inflation than monetary policies. If central banks are so powerful, then why after eight years of loose global monetary policies hasn’t inflation accelerated yet? Regardless, all else equal, these historically low interest rates are horrible for savers, but wonderful for equity investors and borrowers.
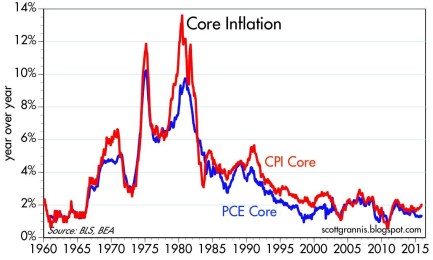
Source: Calafia Beach Pundit
- Valuations: The price you pay for an investment is one of the, if not the, most important factors to consider. I touched upon valuations earlier when discussing profits, and based on history, there is plenty of evidence to support the position that valuations are near historic averages. Shiller CAPE bears have been erroneously screaming bloody murder over the last seven years as prices have tripled (see Shiller CAPE smells like BS). A more balanced consideration of valuation takes into account the record low interest rates/inflation (see The Rule of 20).
- Sentiment: There are an endless number of indicators measuring investor optimism vs. pessimism. Generally, most experienced investors understand these statistics operate as valuable contrarian indicators. In other words, as Warren Buffett says, it is best to “buy fear, and sell greed.” While I like to track anecdotal indicators of sentiment like magazine covers, I am a firm believer that actions speak louder than words. If you consider the post-crisis panic of dollars flowing into low yielding bonds – greater than $1 trillion more than stocks (see Chicken vs. Beef ) you will understand the fear and skepticism remaining in investors minds. The time to flee stocks is when everyone falls in love with them.
Readers of Michael Lewis’s book Moneyball understand the importance statistics can play in winning sports. Michael Jordan may not have been a statistician like Billy Beane, because he spent his professional career setting statistical records, not analyzing them. Unfortunately, my basketball career never led me to the NBA or Hall of Fame, but I still hope to continue winning in the financial markets by objectively following the all-important factors of profits, interest rates, valuations, and sentiment.
Wade W. Slome, CFA, CFP®
Plan. Invest. Prosper.
DISCLOSURE: Sidoxia Capital Management (SCM) and some of its clients hold positions in certain exchange traded funds (ETFs), but at the time of publishing had no direct position in any security referenced in this article. No information accessed through the Investing Caffeine (IC) website constitutes investment, financial, legal, tax or other advice nor is to be relied on in making an investment or other decision. Please read disclosure language on IC Contact page.
Want to Retire at Age 90?

Do you love working 40-50+ hour weeks? Do you want to be a Wal-Mart (WMT) greeter after you get laid off from your longstanding corporate job? Do you love relying on underfunded government entitlements that you hope won’t be insolvent 10, 20, or 30 years from now? Are you banking on winning the lottery to fund your retirement? Do you enjoy eating cat food?
If you answered “Yes” to one or all of these questions, then do I have a sure-fire investment program for you that will make your dreams of retiring at age 90 a reality! Just follow these three simple rules:
- Buy Low Yielding, Long-Term Bonds: There are approximately $7 trillion in negative yielding government bonds outstanding (see chart below), which as you may understand means investors are paying to give someone else money – insanity. Bank of America recently completed a study showing about two-thirds of the $26 trillion government bond market was yielding less than 1%. Not only are investors opening themselves up to interest rate risk and credit risk, if they sell before maturity, but they are also susceptible to the evil forces of inflation, which will destroy the paltry yield. If you don’t like this strategy of investing near 0% securities, getting a match and gasoline to burn your money has about the same effect.
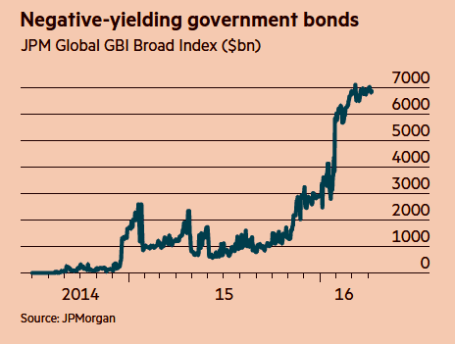
Source: Financial Times
- Speculate on the Timing of Future Fed Rate Hikes/Cuts: When the economy is improving, talking heads and so-called pundits try to guess the precise timing of the next rate hike. When the economy is deteriorating, aimless speculation swirls around the timing of interest rate cuts. Unfortunately, the smartest economists, strategists, and media mavens have no consistent predicting abilities. For example, in 1998 Nobel Prize winning economists Robert Merton and Myron Scholes toppled Long Term Capital Management. Similarly, in 1996 Federal Reserve Chairman Alan Greenspan noted the presence of “irrational exuberance” in the stock market when the NASDAQ was trading at 1,350. The tech bubble eventually burst, but not before the NASDAQ tripled to over 5,000. More recently, during 2005-2007, Fed Chairman Ben Bernanke whiffed on the housing bubble – he repeatedly denied the existence of a housing problem until it was too late. These examples, and many others show that if the smartest financial minds in the room (or planet) miserably fail at predicting the direction of financial markets, then you too should not attempt this speculative feat.
- Trade on Rumors, Headlines & Opinions: Wall Street analysts, proprietary software with squiggly lines, and your hot shot day-trader neighbor (see Thank You Volatility) all promise the Holy Grail of outsized financial returns, but regrettably there is no easy path to consistent, long-term outperformance. The recipe for success requires patience, discipline, and the emotional wherewithal to filter out the endless streams of financial noise. Continually chasing or reacting to opinions, headlines, or guaranteed software trading programs will only earn you taxes, transaction costs, bid-ask spread costs, impact costs, high frequency trading manipulation and underperformance.
Saving for your future is no easy task, but there are plenty of easy ways to destroy your savings. If you want to retire at age 90, just follow my three simple rules.

Wade W. Slome, CFA, CFP®
Plan. Invest. Prosper.
DISCLOSURE: Sidoxia Capital Management (SCM) and some of its clients hold positions in certain exchange traded funds (ETFs), but at the time of publishing had no direct position in WMT or any security referenced in this article. No information accessed through the Investing Caffeine (IC) website constitutes investment, financial, legal, tax or other advice nor is to be relied on in making an investment or other decision. Please read disclosure language on IC Contact page.
Chasing Headlines

It’s been an amazing start to the year. First the market cratered on slowing China economic concerns, domestic recessionary fears, deteriorating oil prices, and negative interest rates abroad. In response to all these worries (and others), stocks dove more than -11% (S&P 500 Index) in January, before settling down. Subsequently, the market has made a screaming recovery, in part due to dovish monetary policy comments (i.e., reduction in forecasted interest rate hikes) and diminished anxiety over a potential global collapse. Month-to-date stocks are up an impressive +5.4%, and year-to-date equities are flattish, or down less than -1%.
With an endless amount of information flowing across our smart phones and computers, it becomes quite easy and tempting to chase news headlines, just like a hyper dog chasing a car. But even once an investor catches up (or reacts) to a headline, there’s confusion around how to profit from the fleeting information. First of all, every plugged-in hedge fund and institutional investor has likely already traded on the stale information you received. Second of all, rarely is the data relevant to the long-term cash generating capabilities of the company or economy. And lastly, the news is more often than not, instantly factored into the stock price. Chasing news headlines only eaves individual investors holding the bag of performance-shattering transactions costs, taxes, and worn-out pricing.
The heightened volatility in late 2015 and early 2016 hasn’t however prevented investors and so-called pundits from attempting to time the market. Any battle-tested investment veteran knows it’s virtually impossible to consistently time the market (see also Market Timing Treadmill), but this fact hasn’t prevented speculators from attempting the feat nonetheless. Famed investment guru, Peter Lynch, who earned an average +29% annual return from 1977-1990, summed it up well when he stated the following:
“Far more money has been lost by investors preparing for corrections, or trying to anticipate corrections, than has been lost in corrections themselves.”
The Important Factors
As I’ve written many times in the past, the keys to long-term stock performance are not knee-jerk reactions to headlines, but rather these following crucial factors (see also Don’t Be a Fool, Follow the Stool):
- Profits
- Interest Rates
- Sentiment
- Valuations
On the profit growth front, corporate income has been pressured by numerous headwinds over the last few years, including an export-shattering increase in the value of the U.S. dollar and a profit-squeezing collapse in energy sector earnings. As you can see from the chart below, the value of the U.S. dollar increased by about 25% from mid-2014 to early-2015, in part because of diverging global central bank policies (more hawkish U.S. Fed vs. more dovish ECB/international central banks). Since that spike, the dollar has settled into a broad range (95 – 100), and the former forceful headwind have now turned into modest tailwinds. This trend is important because an estimated 35-40% of corporate profits are derived from international operations.
Adding insult to injury, the roughly greater than -70% decline in forward energy earnings over the last 18 months has caused a significant hit to overall S&P 500 profits. The tide appears to be finally turning (or at least stabilizing) however, as we’ve seen oil prices rebound by about +30% this year from the lows in January. If these aforementioned trends persist, profit pressures in 2016 are likely to abate significantly, and may actually become additive to growth.
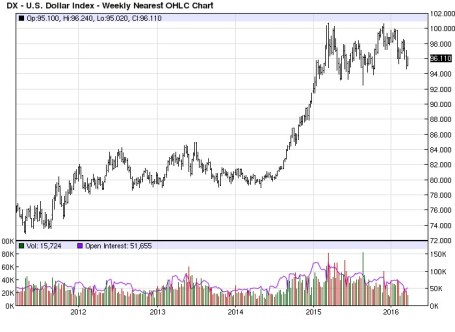
Source: Barchart.com
Profits are important, but so are interest rates. While incessant talk about the path of future Fed policy continues to blanket the airwaves (see also Fed Fatigue), absent a rapid increase in interest rates (say 300-400 basis points), interest rates remain unambiguously positive for equity markets, providing a floor for the oft-repeated volatility in financial markets. As long as stocks are providing higher yields than many bonds, and depositors are earning 0% (or negative rates) on their checking accounts, stocks may remain unloved, but not forgotten.
And speaking of unloved, the sentiment for stocks remains sour. One need look no further than the quarter-billion dollars in hemorrhaging outflows out of U.S. equity funds (see ICI Long-Term Mutual Fund Flows) since 2014. This deep underlying skepticism serves as a positive contrarian indicator for future equity prices. Right now, very few individual investors are swimming in the pool – the time to get out of the stock market pool is when everyone is jumping in.
And lastly, valuations remain very much in line with historical averages (approximatqely 17x 2016 projected earnings), especially considering the generational low in interest rates. Bears continue to point to the elevated CAPE ratio, which has been a disastrous indicator the last seven years (and longer), as a reason to remain cautious. The ironic part is that valuations are virtually guaranteed to improve a few years from now as we roll off the artificially depressed years of 2008-2010.
When you add it all up, zero (or negative) interest rates, combined with the other key factors of profits, sentiment, and valuations, equities remain an important and attractive part of a diversified long-term portfolio. Your objectives, time horizon, and risk tolerance will always drive the proportion of your equity allocation. Nevertheless, some bond exposure is essential to smooth out volatility. Regardless of your investment strategy, chasing headlines, like a dog chasing a car, serves no purpose other than leaving you with a tired, unproductive investment portfolio.
Wade W. Slome, CFA, CFP®
Plan. Invest. Prosper.
DISCLOSURE: Sidoxia Capital Management (SCM) and some of its clients own certain exchange traded funds, but at the time of publishing SCM had no direct position in any other security referenced in this article. No information accessed through the Investing Caffeine (IC) website constitutes investment, financial, legal, tax or other advice nor is to be relied on in making an investment or other decision. Please read disclosure language on IC “Contact” page.
Shoot Now, Ask Later
![940614_83408820[1]](https://investingcaffeine.com/wp-content/uploads/2011/08/940614_834088201.jpg?w=311&h=230)
Since the start of 2016, investor sentiment has led to a shoot now, ask questions later mentality. In the court of economic justice, all stocks have been convicted guilty of recession despite the evidence and defense that proves the economy innocent. Even the Federal Reserve Chair Janet Yellen did not prove to be a great public defender of the economy with her comments that negative interest rates are on the table.
With large cap stocks down -13% and small cap stocks losing -25% from 2015, there are a mixture of indicators suggesting a looming recession could be coming. For example, banking stocks, the beating heart of the U.S. economy, saw prices collapse almost -30% from the 2015 highs this week. As CNBC pointed out, “American Airlines (AAL), United Continental (UAL), General Motors (GM) and Ford (F) all sell for five times 2016 earnings” – about a 70% discount to the average S&P 500 stock. As a group, these economically sensitive cyclical stocks grew earnings per share greater than 50%, while their stock prices are down by more than -30% from their 52-week highs. In general, the cyclicals are serving jail time, even though growth has been gangbusters and the current valuations massively discounted.
On the flip side, defensive stocks with little-to-no revenue growth like “Campbell Soup (CPB) trade at 20 times earnings, Kimberly-Clark (KMB) is at 21 times earnings, Procter & Gamble (PG) is at 22 times earnings and Clorox (CLX) is at 25 times earnings. All of these stocks are near 52-week highs.”
Confused? Well, if we are indeed going into recession, than this valuation dichotomy between cyclicals and staples makes sense. Stocks can be a leading indicator (i.e., predictor) of future recessions, but as the famed Nobel Prize winner in economics Paul Samuelson noted, “The stock market has forecast nine of the last five recessions.”
On the other hand, if this current correction is a false recession scare, then now would be a tremendous buying opportunity. In fact, over the last five years, there have been plenty of tremendous buying opportunities for those courageous long-term investors willing to put capital to work during these panic periods (see also Groundhog Day All Over Again):
- 2011: Debt Downgrade/Debt Ceiling Debate/European PIIGS Crisis (-22% correction)
- 2012:Arab Spring/Greek “Gr-Exit” Fears (-11% correction)
- 2013: Fed Taper Tantrum (-8% correction)
- 2014: Ebola Outbreak (-10% correction)
- 2015: China Slowdown Fears (-13% correction in August)
- 2016 (1st Six Weeks): Strong Dollar, Collapsing Oil, interest Rate Hikes/Negative Rates, Weakening China (-15% correction)
- 2016 (Next 46 Weeks): ??????????
Today’s threats rearing their ugly heads have definite recession credibility, but if you think about the strong dollar, collapsing oil prices, Fed monetary policies, weakening Chinese economy, and negative global interest rates, all of these threats existed well before stock prices nose-dived during the last six weeks. If the economic court is judging the current data for potential recession evidence, making a case and proving the economy guilty is challenging. It’s tough to find a recession when we witness a low unemployment rate (4.9%); record corporate profits (ex-energy); record car sales (17.5 million); an improving housing market; a positively sloped yield curve; healthy banking and consumer balance sheets; sub-$2/gallon gasoline; and a flattening U.S. dollar, among other factors.
Could stock prices be clairvoyantly predicting Armageddon? Sure, anything is possible…but this scenario is unlikely now. Even if the U.S. economy is headed towards a recession, the -20% plunge in stock prices is already factoring in most, if not all, of a mild-to-moderate recession. If the economic data does actually get worse, there is still room for stock prices to go down. Under a recession scenario, the tremendous buying opportunities will only get better. While weak hands may be shooting (selling) first and asking questions later, now is the time for you to use patience and discipline. These characteristics will serve as bullet proof vest for your investment portfolio and lead to economic justice over the long-term.
Wade W. Slome, CFA, CFP®
Plan. Invest. Prosper.
DISCLOSURE: Sidoxia Capital Management (SCM) and some of its clients hold positions in certain exchange traded funds (ETFs) and non-discretionary positions in PG, and KMB, but at the time of publishing had no direct position in AAL, CLX, CPB, F, GM, UAL, or any other security referenced in this article. No information accessed through the Investing Caffeine (IC) website constitutes investment, financial, legal, tax or other advice nor is to be relied on in making an investment or other decision. Please read disclosure language on IC Contact page.
Financial Markets Recharge with a Nap…Zzzzzz

This article is an excerpt from a previously released Sidoxia Capital Management complimentary newsletter (January 4, 2016). Subscribe on the right side of the page for the complete text.
Did you enjoy your New Year’s festivities? If you were like me and ate excessively and drank too much egg nog, you may have decided along the line to take a nap. It’s not a bad idea to recharge those batteries before implementing those New Year’s resolutions and jumping on the treadmill. That’s exactly what happened in the financial markets this year. After six consecutive years of positive returns in the Dow Jones Industrial Average (2009 – 2014), stock markets took a snooze in 2015, as measured by the S&P 500 and Dow, which were each down -0.7% and -2.2%, respectively. And bonds didn’t fare any better, evidenced by the -1.9% decline in the Aggregate Bond ETF (AGG), over the same time period. Given the deep-seated fears about the Federal Reserve potentially catapulting interest rates higher in 2015, investors effectively took a big yawn by barely nudging the 10-year Treasury Note yield higher by +0.1% from 2.2% to 2.3%.
Even though 2015 ended up being a quiet year overall, there were plenty of sweet dreams mixed in with scary nightmares during the year-long nap:
INVESTMENT SWEET DREAMS
Diamonds in the Rough: While 2015 stock prices were generally flat to down around the globe (Vanguard Total Word -4.2%), there was some sunshine and rainbows gleaming for a number of segments in the market. For example, handsome gains were achieved in the NASDAQ index (+5.7%); Biotech Index – BTK (+10.9%); Consumer Discretionary ETF – XLY (+8.3%); Health Care ETF – VHT (+5.8%); Information Technology ETF – VGT (+4.6%); along with numerous other investment areas.
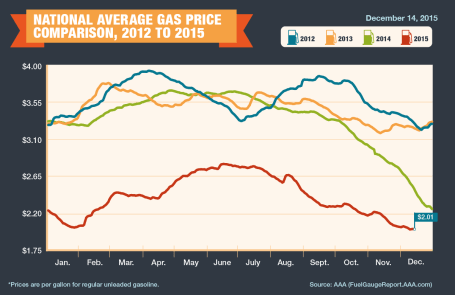
Fuel Fantasy Driven by Low Gas Prices: Gas prices averaged $2.01 per gallon nationally in December (see chart below), marking the lowest prices seen since 2009. Each penny in lower gas prices roughly equates to $1 billion in savings, which has strengthened consumers’ balance sheets and contributed to the multi-year economic expansion. Although these savings have partially gone to pay down personal debt, these gas reserves have also provided a financial tailwind for record auto sales (estimated 17.5million in 2015) and a slow but steady recovery in the housing market. The outlook for “lower-for-longer” oil prices is further supported by an expanding oil glut from new, upcoming Iranian supplies. Due to the lifting of economic sanctions related to the global nuclear deal, Iran is expected to deliver crude oil to an already over-supplied world energy market during the first quarter of 2016. Additionally, the removal of the 40-year ban on U.S. oil exports -could provide a near-term ceiling on energy prices as well.
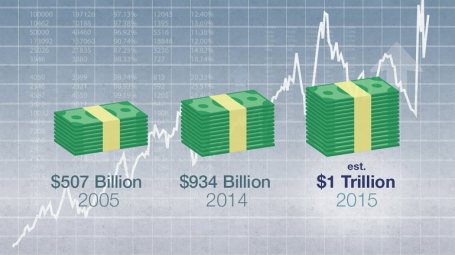
Counting Cash Cows
Catching some shut-eye after reading frightening 2015 headlines on the China slowdown, $96 billion Greek bailout/elections, and Paris/San Bernardino terrorist attacks forced some nervous investors to count sheep to fall asleep. However, long-term investors understand that underpinning this long-lived bull market are record revenues, profits, and cash flows. The record $4.7 trillion dollars in 2015 estimated mergers along with approximately $1 trillion in dividends and share buybacks (see chart below) is strong confirmation that investors should be concentrating on counting more cash cows than sheep, if they want to sleep comfortably.
INVESTMENT NIGHTMARES
Creepy Commodities: Putting aside the -30% collapse in WTI crude oil prices last year, commodity investors overall were exhausted in 2015. The -24% decline in the CRB Commodity Index and the -11% weakening in the Gold Index (GLD) was further proof that a strong U.S. dollar, coupled with stagnant global growth, caused investors a lot of tossing and turning. While bad for commodity exporting countries, the collapse in commodity prices will ultimately keep a lid on inflation and eventually become stimulative for those consumers suffering from lower standards of living.
Dollar Dread: The +25% spike in the value of the U.S. dollar over the last 18 months has made life tough for multinational companies. If your business received approximately 35-40% of their profits overseas and suddenly your goods cost 25% more than international competitors, you might grind your teeth in your sleep too. Monetary policies around the globe, including the European Union, will have an impact on the direction of future foreign exchange rates, but after a spike in the value of the dollar in early 2015, there are signs this scary move may now be stabilizing. Although multinationals are getting squeezed, now is the time for consumers to load up on cheap imports and take that bargain foreign vacation they have long been waiting for.
January has been a challenging month the last couple years, and inevitably there will be additional unknown turbulence ahead – the opening day of 2016 not being an exception (i.e., China slowdown concerns and Mideast tensions). However, given near record-low interest rates, record corporate profits, and accommodative central bank policies, the 2015 nap taken by global stock markets should supply the necessary energy to provide a lift to financial markets in the year ahead.
Wade W. Slome, CFA, CFP®
Plan. Invest. Prosper.
DISCLOSURE: Sidoxia Capital Management (SCM) and some of its clients hold positions VHT, AGG, and in certain exchange traded funds (ETFs), but at the time of publishing had no direct position VT, BTK, XLY, VGT, GLD, or in any other security referenced in this article. No information accessed through the Investing Caffeine (IC) website constitutes investment, financial, legal, tax or other advice nor is to be relied on in making an investment or other decision. Please read disclosure language on IC Contact page.
Sweating in the Doctor’s Waiting Room

My palms are clammy, heart-rate is elevated, and sweat has begun to drip down my brow. There I sit with my hands clenched in the doctor’s office waiting room. I’m trying to mentally prepare for the inevitable poking, prodding, and personal invasion, which will likely involve numerous compromising cavity searches from head to toe. The fun usually doesn’t end until a finale of needle piercing vaccinations and blood tests are completed.
Every year I go through the same mental fatigue war, battling every fear, uncertainty, and doubt. Will the doctor find a new ailment? How many shots will I have to get? Am I going to die?! Ultimately it never turns out as badly as I expect and I come out each and every doctor’s appointment saying, “Well, that wasn’t as bad as I thought it was going to be.”
Investors have been nervously sitting in the waiting room of the Federal Reserve for the last nine years (2006), which marks the last time the Fed increased the interest rate target for the Federal Funds rate. In arguably the slowest economic recovery since World War II, pundits, commentators, bloggers, strategists, and economists have been speculating about the timing of the Fed’s first rate hike of this economic cycle. Like anxious patients, investors have fretted about the reversal of our country’s unprecedented zero interest rate monetary policy (ZIRP).
Despite dealing with the most communicative Federal Reserve in a few generations signaling its every thought and concern, uncertainty somehow continues to creep into investors’ psyches and reign supreme. We witnessed this same volatility occur between 2012-2014 when Ben Bernanke and the Fed decided to phase out the $4.5 trillion quantitative easing (QE) bond buying program. At the time, many people felt the financial markets were being artificially propped up by the money printing feds, and once QE ended, expectations were for exploding interest rates and the stock market/economy to fall like a house of cards. As we all know, that prediction turned out to be the furthest from the truth. In fact, quite the opposite occurred. Investors took their medicine (halting of QE) and the market proceeded to move upwards by about +40% from the initial “taper tantrum” (talks of QE ending in spring of 2012) until the actual QE completion in October 2014.
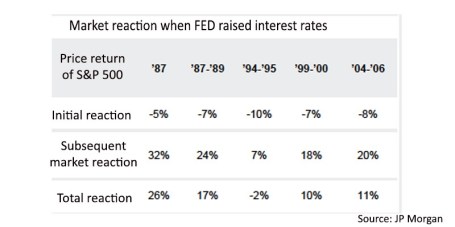
The thought of rate hike cycles are never fun, but after swallowing the initial rate hike pill, investors will feel just fine after coming to terms with the gentle trajectory of future interest rate increases. The behavioral model of 1) investor fear, then 2) subsequent relief has been a recurring process throughout economic history. As you can see below, the bark of Federal Reserve interest rate target hikes has been much worse than the bite. Initially there is a modest negative reaction (approximately -7% decline in stock prices) and then a significant positive reaction (about +21%).
With an ultra-dove Fed Chief in charge, this rate hike cycle should look much different than prior periods. Chairwoman Yellen has clearly stated, “Even after the initial increase in the target funds rate, our policy is likely to remain highly accommodative.” Her colleague, New York Fed Chair William Dudley, has supported this idea by noting the path of rate hikes will be “shallow.”
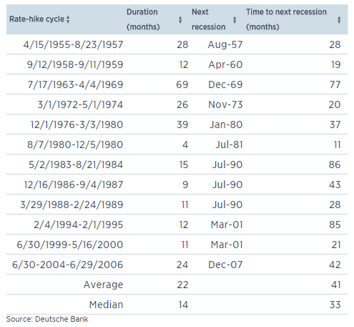
Even if you are convinced rate hikes will cause an immediate recession, history is not on your side as shown in the study below. On average, since 1955, the time to a next recession after a Fed Rate hike takes an average of 41 months (ranging from 11 months to as long as 86 months).
As a middle aged man, one would think I would get used to my annual doctor’s check-up, but somehow fear manages to find a way of asserting itself. Investors’ have been experiencing the same anxiety as anticipation builds before the first interest rate hike announcement – likely this week. Markets may continue their jitteriness in front of the Fed’s announcement, but based on history, a ¼ point hike is more likely to be a prescription of economic confidence than economic doom. Everyone should feel much better leaving the waiting room after Janet Yellen finally begins normalizing an unsustainably loose monetary policy.
Wade W. Slome, CFA, CFP®
Plan. Invest. Prosper.
DISCLOSURE: Sidoxia Capital Management (SCM) and some of its clients own certain exchange traded funds, but at the time of publishing SCM had no direct position in any other security referenced in this article. No information accessed through the Investing Caffeine (IC) website constitutes investment, financial, legal, tax or other advice nor is to be relied on in making an investment or other decision. Please read disclosure language on IC “Contact” page.
Extrapolation: Dangers of the Reckless Ruler

The game of investing would be rather simple if everything moved in a straight line and economic data points could be could be connected with a level ruler. Unfortunately, the real world doesn’t operate that way – data points are actually scattered continuously. In the short-run, inflation, GDP, exchange rates, interest rates, corporate earnings, profit margins, geopolitics, natural disasters, financial crises, and an infinite number of other factors are very difficult to predict with any accurate consistency. The true way to make money is to correctly identify long-term trends and then opportunistically take advantage of the chaos by using the power of mean reversion. Let me explain.
Take for example the just-released October employment figures, which on the surface showed a blowout creation of +271,000 new jobs during the month (unemployment rate decline to 5.0%) versus the Wall Street consensus forecast of +180,000 (flat unemployment rate of 5.1%). The rise in new workers was a marked acceleration from the +137,000 additions in September and the +136,000 in August. The better-than-expected jobs numbers, the highest monthly addition since late 2014, was paraded across television broadcasts and web headlines as a blowout number, which gives the Federal Reserve and Chairwoman Janet Yellen more ammunition to raise interest rates next month at the Federal Open Market Committee meeting. Investors are now factoring in roughly a 70% probability of a +0.25% interest rate hike next month compared to an approximately 30% chance of an increase a few weeks ago.
As is often the case, speculators, traders, and the media rely heavily on their trusty ruler to connect two data points to create a trend, and then subsequently extrapolate that trend out into infinity, whether the trend is moving upwards or downwards. I went back in time to explore the media’s infatuation with limitless extrapolation in my Back to the Future series (see Part I; Part II; and Part III). More recently, weakening data in China caused traders to extrapolate that weakness into perpetuity and pushed Chinese stocks down in August by more than -20% and U.S. stocks down more than -10%, over the same timeframe.
While most of the media coverage blew the recent jobs number out of proportion (see BOOM! Big Rebound in Job Creation), some shrewd investors understand mean reversion is one of the most powerful dynamics in economics and often overrides the limited utility of extrapolation. Case in point is blogger-extraordinaire Scott Grannis (Calafia Beach Pundit) who displayed this judgment when he handicapped the October jobs data a day before the statistics were released. Here’s what Grannis said:
The BLS’s estimate of private sector employment tends to be more volatile than ADP’s, and both tend to track each other over time. That further suggests that the BLS jobs number—to be released early tomorrow—has a decent chance of beating expectations.
Now, Grannis may not have guaranteed a specific number, but comparing the volatile government BLS and private sector ADP jobs data (always released before BLS) only bolsters the supremacy of mean reversion. As you can see from the chart below, both sets of data have been highly correlated and the monthly statistics have reliably varied between a range of +100k to +300k job additions over the last six years. So, although the number came in higher than expected for October, the result is perfectly consistent with the “slowly-but-surely” growing U.S. economy.
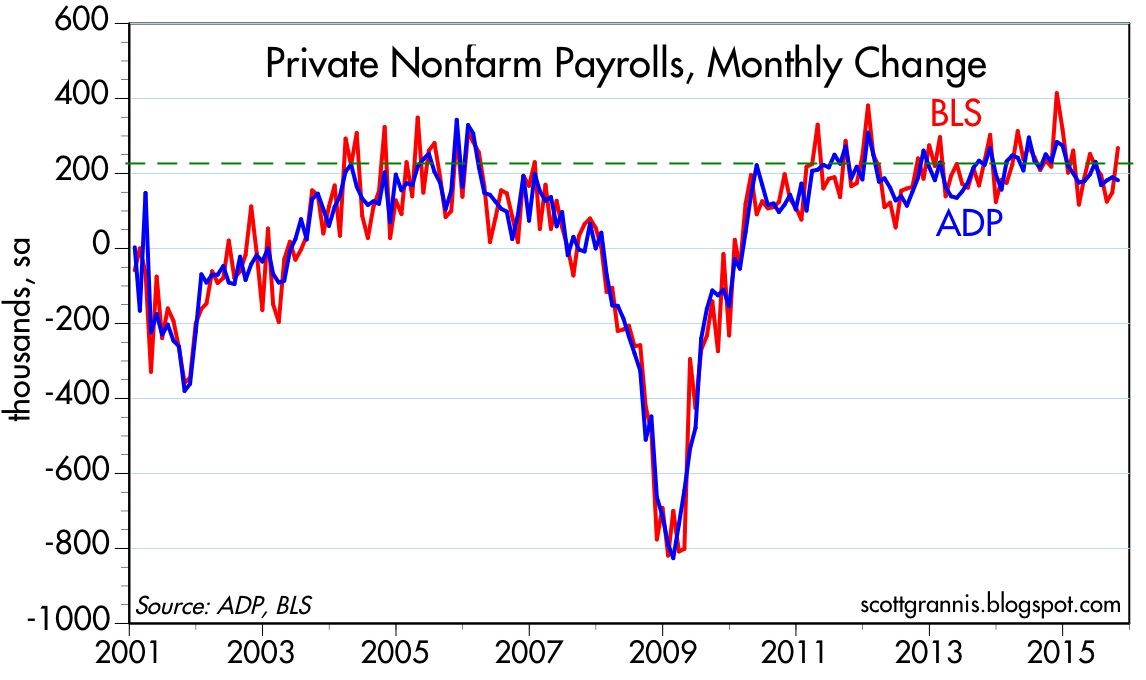
Source: Calafia Beach Pundit
While I spend much more time picking stocks than picking the direction of economic statistics, even I will agree there is a high probability the Fed moves interest rates next month. But even if Yellen acts in December, she has been very clear that this rate hike cycle will be slower than previous periods due to the weak pace of economic expansion. I agree with Grannis, who noted, “Higher rates would be a confirmation of growth, not a threat to growth.” Whatever happens next month, do yourself a favor and keep the urge of extrapolation at bay by keeping your pencil and ruler in your drawer.
Wade W. Slome, CFA, CFP®
Plan. Invest. Prosper.
DISCLOSURE: Sidoxia Capital Management (SCM) and some of its clients hold positions in certain exchange traded funds (ETFs) , but at the time of publishing, SCM had no direct position in any other security referenced in this article. No information accessed through the Investing Caffeine (IC) website constitutes investment, financial, legal, tax or other advice nor is to be relied on in making an investment or other decision. Please read disclosure language on IC Contact page.
More Treats, Less Tricks

This article is an excerpt from a previously released Sidoxia Capital Management complimentary newsletter (November 2, 2015). Subscribe on the right side of the page for the complete text.
Have you finished licking the last of your Halloween chocolate-covered fingers and scheduled your next cavity-filled dental appointment? After a few challenging months, the normally spooky month of October produced an abundance of sweet treats rather than scary tricks for stock market investors. In fact, the S&P 500 index finished the month with a whopping +8.3% burst, making October the tastiest performing month since late 2010. This came in stark contrast to the indigestion experienced with the -8.7% decline over the previous two months.
What’s behind all these sweet gains? For starters, fears of a Chinese economic sugar-high ending in a crash have abated for now. With that said, “Little Red Riding Hood” is not out of the woods quite yet. Like a surprising goblin or ghost popping out to scare you at a Halloween haunted house, China could still rear its ugly head in the future due to its prominent stature as the second largest global economy. We have been forced to deal with similar on-again-off-again concerns associated with Greece.
The good news is the Chinese government and central bank are not sitting on their hands. In addition to interest rate cuts and corruption crackdowns, Chinese government officials have even recently halted its decades-long one-child policy. China’s new two-child policy is designed to spur flagging economic growth and also reverse the country’s aging demographic profile.
Also contributing to the stock market’s sugary October advances is an increasing comfort level with the Federal Reserve’s eventual interest rate increase. Just last week, the central bank released the statement from its October Federal Open Market Committee meetings stating it will determine whether it will be “appropriate” to increase interest rates at its next meetings, which take place on December 15th and 16th. Interest rate financial markets are now baking in a roughly 50% probability of a Fed interest rate hike next month. Initially, the October Fed statement was perceived negatively by investors due to fears that higher rates could potentially choke off economic growth. Within a 30 minute period after the announcement, stock prices reversed course and surged higher. Investors interpreted the Fed signal of a possible interest rate hike as an upbeat display of confidence in a strengthening economy.
As I have reiterated on numerous occasions (see also Fed Fatigue), a +0.25% increase in the Federal Funds rate from essentially a level of 0% is almost irrelevant in my eyes – just like adjusting the Jacuzzi temperature from 102 degrees down to 101 degrees is hardly noticeable. More practically speaking, an increase from 14.00% to 14.25% on a credit card interest rate will not deter consumers from spending, just like a 3.90% mortgage rising to 4.15% will not break the bank for homebuyers. On the other hand, if interest rates were to spike materially higher by 3.00% – 4.00% over a very short period of time, this move would have a much more disruptive impact, and would be cause for concern. Fortunately for equity investors, this scenario is rather unlikely in the short-run due to virtually no sign of inflation at either the consumer or worker level. Actually, if you read the Fed’s most recent statement, Fed Chairwoman Janet Yellen indicated the central bank intends to maintain interest rates below “normal” levels for “some time” even if the economy keeps chugging along at a healthy clip.
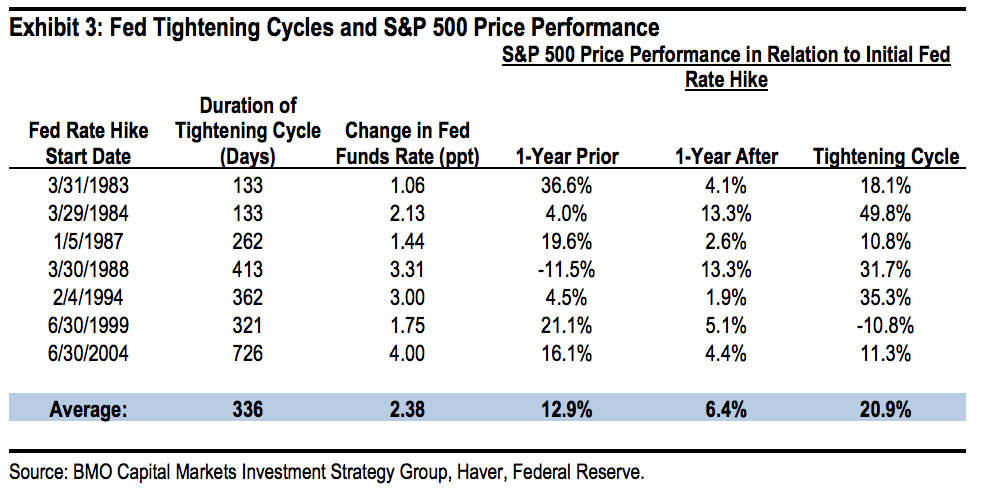
If you think my interest rate perspective is the equivalent of me whistling past the graveyard, history proves to be a pretty good guide of what normally happens after the Fed increases interest rates. Bolstering my argument is data observed over the last seven Federal Reserve interest rate hike cycles from 1983 – 2006 (see table below). As the statistics show, stock prices increased an impressive +20.9% on average over Fed interest rate “Tightening Cycles.” It is entirely conceivable that the announcement of a December interest rate hike could increase short-term volatility. We saw this rate hike fear phenomenon a few months ago, and also a few years ago in 2013 (see also Will Rising Rates Murder Market?) when Federal Reserve Chairman Ben Bernanke threatened an end to quantitative easing (a.k.a., “Taper Tantrum”), but eventually people figured out the world was not going to end and stock prices ultimately moved higher.
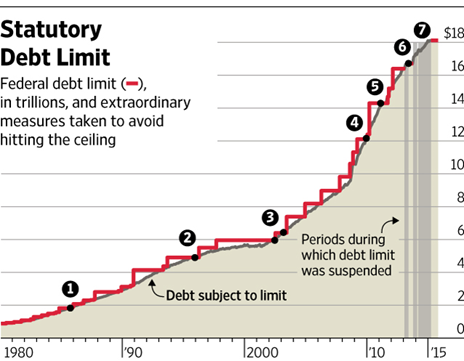
Besides increased comfort with Fed interest rate policies, another positive contributing factor to the financial market rebound was the latest Congressional approval of a two-year budget deal that prevents the government from defaulting on its debt. Not only does the deal suspend the $18.1 trillion debt limit through March 2017 (see chart below), but the legislation also lowers the chance of a government shutdown in December. Rather than creating a contentious battle for the fresh, incoming Speaker of the House (Paul Ryan), the approved budget deal will allow the new Speaker to start with a clean slate with which he can use to negotiate across a spectrum of political issues.
Source: Wall Street Journal
Remain Calm – Not Frightened
Humans, including all investors, are emotional beings, but the best investors separate fear from greed and are masters at making unemotional, objective decisions. Just as everything wasn’t a scary disaster when stocks declined during August and September, so too, the subsequent rise in October doesn’t mean everything is a bed of roses.
Every three months, thousands of companies share their financial report cards with investors, and so far with more than 65% of the S&P 500 companies reporting their results this period, corporate America is not making the honor roll. Collapsing commodity prices, including oil, along with the rapid appreciation in the value of the U.S. dollar (i.e., causing declines in relatively expensive U.S. exports), third quarter profit growth has declined -1%. If you exclude the energy sector from the equation, corporations are still not making the “Dean’s List,” however the report cards look a lot more respectable through this lens with profits rising +6% during the third quarter. A sluggish third quarter GDP (Gross Domestic Product) growth report of +1.5% is further evidence the economy has plenty of room to improve the country’s financial GPA.
Historically speaking, October has been a scary period, if you consider the 1929 and 1987 stock market crashes occurred during this Halloween month. Now that investors have survived this frightening period, we will see if the “Santa Claus Rally” will arrive early this season. Stock market treats have been sweet in recent weeks, but investors cannot lose sight of the long-term. With interest rates near generational lows, investors need to make sure they are efficiently investing their investment funds in a low-cost, tax-efficient, diversified manner, subject to personal time horizons and risk tolerances. Over the long-run, meeting these objectives will create a lot more treats than tricks.
Wade W. Slome, CFA, CFP®
Plan. Invest. Prosper.
DISCLOSURE: Sidoxia Capital Management (SCM) and some of its clients hold positions in certain exchange traded funds (ETFs) , but at the time of publishing, SCM had no direct position in any other security referenced in this article. No information accessed through the Investing Caffeine (IC) website constitutes investment, financial, legal, tax or other advice nor is to be relied on in making an investment or other decision. Please read disclosure language on IC Contact page.


