Posts tagged ‘handicapping’
Sports, Stocks, & the Magic Quadrants

Picking stocks is a tricky game and so is sports betting. With the NFL and NCAA football seasons only a few months away, we can analyze the professional sports-betting industry to better understand the complexities behind making money in the stock market. Anybody who has traveled to Las Vegas, and bet on a sporting event, understands that simply choosing a game winner is not enough for a casino to pay you winnings. You also need to forecast how many points you think a certain team will win or lose by (i.e., the so-called “spread”) – see also What Happens in Vegas, Stays on Wall Street. In the world of stocks, winning/losing is not measured by spreads but rather equities are measured by valuation (e.g., Price/Earnings or P/E ratios).
To make my point, here is a sports betting example from some years back:
Florida Gators vs. Charleston Southern Buccaneers: Without knowing a lot about the powerhouse Southern Buccaneers squad from South Carolina, 99% of respondents polled before the game are likely to unanimously select the winner as Florida – a consistently dominant, nationally ranked powerhouse program. The tougher question becomes trickier if football observers are asked, “Will the Florida Gators win by more than 63 points?”(see picture below). Needless to say, although the Buccs kept it close in the first half, and only trailed by 42-3 at halftime, the Gators still managed to squeak by with a 62-3 victory. Importantly, if you had bet on this game and placed money on the Florida Gators, the overwhelming pre-game favorite, the 59 point margin of victory would have resulted in a losing wager. In order for Gator fans to win money, they would have needed Florida to win by 64 points.

If investing and sports betting were easy, everybody would do it. The reason sports betting is so challenging is due to very intelligent statisticians and odds-makers that create very accurate point spreads. In the investing world, a broad swath of traders, market makers, speculators, investment bankers, and institutional/individual investors set equally efficient valuations over the long-term.
The goal in investing is very similar to sports betting. Successful professionals in both industries are able to consistently identify inefficiencies and then exploit them. Inefficiencies occur for a bettor when point spreads are too high or low, while investors identify inefficient prices in the marketplace by shorting expensive stocks and buying cheap stocks (i.e., undervalued or overvalued).
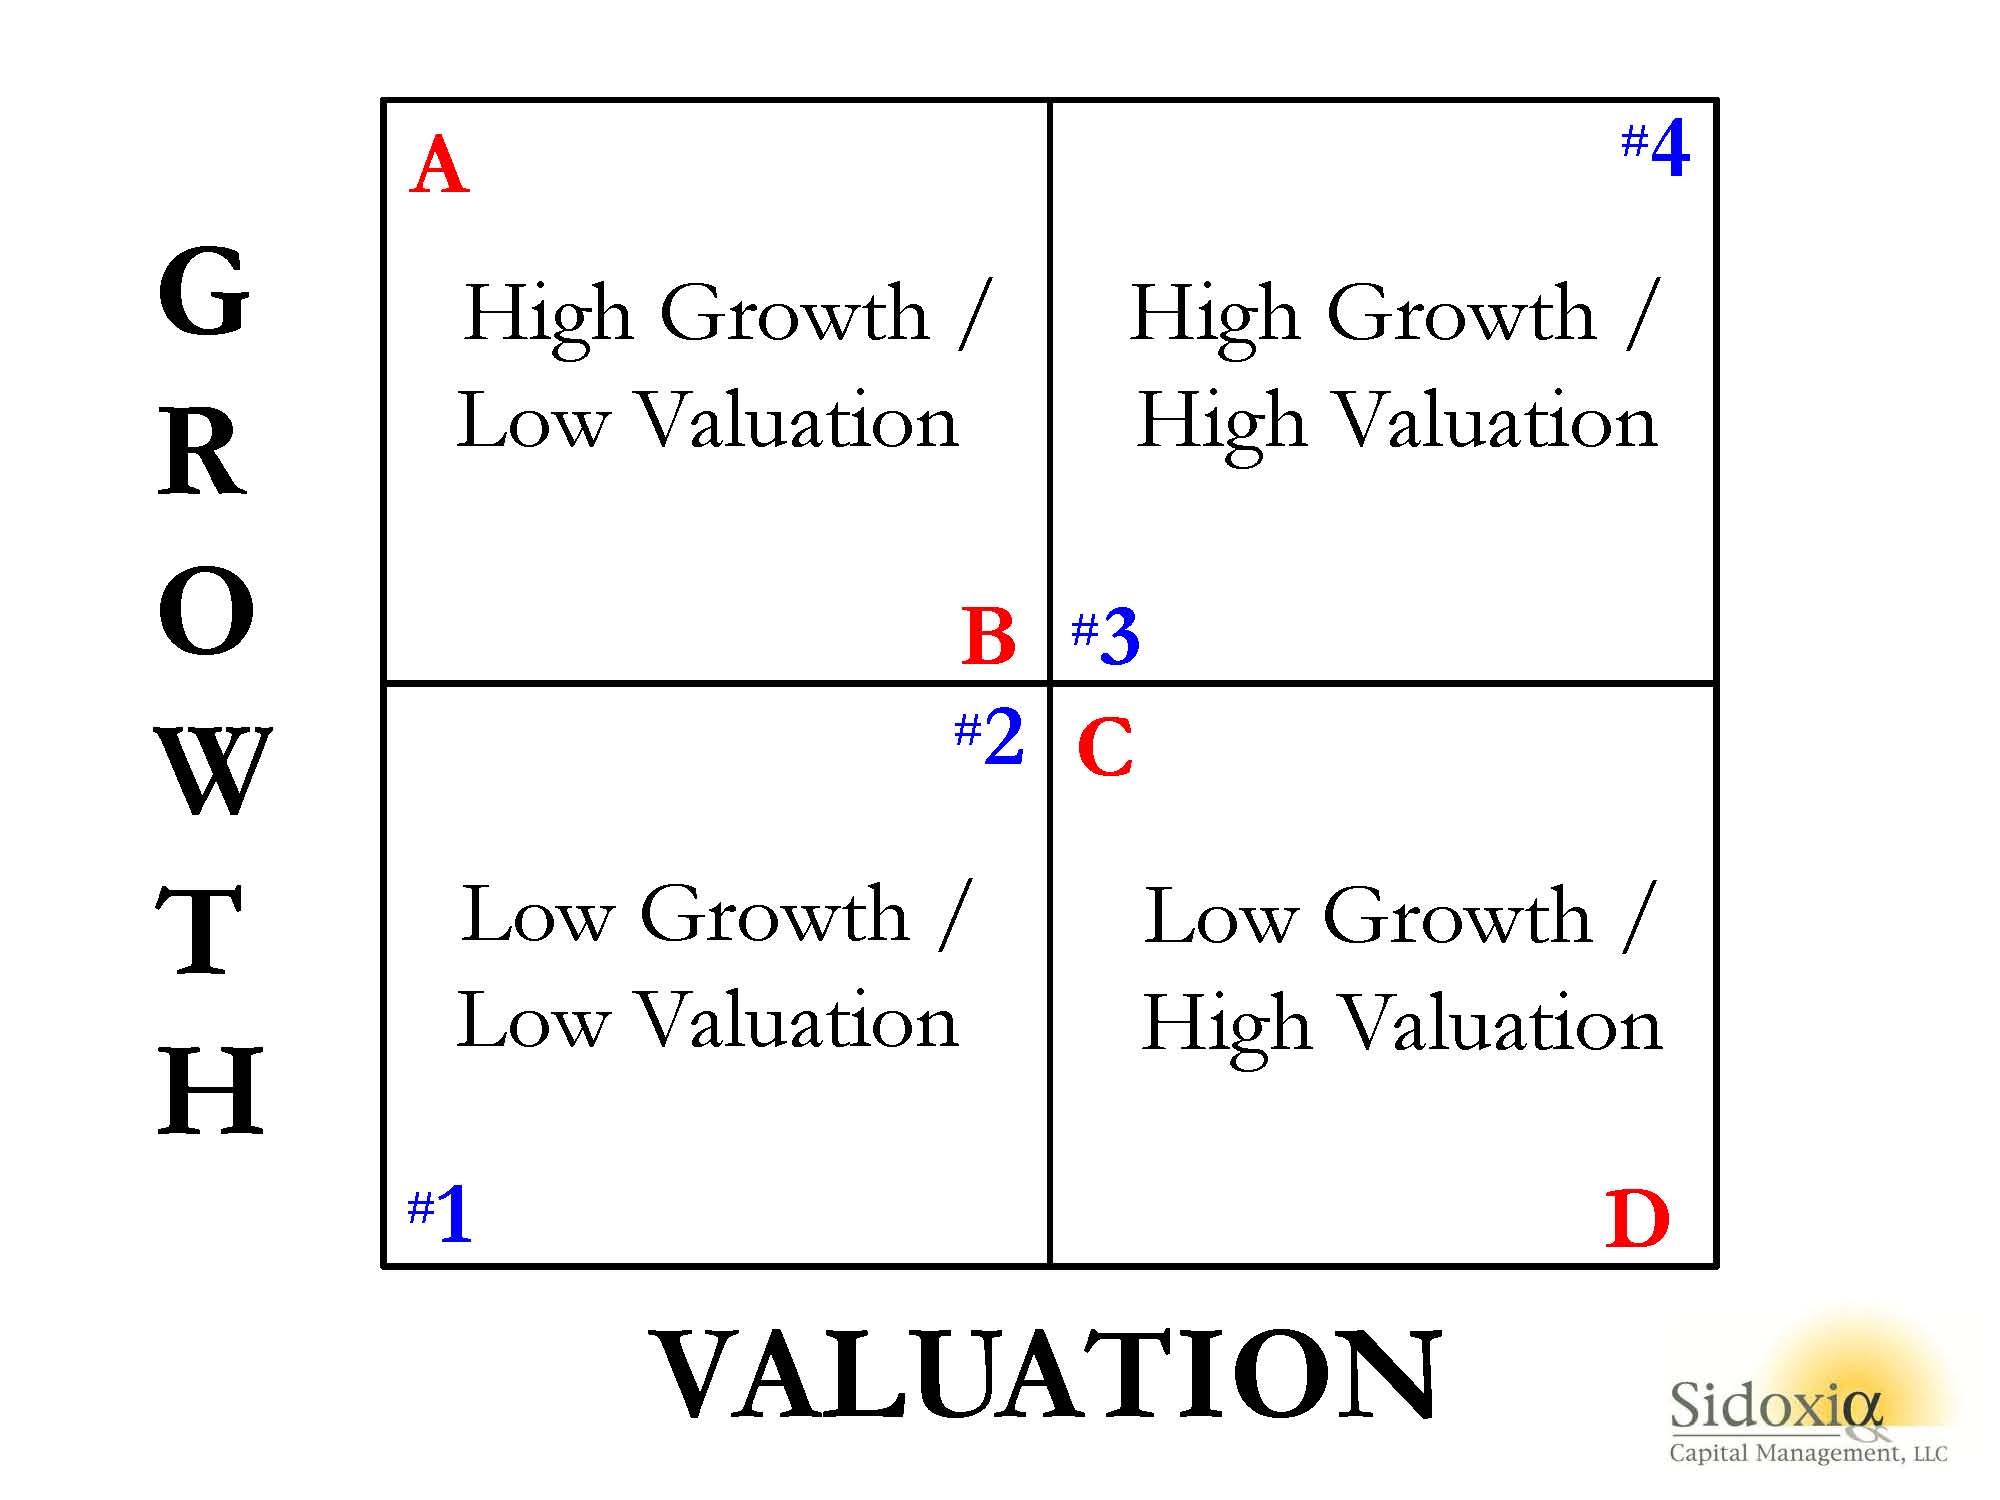
To illustrate my point, let’s take a look at Sidoxia’s “Magic Quadrant“:
 A-B-Cs & 1-2-3s
What Sidoxia’s “Magic Quadrant” demonstrates is a framework for evaluating stocks. By devoting a short period of time reviewing the quadrants, it becomes apparent fairly quickly that Stock A is preferred over Stock B, which is preferred over Stock C, which is preferred over Stock D. In each comparison, the former is preferred over the latter because the earlier letters all have higher growth, and lower (cheaper) valuations. The same relative attractive relationships cannot be applied to stocks #1, #2, #3, and #4. Each successive numbered stock has higher growth, but in order to obtain that higher growth, investors must pay a higher valuation. In other words, Stock #1 has an extremely low valuation with low growth, while Stock #4 has high growth, but an investor must pay an extremely high valuation to own it.
While debating the efficiency of the stock market can escalate into a religious argument, I would argue the majority of stocks fall in the camp of #1, #2, #3, or #4. Or stated differently, you get what you pay for. For example, investors are paying a much higher valuation (high P/E) for Tesla Motors, Inc (TSLA) for its rapid electric car growth vs. paying a much lower valuation (low P/E) for Pitney Bowes Inc (PBI) for its more mature mail equipment business.
The real opportunities occur for those investors capable of identifying companies in the upper-left quadrant (i.e., Stock A) and lower-right quadrant (i.e., Stock D). If the analysis is done correctly, investors will load up on the undervalued Stock A and aggressively short the expensive Stock D. Sidoxia has its own proprietary valuation model (Sidoxia Holy Grail Ranking – SHGR or a.k.a. “SUGAR”) designed specifically to identify these profitable opportunities.
The professions of investing and sports betting are extremely challenging, however establishing a framework like Sidoxia’s “Magic Quadrants” can help guide you to find inefficient and profitable investment opportunities.

Wade W. Slome, CFA, CFP®
Plan. Invest. Prosper.
DISCLOSURE: Sidoxia Capital Management (SCM) and some of its clients hold positions in certain exchange traded funds (ETFs) and TSLA, but at the time of publishing, SCM had no direct position in PBI, or any other security referenced in this article. No information accessed through the Investing Caffeine (IC) website constitutes investment, financial, legal, tax or other advice nor is the information to be relied on in making an investment or other decision. Please read disclosure language on IC Contact page.
Sports, Stocks, & the Magic Quadrants
Picking stocks is a tricky game and so is sports betting. With the NFL and NCAA football seasons swinging into full gear, understanding the complexity of making money in the stock market can be explained in terms of professional sports-betting. Anybody who has traveled to Las Vegas and bet on a sporting event, understands that choosing a winner of a game simply is not enough…you also need to forecast how many points you think a certain team will win by (see also What Happens in Vegas, Stays on Wall Street). In the world of sports, winning/losing is measured by point spreads. In the world of stocks, winning/losing is measured by valuation (e.g., Price/Earnings ratios).
To make my point, here is a sports betting example from a handful years back:
Florida Gators vs. Charleston Southern Buccaneers (September 2009): Without knowing a lot about the powerhouse Southern Buccaneers squad from South Carolina, 99% of respondents, when asked before the game who would win, would unanimously select Florida – a consistently dominant, national franchise, powerhouse program. The question becomes a little trickier when participants are asked, “Will the Florida Gators win by more than 63 points?” Needless to say, although the Buccs kept it close in the first half, and only trailed by 42-3 at halftime, the Gators still managed to squeak by with a 62-3 victory. Worth noting, had you selected Florida, the overwhelming favorite, the 59 point margin of victory would have resulted in a losing wager (see picture below).
If investing and sports betting were easy, everybody would do it. The reason sports betting is so challenging is due to very intelligent statisticians and odds-makers that create very accurate point spreads. In the investing world, a broad swath of traders, market makers, speculators, investment bankers, and institutional/individual investors set equally efficient valuations.
The goal in investing is very similar to sports betting. Successful professionals in both industries are able to consistently identify inefficiencies and then exploit them. Inefficiencies occur for a bettor when point spreads are too high or low, while investors identify inefficient prices in the marketplace (undervalued or overvalued).
To illustrate my point, let’s take a look at Sidoxia’s “Magic Quadrant“:
A-B-Cs & 1-2-3s
What Sidoxia’s “Magic Quadrant” demonstrates is a framework for evaluating stocks. By devoting a short period of time reviewing the quadrants, it becomes apparent fairly quickly that Stock A is preferred over Stock B, which is preferred over Stock C, which is preferred over Stock D. In each comparison, the former is preferred over the latter because the earlier letters all have higher growth, and lower (cheaper) valuations. The same relative attractive relationships cannot be applied to stocks #1, #2, #3, and #4. Each successive numbered stock has higher growth, but in order to obtain that higher growth, investors must pay a higher valuation. In other words, Stock #1 has an extremely low valuation with low growth, while Stock #4 has high growth, but an investor must pay an extremely high valuation to own it.
While debating the efficiency of the stock market can escalate into a religious argument, I would argue the majority of stocks fall in the camp of #1, #2, #3, or #4. Or stated differently, you get what you pay for. For example, investors are paying a much higher valuation (~100x 2014 P/E) for Tesla Motors, Inc (TSLA) for its rapid electric car growth vs. paying a much lower valuation (~10x 2014 P/E) for Pitney Bowes Inc (PBI) for its mature mail equipment business.
The real opportunities occur for those investors capable of identifying companies in the upper-left quadrant (i.e., Stock A) and lower-right quadrant (i.e., Stock D). If the analysis is done correctly, investors will load up on the undervalued Stock A and aggressively short the expensive Stock D. Sidoxia has its own proprietary valuation model (Sidoxia Holy Grail Ranking – SHGR or a.k.a. “SUGAR”) designed specifically to identify these profitable opportunities.
The professions of investing and sports betting are extremely challenging, however establishing a framework like Sidoxia’s “Magic Quadrants” can help guide you to find inefficient and profitable investment opportunities.
Wade W. Slome, CFA, CFP®
Plan. Invest. Prosper.
DISCLOSURE: Sidoxia Capital Management (SCM) and some of its clients hold positions in certain exchange traded funds (ETFs), but at the time of publishing, SCM had no direct position in TSLA, PBI, or any other security referenced in this article. No information accessed through the Investing Caffeine (IC) website constitutes investment, financial, legal, tax or other advice nor is the information to be relied on in making an investment or other decision. Please read disclosure language on IC Contact page.
What Happens in Vegas, Stays on Wall Street
What happens in Vegas, stays in Vegas, unless it’s a habit of betting, in which case that habit will follow you back to Wall Street. Just as there are a million ways to make or lose money by investing or speculating in the market, the same principles apply to sports betting as well. Anybody who has been to Las Vegas and gone to the sportsbook knows how incredibly and insanely accurate the oddsmakers are – I speak from immature experience having traveled there for a healthy number of investment conferences and vacations. The oddsmakers are so accurate; you could say they are almost “efficient” at what they do.
But like the market, in the sports world too, efficiency has a tendency to breakdown occasionally and form bubbles. This dynamic leaves both a huge threat of substantial losses and a potential for windfall gains. Where there are bubbles forming, you are bound to find a large number of excited individuals jumping on a bandwagon. Now, let’s take a look at how the worlds of Wall Street and wagers collide and see if any lessons can be learned.
Jumping on the Stock Bandwagon
band·wag·on [band-wag-uhn]: a party, cause, movement, etc., that by its mass appeal or strength readily attracts many followers.

Photo source: Freshpics.blogspot.com
Everybody loves a winner and no one more so than a fresh fan jumping on the bandwagon. Living in Southern California, the bandwagon is presently fully-loaded with proclaimed Los Angeles Laker fans and USC fans, although the Trojan wagon is currently undergoing repair. It’s easy to identify bandwagoners in sports – just find the face painter, guy with a rainbow afro, Boston native sporting a Kobe Bryant jersey, or the fanatic betting on the team favored by three touchdowns. In the game of stocks, identifying the fickle but passionate followers is a little more subtle. Bandwagon status is not measured by the extent of point spreads (predicted scoring differential between two opponents), but rather by level of P/E ratios (Price-Earnings ratio) or other valuation metric of choice.
While it is clear sports bandwagoners root for the “favorites,” in the realm of investing this translates into piling onto the “growth or momentum” stocks (see Momentum Investing article) – I hate generalizing terms but that’s what we bloggers do. Value investors, on the other hand, root for (buy) the “underdogs.”
To illustrate my point, let’s take a look at a few past bandwagon momentum stocks:
- JDS Uniphase Corp. (JDSU): In 2000 we saw these bandwagoners valuing investor favorites like JDS Uniphase at a whopping $99 billion – meaning investors were willingly paying over 100x’s revenues and 600 x’s trailing earnings to own the stock. At the time, JDSU was a “New Economy” stock that was going to revolutionize the proliferation of bandwidth around the globe with their proprietary optical laser components. For those of you keeping score at home, today JDSU’s stock is valued at approximately $2 billion ($9.97), or -98% less than the market value in March 2000 (split-adjusted peak share price of $1,227.38 per share). If it wasn’t for a 1-for-8 reverse stock split in 2006, then a share of JDSU would fetch you $1.25 today, or less than the amount needed to cover an out of network ATM penalty fee.
- Crocs Inc. (CROX): Crox is another one of my favorite bandwagon stocks, because this loud plastic eyesore footwear was clearly a fad that couldn’t sustain its growth once popularity waned, despite my wife being a bandwagon-ee. Like other fad product-related stocks, the company could no longer maintain its growth once they completed stuffing the channel and their customers cried uncle from choking on inventory. Making matters worse for CROX, knockoff versions were offered for a fraction of the cost at local grocery stores and mall kiosks. After about 20 months post its IPO (Initial Public Offering), the music stopped and within 13 months the stock cratered from a $75 per share peak to $0.79 in 2008. The stock never traded at the absurd dot-com levels, but the lofty 37x P/E in 2007 quickly turned negative after close to $200 million in losses were realized in 2008 and 2009. The stock has since rebounded to $12 and change, and maybe their new Crocs high-heel line of $99.00 shoes (see here) will propel the stock higher…cough, cough.
Point Spread, Point Spread, Point Spread
In sports betting the three most important factors in making a winning bet are point spread, point spread, and point spread. Unlike the March Madness college basketball pool in which you may have participated, in the real world the participant needs to do more than just pick the winning teams – the participant must determine by how much a team will win by. Let’s take a gander at a few actual examples.
- Florida Gators vs. Charleston Southern Buccaneers (9/5/09): Without knowing a lot about the powerhouse squad from South Carolina, 99% of respondents, when asked before the game who would win, would select Florida – a consistently dominant national-powerhouse program. The question gets a little trickier when asked the question: “Will the Florida Gators win by more than 63 points?” That’s exactly the point spread sports bettors faced when deciding whether or not to place the bet – somewhat analogous to the question whether JDSU was a prudent investment at 600x’s earnings? Needless to say, although the Buccs kept it close in the first half, and only trailed by 42-3 at halftime, the Gators still managed to squeak by with a 62-3 victory. Worth noting, the 59 point margin of victory resulted in a losing wager for anyone picking the Gators.
- USC Trojans vs. Stanford Cardinal (10/6/2007): Ranked as the presumptive #1 team of the country pre-season, and entering the game with a 35-0 home-game winning streak, USC was a whopping 41 point favorite over Stanford. On the flip side, the Cardinal came into the game fresh off of a 1-11 losing season the prior year, and in the previous year the Cardinal lost to the Trojans 42-0. Stanford ended up winning the 2007 match-up by a score of 24-23, not only pulling off one of the greatest upsets of all-time, but also spoiling USC’s chances of winning the national championship.
Read more about the greatest upsets of all-time.
Beyond the Point Spread
As you can surmise from our discussion, the same point spread standards apply to investing, but when discussing stocks the spread is measured by various valuation metrics based on earnings, cash flows, book value, EBITDA, sales, and other fundamental growth factors.
Of course, in Las Vegas and on Wall Street not everyone follows traditional fundamental analysis. Some gamblers and speculators will transact solely based on less conventional methods, for example quantitative models, technical analysis and trend review (read Technical Analysis: Astrology or Lob Wedge). For example in sports, handicappers may only wager on teams with five-game winning streaks and winning home records. Whereas on Wall Street, speculators may only trade stocks with positive earnings surprises or “head-and-shoulder” patterns. Hot technicians come and go, but very few real investors survive the long haul without using fundamental analysis and valuation as key components of their winning strategies.
As I have argued, there are many ways to make (and lose) money on Wall Street or in Las Vegas, and consistently jumping on the bandwagon is a sure way to lose. For the successful minority whose performance has endured the test of time, a common thread connecting the two disciplines is the ability to determine and profit from a prudently calculated point spread/valuation. History teaches us that the same effective handicapping skills happening in Las Vegas are the same abilities needed to stay on Wall Street and win.
Wade W. Slome, CFA, CFP®
P.S. See how a pro handicapper conquered Las Vegas and placed sportsbooks on the run.
Plan. Invest. Prosper.
*DISCLOSURE: The undergraduate alma mater of Sidoxia Capital Management’s (SCM) President happens to be UCLA, so although I believe any reference to rival school USC is not provided with any malicious agenda, nonetheless there may exist an inherent conflict of interest. SCM and some of its clients own certain exchange traded funds, but at the time of publishing, SCM had no direct position in JDSU, CROX, or any other security referenced in this article. No information accessed through the Investing Caffeine (IC) website constitutes investment, financial, legal, tax or other advice nor is to be relied on in making an investment or other decision. Please read disclosure language on IC “Contact” page.


