Posts tagged ‘growth’
The Great Rotation

There are many styles of investing, and many ways to make money in the stock market. Just like the styles of men’s ties or women’s dresses come in and out of fashion, so too do the styles of investing. Some stick around for a long time, while other fads flop in short order, leading consumers to rotate into new fashions. I’m still waiting for my Bermuda shorts and pleated pants to come back in style. At this year’s Olympics, the broad array of styles has been on full display.
Growth & Tech in Style
The stock market has been on a one-way freight train riding on the coattails of large capitalization growth stocks, primarily technology stocks, especially those associated with technology and artificial intelligence (AI). You can see the dominance of the Growth style over Value in the 30-year chart below.

Source: Yardeni.com
When the blue line is sloping upwards, that means Growth stocks are outperforming Value stocks, and when sloping downwards, Value stocks are outperforming Growth Stocks. For most of the 1990s, Growth was dominant, and ever since the aftermath of the 2008 Financial Crisis, Growth stocks have once again overshadowed Value stocks a majority of the time (2022 being a short-lived reprieve for Value stocks).
This mega-Growth trend reversed last month (at least temporarily), and investors decided to rotate out of large winners into the previously shunned areas of the market, including Small Cap and Value stocks. You can see in the chart below that Small Caps (S&P 600) have underperformed Large Caps (S&P 500) over the last six years.

Source: Yardeni.com
Is this rotation sustainable? At this point, I’d say it’s too early to tell, but during periods like these, when Wall Street darlings like NVIDIA Corp (NVDA) suffer a large hit (e.g., down -17% for NVDA since the June peak), diversification benefits are pushed to the forefront. The lesson of the year 2000 technology bubble bursting taught a generation of investors that getting overly concentrated in a single sector of technology stocks can be seriously dangerous to your wealth and financial well-being. By selecting a diversity of eggs in your basket, like Value and Small Cap stocks, you can protect your nest egg when there are substantial rotations like we experienced last month. Diversification is a core tenet of our investment philosophy at Sidoxia.
In order to place the recent rotation in perspective, let’s look at how a range of indexes performed last month. The Dow Jones Industrial Average increased a hefty +4.4%, while the S&P 500 finished up modestly +1.1%. As investors rotated out of technology (-3.3% – Technology Select Sector SPDR Fund / XLK), a good chunk of those sales rotated into small cap stocks (+10.3% – iShares Russell 2000 ETF / IWM) and value stocks (+5.1% – iShares Russell 1000 Value ETF / IWD).
Despite concerns over global geopolitics, political election madness, and a slowing economy, investors are more focused on the positive prospect of future interest rate cuts by the Federal Reserve, starting in September with a probability exceeding 90% (see chart below).

Source: CME Group
Some investors got caught up in the dizzying rotation last month, but timing these rotations is nearly impossible and one month does not make a long-term trend. Rather than getting caught up in a fool’s errand, make sure your investment portfolio is diversified and built to withstand volatile rotations.
Wade W. Slome, CFA, CFP®
Plan. Invest. Prosper.
This article is an excerpt from a previously released Sidoxia Capital Management complimentary newsletter (August 1, 2024). Subscribe Here to view all monthly articles.
DISCLOSURE: Sidoxia Capital Management (SCM) and some of its clients hold positions in individual stocks , certain exchange traded funds (ETFs), including NVDA, but at the time of publishing had no direct position in any other security referenced in this article. No information accessed through the Investing Caffeine (IC) website constitutes investment, financial, legal, tax or other advice nor is to be relied on in making an investment or other decision. Please read disclosure language on the IC Contact page.
A Recipe for Disaster

Justice does not always get served in the stock market because financial markets are not always efficient in the short-run (see Black-Eyes to Classic Economists). However, over the long-run, financial markets usually get it right. And when the laws of economics and physics are functioning properly, I must admit it, I do find it especially refreshing.
There can be numerous reasons for stocks to plummet in price, but common attributes to stock price declines often include profit losses and/or disproportionately high valuations (a.k.a. “bubbles”). Normally, your garden variety, recipe for disaster consists of one part highly valued company and one part money-losing operation (or deteriorating financials). The reverse holds true for a winning stock recipe. Flavorful results usually involve cheaply valued stocks paired with improving financial results.
Unfortunately, just because you have the proper recipe of investment ingredients, doesn’t mean you will immediately get to enjoy a satisfying feast. In other words, there isn’t a dinner bell rung to signal the timing of a crash or spike – sometimes there is a conspicuous catalyst and sometimes there is not. Frequently, investments require a longer expected bake time before the anticipated output is produced.
As I alluded to at the beginning of my post, justice is not always served immediately, but for some high profile IPOs, low-quality ingredients have indeed produced low-quality results.
Snap Inc. (SNAP): Let’s first start with the high-flying social media darling Snap, which priced its IPO at $17 per share in March, earlier this year. How can a beloved social media company that generates $515 million in annual revenue (up +286% in the recent quarter) see its stock plummet -48% from its high of $29.44 to $15.27 in just four short months? Well, one way of achieving these dismal results is to burn through more cash than you’re generating in revenue. Snap actually scorched through more than -$745 million dollars over the last year, as the company reported accounting losses of -$618 million (excluding -$2 billion of stock-based compensation expenses). We’ll find out if the financial bleeding will eventually stop, but even after this year’s stock price crash, investors are still giving the company the benefit of the doubt by valuing the company at $18 billion today.

Source: Barchart.com
Blue Apron Holdings Inc. (APRN): Online meal delivery favorite, Blue Apron, is another company suffering from the post-IPO blues. After initially targeting an opening IPO price of $15-$17 per share a few weeks ago, tepid demand forced Blue Apron executives to cut the price to $10. Fast forward to today, and the stock closed at $7.36, down -26% from the IPO price, and -57% below the high-end of the originally planned range. Although the company isn’t hemorrhaging losses at the same absolute level of Snap, it’s not a pretty picture. Blue Apron has still managed to burn -$83 million of cash on $795 million in annual sales. Unlike Snap (high margin advertising revenues), Blue Apron will become a low-profit margin business, even if the company has the fortune of reaching high volume scale. Even after considering Blue Apron’s $1 billion annual revenue run rate, which is 50% greater than Snap’s $600 million run-rate, Blue Apron’s $1.4 billion market value is sadly less than 10% of Snap’s market value.

Source: Barchart.com
Groupon Inc. (GRPN): Unlike Snap and Blue Apron, Groupon also has the flattering distinction of reporting an accounting profit, albeit a small one. However, on a cash-based analysis, Groupon looks a little better than the previous two companies mentioned, if you consider an annual -$7 million cash burn “better”. Competition in the online discounting space has been fierce, and as such, Groupon has experienced a competitive haircut in its share price. Groupon’s original IPO price was $20 in January 2011 before briefly spiking to $31. Today, the stock has languished to $4 (-87% from the 2011 peak).
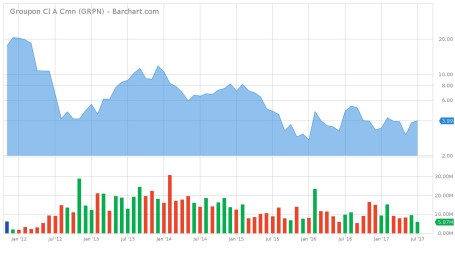
Source: Barchart.com
Stock Market Recipe?
Similar ingredients (i.e., valuations and profit trajectory) that apply to stock performance also apply to stock market performance. Despite record corporate profits (growing double digits), low unemployment, low inflation, low-interest rates, and a recovering global economy, bears and even rational observers have been worried about a looming market crash. Not only have the broader masses been worried today, yesterday, last week, last month, and last year, but they have also been worried for the last nine years. As I have documented repeatedly (see also Market Champagne Sits on Ice), the market has more than tripled to new record highs since early 2009, despite the strong under-current of endless cynicism.
Historically market tops have been marked by a period of excesses, including excessive emotions (i.e., euphoria). It has been a long time since the last recession, but economic downturns are also often marked with excessive leverage (e.g., housing in the mid-2000s), excessive capital (e.g., technology IPOs [Initial Public Offerings] in the late-1990s), and excessive investment (e.g., construction / manufacturing in early-1990s).
To date, we have seen little evidence of these markers. Certainly there have been pockets of excesses, including overpriced billion dollar tech unicorns (see Dying Unicorns), exorbitant commercial real estate prices, and a bubble in global sovereign debt, but on a broad basis, I have consistently said stocks are reasonably priced in light of record-low interest rates, a view also held by Warren Buffett.
The key lessons to learn, whether you are investing in individual stocks or the stock market more broadly, are that prices will follow the direction of earnings over the long-run. This helps explain why stock prices always go down in recessions (and are volatile in anticipation of recessions).
If you are looking for a recipe for disaster, just find an overpriced investment with money-losing (or deteriorating) characteristics. Avoiding these investments and identifying investments with cheap growth qualities is much easier said than done. However, by mixing an objective, quantitative framework with more artistic fundamental analysis, you will be in a position of enjoying tastier returns.

Wade W. Slome, CFA, CFP®
Plan. Invest. Prosper.
DISCLOSURE: Sidoxia Capital Management (SCM) and some of its clients hold positions in certain exchange traded funds (ETFs), but at the time of publishing, SCM had no direct position in SNAP, APRN, GRPN, or any other security referenced in this article. No information accessed through the Investing Caffeine (IC) website constitutes investment, financial, legal, tax or other advice nor is the information to be relied on in making an investment or other decision. Please read disclosure language on IC Contact page.
Sports, Stocks, & the Magic Quadrants

Picking stocks is a tricky game and so is sports betting. With the NFL and NCAA football seasons only a few months away, we can analyze the professional sports-betting industry to better understand the complexities behind making money in the stock market. Anybody who has traveled to Las Vegas, and bet on a sporting event, understands that simply choosing a game winner is not enough for a casino to pay you winnings. You also need to forecast how many points you think a certain team will win or lose by (i.e., the so-called “spread”) – see also What Happens in Vegas, Stays on Wall Street. In the world of stocks, winning/losing is not measured by spreads but rather equities are measured by valuation (e.g., Price/Earnings or P/E ratios).
To make my point, here is a sports betting example from some years back:
Florida Gators vs. Charleston Southern Buccaneers: Without knowing a lot about the powerhouse Southern Buccaneers squad from South Carolina, 99% of respondents polled before the game are likely to unanimously select the winner as Florida – a consistently dominant, nationally ranked powerhouse program. The tougher question becomes trickier if football observers are asked, “Will the Florida Gators win by more than 63 points?”(see picture below). Needless to say, although the Buccs kept it close in the first half, and only trailed by 42-3 at halftime, the Gators still managed to squeak by with a 62-3 victory. Importantly, if you had bet on this game and placed money on the Florida Gators, the overwhelming pre-game favorite, the 59 point margin of victory would have resulted in a losing wager. In order for Gator fans to win money, they would have needed Florida to win by 64 points.

If investing and sports betting were easy, everybody would do it. The reason sports betting is so challenging is due to very intelligent statisticians and odds-makers that create very accurate point spreads. In the investing world, a broad swath of traders, market makers, speculators, investment bankers, and institutional/individual investors set equally efficient valuations over the long-term.
The goal in investing is very similar to sports betting. Successful professionals in both industries are able to consistently identify inefficiencies and then exploit them. Inefficiencies occur for a bettor when point spreads are too high or low, while investors identify inefficient prices in the marketplace by shorting expensive stocks and buying cheap stocks (i.e., undervalued or overvalued).
To illustrate my point, let’s take a look at Sidoxia’s “Magic Quadrant“:
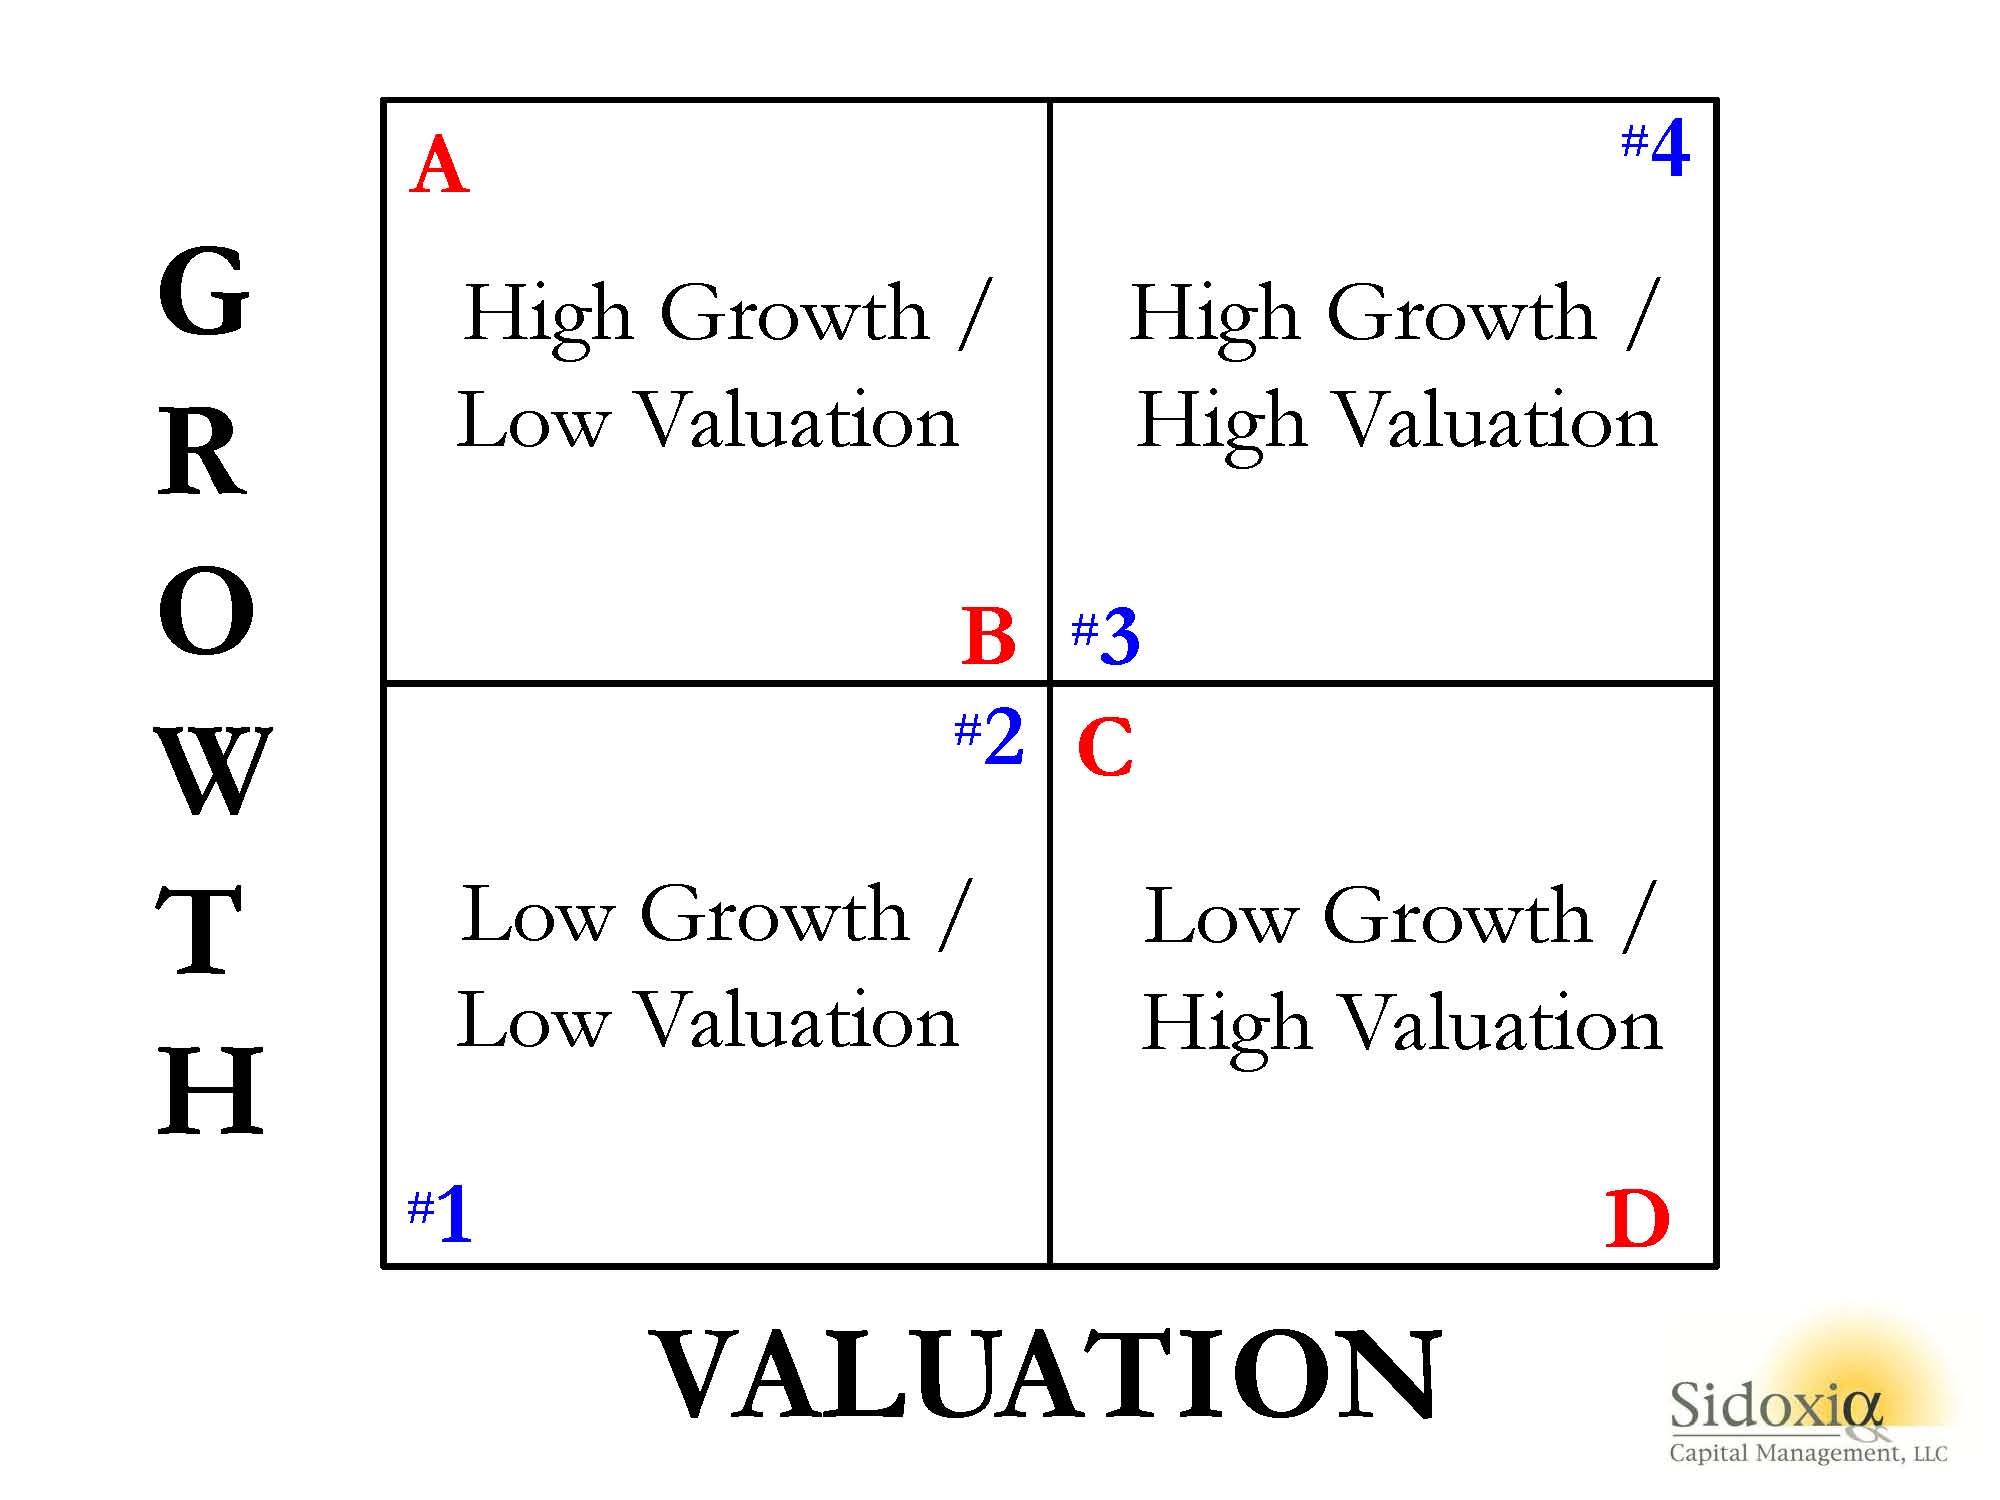 A-B-Cs & 1-2-3s
What Sidoxia’s “Magic Quadrant” demonstrates is a framework for evaluating stocks. By devoting a short period of time reviewing the quadrants, it becomes apparent fairly quickly that Stock A is preferred over Stock B, which is preferred over Stock C, which is preferred over Stock D. In each comparison, the former is preferred over the latter because the earlier letters all have higher growth, and lower (cheaper) valuations. The same relative attractive relationships cannot be applied to stocks #1, #2, #3, and #4. Each successive numbered stock has higher growth, but in order to obtain that higher growth, investors must pay a higher valuation. In other words, Stock #1 has an extremely low valuation with low growth, while Stock #4 has high growth, but an investor must pay an extremely high valuation to own it.
While debating the efficiency of the stock market can escalate into a religious argument, I would argue the majority of stocks fall in the camp of #1, #2, #3, or #4. Or stated differently, you get what you pay for. For example, investors are paying a much higher valuation (high P/E) for Tesla Motors, Inc (TSLA) for its rapid electric car growth vs. paying a much lower valuation (low P/E) for Pitney Bowes Inc (PBI) for its more mature mail equipment business.
The real opportunities occur for those investors capable of identifying companies in the upper-left quadrant (i.e., Stock A) and lower-right quadrant (i.e., Stock D). If the analysis is done correctly, investors will load up on the undervalued Stock A and aggressively short the expensive Stock D. Sidoxia has its own proprietary valuation model (Sidoxia Holy Grail Ranking – SHGR or a.k.a. “SUGAR”) designed specifically to identify these profitable opportunities.
The professions of investing and sports betting are extremely challenging, however establishing a framework like Sidoxia’s “Magic Quadrants” can help guide you to find inefficient and profitable investment opportunities.
Wade W. Slome, CFA, CFP®
Plan. Invest. Prosper.
DISCLOSURE: Sidoxia Capital Management (SCM) and some of its clients hold positions in certain exchange traded funds (ETFs) and TSLA, but at the time of publishing, SCM had no direct position in PBI, or any other security referenced in this article. No information accessed through the Investing Caffeine (IC) website constitutes investment, financial, legal, tax or other advice nor is the information to be relied on in making an investment or other decision. Please read disclosure language on IC Contact page.
Standing on the Shoulders of a Growth Giant: Phil Fisher

Sir Isaac Newton
Since it’s Father’s Day weekend, it seems appropriate to write about about the “Father of Growth Investing”…Phil Fisher.
It was English physicist, astronomer, philosopher, and mathematician Sir Isaac Newton who in 1675 stated, “If I have seen further it is by standing on the shoulders of giants.” Investors too can stand on the shoulders of market giants by studying the timeless financial knowledge from current and past market legends. The press, all too often, focuses on the hot managers of our time while forgetting or kicking to the curb those managers whom are temporarily out of favor. Famous and enduring value managers typically have gained the press spotlight, rightfully so in the case of current greats like Warren Buffett or past talents like Benjamin Graham, because they managed to prosper through numerous economic cycles. However, when it comes to growth legends like Phil Fisher, author of the must-read classic Common Stocks and Uncommon Profits, many people I bump into have never heard of him. Hopefully that will change over time.
The Career
Born on September 8, 1907, Mr. Fisher lived until the ripe age of 96 when he passed on March 4, 2004. Fisher was no dummy – he enrolled in college at age 15 and started graduate school at Stanford a few years later, before he dropped out and started his own investment firm in 1931. His son, Ken, currently heads his own investment firm, Fisher Investments, writes for Forbes magazine, and has authored multiple investment books. Unlike his dad, Ken has more of a natural bent towards value stocks.
Buy-And-Hold

Philip A. Fisher
Phil Fisher’s iconic book, Common Stocks and Uncommon Profits, was published in 1958. Mr. Fisher believed in many things and perhaps would have been thrown under the bus today for his long-term convictions in “buy-and-hold.” Or as Mr. Fisher put it, “If the job has been correctly done when a common stock is purchased, the time to sell it is – almost never.” Not every investment idea made the cut, however he is known to have bought Motorola (MOT) stock in 1955 and held it until his death in 2004 for a massive gain. Generally, he gave initial stock purchases a three-year leash before considering a change to his investment position. If the conviction to purchase a stock for such duration is not present, then the investment opportunity should be ignored.
Fisher’s concentration on growth stocks also shaped his view on dividends. Dividends were not important to Fisher – he was more focused on how the company is investing retained earnings to achieve its earnings growth. Like Fisher, Peter Lynch is another growth hero of mine that also felt there is too much focus on the Price/Earnings (PE) ratio rather than the long-term earnings potential.
“Scuttlebutt”
Another classic trademark of Fisher’s investing style was his commitment to fundamental research. He was focused on accumulating data covering a broad range of areas including, customers, suppliers, and competitors. Fisher also emphasized factors like market share, return on invested capital, margins, and the research & development budget. What Mr. Fisher called his varied approach to gathering diverse sets of information was “scuttlebutt.”
Buying & Selling Points
Although Fisher believed firmly in buy and hold, he was not scared to sell when the firm no longer met the original buying criteria or his original assessment for purchased was deemed incorrect.
When buying, Fisher preferred to buy stocks in downturns or temporary problems – contrary to your typical momentum growth manager today (read article on momentum). Fisher has this to say on the topic: “This matter of training oneself to not go with the crowd but to be able to zig when the crowd zags, in my opinion, is one of the most important fundamentals of the investment success.”
Learning from Mistakes
Like all great investors I have studied, Phil Fisher also believed in learning from your mistakes:
“I have always believed that the chief difference between a fool and a wise man is that the wise man learns from his mistakes, while the fool never does.”
He expanded on the topic by saying the following:
“Making mistakes is inherent cost of investing just like bad loans are for the finest lending institutions. Don’t blindly accept dominant opinion and don’t be contrary for the sake of being contrary.”
I could only dream of having a fraction of Mr. Fisher’s career success – he retired in 1999 at the age of 91 (not bad timing). As my investment management and financial planning firm matures (Sidoxia Capital Management, LLC), I will continue to study the legendary giants of investing (past and present) to sharpen my investing skills.

Wade W. Slome, CFA, CFP®
Plan. Invest. Prosper.
DISCLOSURE: Sidoxia Capital Management (SCM) and some of its clients hold positions in certain exchange traded funds (ETFs), but at the time of publishing, SCM had no direct position in MSI, BRKA/B, or any other security referenced in this article. No information accessed through the Investing Caffeine (IC) website constitutes investment, financial, legal, tax or other advice nor is to be relied on in making an investment or other decision. Please read disclosure language on ICContact page.
Sports, Stocks, & the Magic Quadrants
Picking stocks is a tricky game and so is sports betting. With the NFL and NCAA football seasons swinging into full gear, understanding the complexity of making money in the stock market can be explained in terms of professional sports-betting. Anybody who has traveled to Las Vegas and bet on a sporting event, understands that choosing a winner of a game simply is not enough…you also need to forecast how many points you think a certain team will win by (see also What Happens in Vegas, Stays on Wall Street). In the world of sports, winning/losing is measured by point spreads. In the world of stocks, winning/losing is measured by valuation (e.g., Price/Earnings ratios).
To make my point, here is a sports betting example from a handful years back:
Florida Gators vs. Charleston Southern Buccaneers (September 2009): Without knowing a lot about the powerhouse Southern Buccaneers squad from South Carolina, 99% of respondents, when asked before the game who would win, would unanimously select Florida – a consistently dominant, national franchise, powerhouse program. The question becomes a little trickier when participants are asked, “Will the Florida Gators win by more than 63 points?” Needless to say, although the Buccs kept it close in the first half, and only trailed by 42-3 at halftime, the Gators still managed to squeak by with a 62-3 victory. Worth noting, had you selected Florida, the overwhelming favorite, the 59 point margin of victory would have resulted in a losing wager (see picture below).
If investing and sports betting were easy, everybody would do it. The reason sports betting is so challenging is due to very intelligent statisticians and odds-makers that create very accurate point spreads. In the investing world, a broad swath of traders, market makers, speculators, investment bankers, and institutional/individual investors set equally efficient valuations.
The goal in investing is very similar to sports betting. Successful professionals in both industries are able to consistently identify inefficiencies and then exploit them. Inefficiencies occur for a bettor when point spreads are too high or low, while investors identify inefficient prices in the marketplace (undervalued or overvalued).
To illustrate my point, let’s take a look at Sidoxia’s “Magic Quadrant“:
A-B-Cs & 1-2-3s
What Sidoxia’s “Magic Quadrant” demonstrates is a framework for evaluating stocks. By devoting a short period of time reviewing the quadrants, it becomes apparent fairly quickly that Stock A is preferred over Stock B, which is preferred over Stock C, which is preferred over Stock D. In each comparison, the former is preferred over the latter because the earlier letters all have higher growth, and lower (cheaper) valuations. The same relative attractive relationships cannot be applied to stocks #1, #2, #3, and #4. Each successive numbered stock has higher growth, but in order to obtain that higher growth, investors must pay a higher valuation. In other words, Stock #1 has an extremely low valuation with low growth, while Stock #4 has high growth, but an investor must pay an extremely high valuation to own it.
While debating the efficiency of the stock market can escalate into a religious argument, I would argue the majority of stocks fall in the camp of #1, #2, #3, or #4. Or stated differently, you get what you pay for. For example, investors are paying a much higher valuation (~100x 2014 P/E) for Tesla Motors, Inc (TSLA) for its rapid electric car growth vs. paying a much lower valuation (~10x 2014 P/E) for Pitney Bowes Inc (PBI) for its mature mail equipment business.
The real opportunities occur for those investors capable of identifying companies in the upper-left quadrant (i.e., Stock A) and lower-right quadrant (i.e., Stock D). If the analysis is done correctly, investors will load up on the undervalued Stock A and aggressively short the expensive Stock D. Sidoxia has its own proprietary valuation model (Sidoxia Holy Grail Ranking – SHGR or a.k.a. “SUGAR”) designed specifically to identify these profitable opportunities.
The professions of investing and sports betting are extremely challenging, however establishing a framework like Sidoxia’s “Magic Quadrants” can help guide you to find inefficient and profitable investment opportunities.
Wade W. Slome, CFA, CFP®
Plan. Invest. Prosper.
DISCLOSURE: Sidoxia Capital Management (SCM) and some of its clients hold positions in certain exchange traded funds (ETFs), but at the time of publishing, SCM had no direct position in TSLA, PBI, or any other security referenced in this article. No information accessed through the Investing Caffeine (IC) website constitutes investment, financial, legal, tax or other advice nor is the information to be relied on in making an investment or other decision. Please read disclosure language on IC Contact page.
Sifting Through the Earnings Rubble

An earthquake of second quarter earnings results have rocked the markets (better than expected earnings but sluggish revenues), and now investors are left to sift through the rubble. With thousands of these earnings reports rolling in (and many more in the coming weeks), identifying the key investment trends across sectors, industries, and geographies can be a challenging responsibility. If this was an easy duty, I wouldn’t have a job! Fortunately, having a disciplined process to sort through the avalanche of quarterly results can assist you in discovering both potential threats and opportunities.
But first things first: You will need some type of reliable screening tool in order to filter find exceptional stocks. According to Reuters, there are currently more than 46,000 stocks in existence globally. Manually going through this universe one stock at a time is not physically or mentally feasible for any human to accomplish, over any reasonable amount of time. I use several paid-service screening tools, but there are plenty of adequate free services available online as well.
Investing with the 2-Sided Coin

As Warren Buffett says, “Value and growth are two sides of the same coin.” Having a disciplined screening process in place is the first step in finding those companies that reflect the optimal mix between growth and value. I am willing to pay an elevated price (i.e., higher P/E ratio) for a company with a superior growth profile, but I want a more attractive value (i.e., cheaper price) for slower growth companies. I am fairly agnostic between the mix of the growth/value weighting dynamics, as long as the risk-reward ratio is in my favor.
Since I firmly believe that stock prices follow the long-term trajectory of earnings and cash flows, I fully understand the outsized appreciation opportunities that can arise from the “earnings elite” – the cream of the crop companies that are able to sustain abnormally high earnings growth. Or put in baseball terms, you can realize plenty of singles and doubles by finding attractively priced growth companies, but as Hall of Fame manager Earl Weaver says, “You win many more games by hitting a three-run homer than you do with sacrifice bunts.” The same principles apply in stock picking. Legendary growth investor Peter Lynch (see also Inside the Brain of an Investing Genius) is famous for saying, “You don’t need a lot of good hits every day. All you need is two to three goods stocks a decade.”
Some past successful Sidoxia Capital Management examples that highlight the tradeoff between growth and value include Wal-Mart stores (WMT) and Amazon.com (AMZN). Significant returns can be achieved from slower, mature growth companies like Wal-Mart if purchased at the right prices, but multi-bagger home-run returns (i.e., more than doubling) require high octane growth from the likes of global internet platform companies. Multi-bagger returns from companies like Amazon, Apple Inc. (AAPL), and others are difficult to find and hold in a portfolio for years, but if you can find a few, these winners can cure a lot of your underperforming sins.
Defining Growth
Fancy software may allow you to isolate those companies registering superior growth in sales, earnings, and cash flows, but finding the fastest growing companies can be the most straightforward part. The analytical heavy-lifting goes into effect once an investor is forced to determine how sustainable that growth actually is, while simultaneously determining which valuation metrics are most appropriate in determining fair value. Some companies will experience short-term bursts of growth from a single large contract; from acquisitions; and/or from one-time asset sale gains. Generally speaking, this type of growth is less valuable than growth achieved by innovative products, service, and marketing.
The sustainability of growth will also be shaped by the type of industry a company operates in along with the level of financial leverage carried. For instance, in certain volatile, cyclical industries, sequential growth (e.g. the change in results over the last three months) is the more relevant metric. However for most companies that I screen, I am looking to spot the unique companies that are growing at the healthiest clip on a year-over-year basis. These recent three month results are weighed against the comparable numbers a year ago. This approach to analyzing growth removes seasonality from the equation and helps identify those unique companies capable of growing irrespective of economic cycles.
Given that we are a little more than half way through Q2 earnings results, there is still plenty of time to find those companies reporting upside fundamental earnings surprises, while also locating those quality companies unfairly punished for transitory events. Now’s the time to sift through the earnings rubble to find the remaining buried stock gems.
Wade W. Slome, CFA, CFP®
Plan. Invest. Prosper.
DISCLOSURE: Sidoxia Capital Management (SCM) and some of its clients own certain exchange traded funds and WMT, AMZN, AAPL, but at the time of publishing SCM had no direct position in any other security referenced in this article. No information accessed through the Investing Caffeine (IC) website constitutes investment, financial, legal, tax or other advice nor is to be relied on in making an investment or other decision. Please read disclosure language on IC “Contact” page.
Floating Hedge Fund on Ice Thawing Out

These days, pundits continue to talk about how the same financial crisis plaguing Greece and its fellow PIIGS partners (Portugal, Ireland, Italy & Spain) is about to plow through the eurozone and then ultimately the remaining global economy with no mercy. If all the focus is being placed on a diminutive, calamari-eating, Ouzo-drinking society like Greece, whose economy matches the size of Maryland, then why not evaluate an even more miniscule, PIIGS prequel country…Iceland.
That’s right, the same Iceland that just four years ago people were calling a “hedge fund on ice.” You know, that frozen island that had more foreign depositors investing in their banks than people living in the country. Before Icelandic banks became more than 75% of the overall stock market, and Gordon Gekko became the country’s patron saint, Iceland was more known for fishing. The fishing industry accounted for about half of Iceland’s exports, and the next largest money maker may have been Bjork, the country’s famed and quirky female singer.
In looking back at the financial crisis of 2008-2009, as it turned out, Iceland served as a canary in the global debt binging coal mine. In order to attract the masses of depositors to Icelandic banks, these financial institutions offered outrageous, unsustainable interest rates to yield-starved customers. How did the Icelandic bankers offer such high rates? Well of course, it was those can’t-lose American subprime mortgages that were offering what seemed like irresistibly high yields. Of course, what seemed like a dream at the time, eventually turned into a nightmare once the scheme unraveled. Ultimately, it became crystal clear that the subprime borrowers could not pay the outrageous rates, especially after rates unknowingly reset to untenable levels for many borrowers.
At the peak of the crisis, the Icelandic banks were holding amounts of debt exceeding six times the Icelandic GDP (Gross Domestic Product) and these lenders suffered more than $100 billion in losses. One of the Icelandic banks was even funding a large condominium project in my neighboring Southern California city of Beverly Hills. When the excrement hit the fan after Lehman Brothers went bankrupt, it didn’t take long for Iceland’s stock market to collapse by more than -95%; Iceland’s Krona to crumple; and eventually the trigger of Iceland’s multi-billion bailout by numerous constituents, including the IMF (International Monetary Fund).
Bitter Medicine First, Improvement Next
Today, four years after the subprime implosion and Lehman debacle, the hedge fund on ice known as Iceland is beginning to thaw, and their economic picture is looking much brighter (see charts below). GDP growth is the highest it has been in four years (4.5% recently); the stock market has catapulted upwards (almost doubling from the lows); and the Iceland unemployment rate has declined from over 9% a few years ago to about 7% today.

Source: Trading Economics

Source: Trading Economics
Re-jiggering a phony economy with a faulty facade cannot be repaired overnight. However, now that the banking system has been allowed to clear out its excesses, Iceland can move forward. One tailwind behind the economy has been Iceland’s weaker currency, which has led to a +17% increase in foreign tourist nights at Icelandic hotels through April this year. What’s more, tourist traffic at Iceland’s airport hit a record in May. Iceland has taken its bitter medicine, adjusted, and is currently reaping some of the rewards.
Although the detrimental effects of austerity experienced by the economies and banks of Greece, Spain, and Italy crowd out most of today’s headlines, Iceland is not the only country to make painful changes to its fiscal ways and then taste the sweetness of progress. Let’s not forget the Guinness drinking Irish. Ireland, like Greece, Portugal, and Spain received a bailout, but Ireland’s banking system was arguably worse off than Spain’s, yet Ireland has seen its borrowing costs on its 10-year bond decrease dramatically from 9.2% at the beginning of 2011 to about 7.4% this month (still high, but moving in the right direction). The same can be said for the United States. Our banks were up against the ropes, but after some recapitalization, tighter oversight, and stricter lending standards, our banks have gotten back on track and have helped assist our economy grow for 11 consecutive quarters (albeit at uninspiring growth rates).
The austerity versus growth debate will no doubt continue to circulate through media circles. In my view, these arguments are too simplistic and one dimensional. Every country has its unique culture and distinct challenges, but even countries with massive financial excesses can steer themselves back to a path of growth. A floating hedge fund on ice to the north of us has proven that fact to us, as we witness brighter days beginning to thaw Iceland’s chilly economy to expansion again.
Wade W. Slome, CFA, CFP®
Plan. Invest. Prosper.
DISCLOSURE: Sidoxia Capital Management (SCM) and some of its clients own certain exchange traded funds, but at the time of publishing SCM had no direct position in Lehman Brothers, Guinness, or any other security referenced in this article. No information accessed through the Investing Caffeine (IC) website constitutes investment, financial, legal, tax or other advice nor is to be relied on in making an investment or other decision. Please read disclosure language on IC “Contact” page.
Innovative Bird Keeps All the Worms

Source: Photobucket
As the old saying goes, “The early bird gets the worm,” but in the business world this principle doesn’t always apply. In many cases, the early bird ends up opening a can of worms while the innovative, patient bird is left with all the spoils. This concept has come to light with the recent announcement that social networking site MySpace is being sold for a pittance by News Corp. (NWS) to Specific Media Inc., an advertising network company. Although Myspace may have beat Facebook to the punch in establishing a social network footprint, Facebook steamrolled Myspace into irrelevance with a broader more novel approach. Rather than hitting a home run and converting a sleepy media company into something hip, Rupert Murdoch, CEO of News Corp. struck out and received crumbs for the Myspace sale (News Corp. sold it for $35 million after purchasing for $540 million in 2005, a -94% loss).
Other examples of “winner takes all” economics include:
Kindle vs. Book Stores: Why are Borders and Waldenbooks (BGPIQ.PK) bankrupt, and why is Barnes and Noble Inc. (BKS) hemorrhaging in losses? One explanation may be people are reading fewer books and reading more blogs (like Investing Caffeine), but the more credible explanation is that Amazon.com Inc. (AMZN) built an affordable, superior digital mousetrap than traditional books. I’ll go out on a limb and say it is no accident that Amazon is the largest bookseller in the world. Within three years of Kindle’s introduction, Amazon is incredibly selling more digital books than they are selling physical hard copies of books.
iPod vs. Walkman/MP3 Players: The digital revolution has shaped our lives in so many ways, and no more so than in the music world. It’s hard to forget how unbelievably difficult it was to fast-forward or rewind to a particular song on a Sony Walkman 30 years ago (or the hassle of switching cassette sides), but within a matter of a handful of years, mass adoption of Apple Inc.’s (AAPL) iPod overwhelmed the dinosaur Walkman player. Microsoft Corp.’s (MSFT) foray into the MP3 market with Zune, along with countless other failures, have still not been able to crack Apple’s overpowering music market positioning.
Google vs. Yahoo/Microsoft Search: Google Inc. (GOOG) is another company that wasn’t the early bird when it came to dominating a new growth industry, like search engines. As a matter of fact, Yahoo! Inc (YHOO) was an earlier search engine entrant that had the chance to purchase Google before its meteoric rise to $175 billion in value. Too bad the Yahoo management team chose to walk away…oooph. Some competitive headway has been made by the likes of Microsoft’s Bing, but Google still enjoys an enviable two-thirds share of the global search market.
Dominance Not Guaranteed
Dominant market share may result in hefty short-term profits (see Apple’s cash mountain), but early success does not guarantee long-term supremacy. Or in other words, obsolescence is a tangible risk in many technology and consumer related industries. Switching costs can make market shares sticky, but a little innovation mixed with a healthy dose of differentiation can always create new market leaders.
Consider the number one position American Online (AOL) held in internet access/web portal business during the late nineties before its walled gardens came tumbling down to competition from Yahoo, Google, and an explosion of other free, advertisement sponsored content. EBay Inc. (EBAY) is another competition casualty to the fixed price business model of Amazon and other online retailers, which has resulted in six and a half years of underperformance and a -44% decline in its stock price since the 2004 peak. Despite questionable execution, and an overpriced acquisition of Skype, eBay hasn’t been left for complete death, thanks to a defensible growth business in PayPal. More recently, Research in Motion Ltd. (RIMM) and its former gargantuan army of “CrackBerry” disciples have felt the squeeze from new smart phone clashes with Apple’s iPhone and Google’s Android operating system.
With the help of technology, globalization, and the internet, never in the history of the world have multi-billion industries been created at warp speed. Being first is not a prerequisite to become an industry winner, but evolutionary innovation, and persistently differentiated products and services are what lead to expanding market shares. So while the early bird might get the worm, don’t forget the patient and innovative second mouse gets all the cheese.
Wade W. Slome, CFA, CFP®
Plan. Invest. Prosper.
DISCLOSURE: Performance data from Morningstar.com. Sidoxia Capital Management (SCM) and some of its clients own certain exchange traded funds, AAPL, AMZN, and GOOG, but at the time of publishing SCM had no direct position in BGPIQ.PK, NWS, YHOO, MSFT, SNE, AOL, EBAY, RIMM, Facebook, Skype, or any other security referenced in this article. No information accessed through the Investing Caffeine (IC) website constitutes investment, financial, legal, tax or other advice nor is to be relied on in making an investment or other decision. Please read disclosure language on IC “Contact” page.
Job Losses = Job Creation

Apple Inc. (AAPL) is considered the quintessential innovation company. After all, if you flip over an iPad or an iPhone it will clearly state, “Designed by Apple in California. Assembled in China.” Apple is just too busy innovating to worry about dirtying their hands by assembling products – they can simply outsource that work. Many people have a problem with the millions of manufacturing jobs moving offshore, but if I am the self anointed “Innovation Czar” for the United States, I definitely favor keeping the $120,000 Apple engineering jobs over the low-cost $2 per hour jobs being lost to China (or cheaper developing country). Oh sure, I would prefer keeping both workers, but if push comes to shove, I much rather keep the six-figure job. The bad news is the displaced American iPhone/iPad assembler must find an alternative lower-skilled employment opportunity. The good news is there are plenty of service-based jobs that will NOT get outsourced to the Chinese. If displaced workers are unhappy serving lattes at Starbucks or changing bedpans at the local hospital (or other unglamorous service-based job), then they can choose to retool their skills through education, in order to land higher-paying jobs not getting outsourced.

Bass Ackwards Job Assessment
While I may agree with many points made by Time Magazine’s Fareed Zakaria in his article, The Future of Innovation: Can America Keep Pace?, I think Zakaria is looking at the job trade-off a little backwards. Here is what says about Apple-created job losses in a CNN blog post:
“Apple has about $70 billion in revenues. The company that makes Apple’s products called Foxconn is in China. They have about the same revenue – $70 billion dollars. Apple employees 50,000 people. Foxconn employs 1,000,000 people. So you can have all the innovation you want and tens of thousands of engineers in California benefit, but hundreds of thousands of people benefit in China because the manufacturing has gone there. What does that mean? America needs to innovate even more to keep pace.”
Wow, that’s very altruistic of Apple to create thousands of jobs for Foxconn in Asia, but that $70 billion in Apple revenues likely generates close to 10 times the profits that Foxconn creates (Apple had 24% net profit margins last quarter versus probably a few percent at Foxconn). As Innovation Czar, I’ll gladly take the $20 billion in Apple profits added to the U.S. economy over the last 12 months versus the $2-3 billion profits at Foxconn (my estimate). Let’s be clear, profitable companies add jobs (Apple added over 12,000 employees in fiscal 2010, up +35%) – not weak or uncompetitive companies losing money.
Although the U.S. is losing low-skilled jobs to the likes of Foxconn, guess what those $120k engineering jobs at Apple are creating? Those positions are also generating lots of $12/hour service jobs. When you are paying your workers billions of dollars, like Apple, a lot of those dollars have a way of recirculating through our economy. For instance, if I am a six-figure employee at Apple, I am likely funding leisure jobs in Tahoe for family vacations; supporting jobs at Cheesecake Factory (CAKE) and Chipotle Mexican Grill (CMG) because my demanding schedule at Apple means more take-out meals; and creating jobs for auto workers at Ford (F) thanks to my new SUV purchase.
Margin Surplus Redux
The same arguments I make in the Apple vs. Foxconn comparison are very similar to the case I wrote about in Margin Surplus Retake, which compares the profit and trade deficit dynamics occurring in a $1,000 Toshiba laptop sale. Although Toshiba and its foreign component counterparts may recognize twice the revenues in a common laptop sale as American suppliers (contributing to our country’s massive trade deficit), Intel Corp. (INTC) and Microsoft Corp. (MSFT) generate six times the profits as Toshiba and company. The end result is a massive profit or margin surplus for the Americans – a better barometer to financial reality than stale government trade deficit statistics.
There are obviously no silver bullets or easy answers to resolve these ever-growing economic issues, but as political gridlock grinds innovation to a halt, globalization is accelerating. The rest of the world is racing to narrow the gap of our innovative supremacy, but our sense of entitlement will get us nowhere. Zakaria points out that by 2013, China is expected to overtake the U.S. as the leading scientific research publisher and after we held a three-fold increase in advanced engineering and technology masters degrees in 1995, China surpassed us in 2005 (63,514 in China vs. 53,349 in the U.S.). China may not be home to Facebook or Google Inc. (GOOG), but Baidu Inc. (BIDU) is headquartered in China with a market capitalization of $43 billion and Tencent Holdings is valued at more than $50 billion (not to mention Tencent has roughly the same number of users as Facebook – more than 600 million).
The jobless recovery has been painful for the 14 million unemployed, but there is hope for all, if innovation and education (see Keys to Success) can create more six-figure Apple jobs to offset less valuable jobs lost to outsourcing. In order to narrow the chasm between rich and poor in our country, Americans need to climb the labor ladder of innovation. Contrary to Fareed Zakaria’s assertion, swapping quality job gains with crappy job losses, is an economic trade I would make every day and twice on Sunday. If the country wants to return to the path of economic greatness and sustainable job creation, the country needs to embrace this idea of outsourced creative destruction.
Wade W. Slome, CFA, CFP®
Plan. Invest. Prosper.
DISCLOSURE: Performance data from Morningstar.com. Sidoxia Capital Management (SCM) and some of its clients own certain exchange traded funds, AAPL, and GOOG, but at the time of publishing SCM had no direct position in Foxconn, Facebook, MSFT, INTC, CAKE, CMG, F, BIDU, Tencent, Toshiba, or any other security referenced in this article. No information accessed through the Investing Caffeine (IC) website constitutes investment, financial, legal, tax or other advice nor is to be relied on in making an investment or other decision. Please read disclosure language on IC “Contact” page.
Eggs or Oatmeal: Binging on Over-Analysis
I about chuckled my way out of my chair when ESPN reminded me of the absurd over-analysis that takes place in the sports world (I can’t wait for the 8 hour pre-game show before the upcoming Super Bowl) through a 30-second, football commercial. Typically when sports analysts get together, the most irrelevant issues are scrutinized under a microscope. After endless wasted amounts of time, the viewer is generally left with lots of worthless information about an immaterial topic. In this particular video, San Diego NFL quarterback Phillip Rivers innocently asks Sunday Countdown football analysts Chris Berman, Mike Ditka, Keyshawn Johnson, Tom Jackson, and Cris Carter whether they would like some eggs or oatmeal for breakfast?
Mayhem ensues while the analysts breakdown everything from the pros of frittatas and brats to the cons of cholesterol and sauerkraut. After listening to all the jaw flapping, Phillip Rivers is left dejected, banging his head against the kitchen refrigerator. It is funny, I feel much the same way as Phillip Rivers does when I’m presented with same overkill analysis found plastered over the financial media and blogosphere.
Analysis of Over-Analysis
Just as I mock the excess analysis occurring in the financial world, I will move ahead and assess this same over-thinking (that’s what we bloggers do). If this much analysis takes place when examining simple options such as eggs vs. oatmeal, or AFC vs. NFC, just imagine the endless debate that arises when discussing the merits of investing in a simple, diversified domestic equity mutual fund. Sounds simple on paper, but if I want to be intellectually honest, I first need to compare this one fund versus the thousands of other equity fund offerings, not to mention the thousands of other ETFs (Exchange Traded Funds), bond funds, lifecycle funds, annuities, index funds, private equity funds, hedge funds, and other basket-related investment vehicles.
Mutual funds are only part of the investment game. We haven’t even scratched the surface of individual securities, futures, options, currencies, CDs, real estate, mortgage backed securities, or other derivatives.
The investment menu is virtually endless (see TMI – Too Much Information), and new options are created every day – many of which are indecipherable to large swaths of investors (including professionals).
Sidoxia’s Questions of Engagement
Not all analysis is psychobabble, but separating the wheat from the manure can be difficult. Before engaging in the never-ending over-analysis taking place in the financial world, answer these three questions:
1.) “Do I Care?” If the latest advance-decline statistics on the NYSE don’t tickle your fancy, or the latest “breaking news” headline on monthly pending home sales doesn’t float your boat, then maybe it’s time to do something more important like…absolutely anything else.
2.) “Do I Understand?” If conversation drifts towards complex currency swaptions comparing the Thai Baht against the Brazilian Real, then perhaps it’s time to leave the room.
3.) “Is This New News?” Not sure if you heard, but there’s this new shiny metal called gold, and it’s the cure-all for inflation, deflation, and any-flation (hyperbole for those not able to translate my written word sarcasm). The point being, ask yourself if the information you receive is valuable and actionable. Typically the best investment ideas are not discussed 24/7 over every media venue, but rather in the boring footnotes of an unread annual report.
Investing in the Stock Market
For individual securities it’s best to stick to your circle of competence with companies and industries you understand – masters like Peter Lynch and Warren Buffett appreciate this philosophy. Once you find an investment opportunity you understand, you need a way of appraising the value and gauging a company’s growth trajectory. As Charlie Munger and Warren Buffett have described, “value and growth are two sides of the same coin.” Cigar-butt investing solely using value-based metrics is not enough. Even value jock Warren Buffet appreciates the merit of a good business with sustainable expansion prospects. As a matter of fact, some of Buffett’s best performing stocks are considered the greatest growth stocks of all-time. If you cannot assign a price (or range), then you are merely playing the speculation game. Speculation often comes in the form of stock tips (i.e.,stock broker or Jim Cramer) and day trading (see Momentum Investing and Technical Analysis).
We live in a world of endless information, and the analysis can often become overkill. So when overwhelmed with data, do yourself a favor by asking yourself the three questions of engagement – that way you will not miss the forest for the trees. As for stocks, stick with industries and companies you understand and develop a disciplined investment process by appraising both the growth and valuation components of the investment. If making these decisions are too difficult, perhaps you should stay in the kitchen and have Phillip Rivers whip you up some scrambled eggs or serve you a bowl of oatmeal.
Wade W. Slome, CFA, CFP®
Plan. Invest. Prosper.
DISCLOSURE: Sidoxia Capital Management (SCM) and some of its clients own certain exchange traded funds, but at the time of publishing SCM had no direct position in DIS, BRKA/B, or any other security referenced in this article. No information accessed through the Investing Caffeine (IC) website constitutes investment, financial, legal, tax or other advice nor is to be relied on in making an investment or other decision. Please read disclosure language on IC “Contact” page.


