Posts tagged ‘gold’
Sleeping and Napping Through Bubbles

We have lived through many investment bubbles in our history, and unfortunately, most investors sleep through the early wealth-creating inflation stages. Typically, the average investor wakes up later to a hot idea once every man, woman, and child have identified the clear trend…right as the bubble is about burst. Sadly, the masses do a great job of identifying financial bubbles at the end of a cycle, but have a tougher time realizing the catastrophic consequences of exiting a tired winner. Or as strategist Jim Stack states, “Bubbles, for the most part, are invisible to those trapped inside the bubble.” The challenge of recognizing bubbles explains why they are more easily classified as bubbles after a colossal collapse occurs. For those speculators chasing a precise exit point on a bubblicious investment, they may be better served by waiting for the prick of the bubble, then take a decade long nap before revisiting the fallen angel investment idea.
Even for the minority of pundits and investors who are able to accurately identify these financial bubbles in advance, a much smaller number of these professionals are actually able to pinpoint when the bubble will burst. Take for example Alan Greenspan, the ex-Federal Reserve Chairman from 1987 to 2006. He managed to correctly identify the technology bubble in late-1996 when he delivered his infamous “irrational exuberance” speech, which questioned the high valuation of the frothy, tech-driven stock market. The only problem with Greenspan’s speech was his timing was massively off. Stated differently, Greenspan was three years premature in calling out the pricking of the bubble, as the NASDAQ index subsequently proceeded to more than triple from early 1997 to early 2000 (the index exploded from about 1,300 to over 5,000).
One of the reasons bubbles are so difficult to time during their later stages is because the deflation period occurs so quickly. As renowned value investor Howard Marks fittingly notes, “The air always goes out a lot faster than it went in.”
Bubbles, Bubbles, Everywhere
Financial bubbles do not occur every day, but thanks to the psychological forces of investor greed and fear, bubbles do occur more often than one might think. As a matter of fact, famed investor Jeremy Grantham claims to have identified 28 bubbles in various global markets since 1920. Definitions vary, but Webster’s Dictionary defines a financial bubble as the following:
A state of booming economic activity (as in a stock market) that often ends in a sudden collapse.
Although there is no numerical definition of what defines a bubble or collapse, the financial crisis of 2008 – 2009, which was fueled by a housing and real estate bubble, is the freshest example in most people minds. However, bubbles go back much further in time – here are a few memorable ones:
Dutch Tulip-Mania: Fear and greed have been ubiquitous since the dawn of mankind, and those emotions even translate over to the buying and selling of tulips. Believe it or not, some 400 years ago in the 1630s, individual Dutch tulip bulbs were selling for the same prices as homes ($61,700 on an inflation-adjusted basis). This bubble ended like all bubbles, as you can see from the chart below.

Source: The Stock Market Crash.net
British Railroad Mania: In the mid-1840s, hundreds of companies applied to build railways in Britain. Like all bubbles, speculators entered the arena, and the majority of companies went under or got gobbled up by larger railway companies.
Roaring 20s: Here in the U.S., the Roaring 1920s eventually led to the great Wall Street Crash of 1929, which finally led to a nearly -90% plunge in the Dow Jones Industrial stock index over a relatively short timeframe. Leverage and speculation were contributors to this bust, which resulted in the Great Depression.
Nifty Fifty: The so-called Nifty Fifty stocks were a concentrated set of glamor stocks or “Blue Chips” that investors and traders piled into. The group of stocks included household names like Avon (AVP), McDonald’s (MCD), Polaroid, Xerox (XRX), IBM and Disney (DIS). At the time, the Nifty Fifty were considered “one-decision” stocks that investors could buy and hold forever. Regrettably, numerous of these hefty priced stocks (many above a 50 P/E) came crashing down about 90% during the 1973-74 period.
Japan’s Nikkei: The Japanese Nikkei 225 index traded at an eye popping Price-Earnings (P/E) ratio of about 60x right before the eventual collapse. The value of the Nikkei index increased over 450% in the eight years leading up to the peak in 1989 (from 6,850 in October 1982 to a peak of 38,957 in December 1989).

Source: Thechartstore.com
The Tech Bubble: We all know how the technology bubble of the late 1990s ended, and it wasn’t pretty. PE ratios above 100 for tech stocks was the norm (see table below), as compared to an overall PE of the S&P 500 index today of about 14x.

Source: Wall Street Journal – March 14, 2000
The Next Bubble
What is/are the next investment bubble(s)? Nobody knows for sure, but readers of Investing Caffeine know that long-term bonds are one fertile area. Given the generational low in yields and rates, and the 35-year bull run in bond prices, it can be difficult to justify heavy allocations of inflation losing bonds for long time-horizon investors. Commercial real estate and Silicon Valley unicorns could be other potential over-heated areas. However, as we discussed earlier, identifying and timing bubble bursts is extremely challenging. Nevertheless, the great thing about long-term investing is that probabilities and valuations ultimately do matter, and therefore a diversified portfolio skewed away from extreme valuations and speculative sectors will pay handsome dividends over the long-run.
Many traders continue to daydream as they chase performance through speculative investment bubbles, looking to squeeze the last ounce of an easily identifiable trend. As the lead investment manager at Sidoxia Capital Management, I spend less time sucking the last puff out of a cigarette, and spend more time opportunistically devoting resources to valuation-sensitive growth trends. As demonstrated with historical examples, following the popular trend du jour eventually leads to financial ruin and nightmares. Avoiding bubbles and pursuing fairly priced growth prospects is the way to achieve investment prosperity…and provide sweet dreams.

Wade W. Slome, CFA, CFP®
Plan. Invest. Prosper.
DISCLOSURE: Sidoxia Capital Management (SCM) and some of its clients hold positions in certain exchange traded funds (ETFs), MCD, DIS and are short TLT, but at the time of publishing SCM had no direct positions in AVP, XRX, IBM,or any other security referenced in this article. No information accessed through the Investing Caffeine (IC) website constitutes investment, financial, legal, tax or other advice nor is to be relied on in making an investment or other decision. Please read disclosure language on IC Contact page.
Stocks Winning Olympic Gold

This article is an excerpt from a previously released Sidoxia Capital Management complimentary newsletter (August 1, 2016). Subscribe on the right side of the page for the complete text.
The XXXI Olympics in Rio, Brazil begin this week, but stocks in 2016 have already won a gold medal for their stellar performance. The S&P 500 index has already triumphantly sprinted to new, all-time record highs this month. A significant portion of the gains came in July (+3.6%), but if you also account for the positive results achieved in the first six months of 2016, stocks have advanced +6.3% for the year. If you judge the 2%+ annualized dividend yield, the total investment return earns an even higher score, coming closer to +8% for the year-to-date period.
No wonder the U.S. is standing on the top of the economic podium compared to some of the other international financial markets, which have sucked wind during 2016:
- China Shanghai Index: -15.8%
- Japan Nikkei Index: -12.9%
- French Paris CAC Index: -4.3%
- German Dax Index: -3.8%
- Europe MSCI Index: -3.5%
- Hong Kong Heng Sang Index: -0.1%
While there are some other down-and-out financial markets that have rebounded significantly this year (e.g., Brazil +61% & Russia +23%), the performance of the U.S. stock market has been impressive in light of all the fear, uncertainty, and doubt blanketing the media airwaves. Consider the fact that the record-breaking performance of the U.S. stock market in July occurred in the face of these scary headlines:
- Brexit referendum (British exit from the European Union)
- Declining oil prices
- Declining global interest rates
- More than -$11,000,000,000,000.00 (yes trillions) in negative interest rate bonds
- Global terrorist attacks
- Coup attempt in Turkey
- And oh yeah, a contentious domestic presidential election
With so many competitors struggling, and the investment conditions so challenging, then how has the U.S. prospered with a gold medal performance in this cutthroat environment? For many individuals, the answer can be confusing. However, for Sidoxia’s followers and clients, the strong pillars for a continued bull market have been evident for some time (described again below).
Bull Market Pillars
Surprising to some observers, stocks do not read pessimistic newspaper headlines or listen to gloomy news stories. In the short-run, stock prices can get injured by emotional news-driven traders and speculators, but over the long-run, stocks and financial markets are drawn like a magnet to several all-important metrics. What crucial metrics am I referring to? As I’ve reiterated in the past, the key drivers for future stock price appreciation are corporate profits, interest rates, valuations (i.e., price levels), and sentiment indicators (see also Don’t Be a Fool).
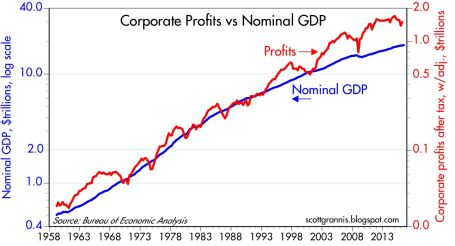
Stated more simply, money goes where it is treated best, and with many bonds and savings accounts earning negative or near 0% interest rates, investors are going elsewhere – for example, stocks. You can see from the chart below, economy/stocks are treated best by rising corporate profits, which are at/near record high levels. With the majority of stocks beating 2nd quarter earnings expectations, this shot of adrenaline has given the stock market an added near-term boost. A stabilizing U.S. dollar, better-than-expected banking results, and firming commodity prices have all contributed to the winning results.
Price Follows Earnings…and Recessions
What history shows us is stock prices follow the direction of earnings, which helps explain why stock prices generally go down during economic recessions. Weaker demand leads to weaker profits, and weaker profits lead to weaker stock prices. Fortunately for U.S. investors, there currently are no definitive signs of imminent recession clouds. Scott Grannis, the editor of Calafia Beach Pundit, sums up the relationship between recessions and the stock market here:
“Recessions typically follow periods of excesses—soaring home prices, rising inflation, widespread optimism—rather than periods dominated by risk aversion such as we have today. Risk aversion can still be found in abundance: just look at the extremely low level of Treasury yields, and the lack of business investment despite strong corporate profits.”
Similar to the Olympics, achieving success in investing can be very challenging, but if you want to win a medal, you must first compete. If you’re not investing, you’re not competing. And if you’re not investing, you have no chance of winning a financial gold medal. Just as in the Olympics, not everyone can win, and there are many ups and downs along the way to victory. Rather than focusing on the cheers and boos of the crowd, implementing a disciplined and diversified investment strategy that accounts for your time horizon, objectives, and risk tolerance is the championship approach that will increase your probability of landing on the Olympic medal podium.
Wade W. Slome, CFA, CFP®
Plan. Invest. Prosper.
DISCLOSURE: Sidoxia Capital Management (SCM) and some of its clients hold positions in certain exchange traded funds (ETFs), but at the time of publishing had no direct position in any other security referenced in this article. No information accessed through the Investing Caffeine (IC) website constitutes investment, financial, legal, tax or other advice nor is to be relied on in making an investment or other decision. Please read disclosure language on IC Contact page.
Supply & Demand: The Key to Oil, Stocks, and Pork Bellies

Commodity prices, including oil, are “crashing” according to the pundits and fears are building that this is a precursor to another stock market collapse. Are we on an irreversible path of repeating the bloodbath carnage of the 2008-2009 Great Recession?
Fortunately for investors, markets move in cycles and the fundamental laws of supply and demand hold true in both bull and bear markets, across all financial markets. Whether we are talking about stocks, bonds, copper, gold, currencies, or pork bellies, markets persistently move like a pendulum through periods of excess supply and demand. In other words, weakness in prices create stronger demand and less supply, whereas strength in prices creates weakening demand and more supply.
Since energy makes the world go round and the vast majority of drivers are accustomed to filling up their gas tanks, the average consumer is familiar with recent negative price developments in the crude oil markets. Eighteenth-century economist Adam Smith would be proud that the laws of supply and demand have help up just as well today as they did when he wrote Wealth of Nations in 1776.
It is true that overall stagnation in global economic demand in recent years, along with the strengthening of the U.S. dollar (because of better relative growth), has contributed to downward trending oil prices. It is also true that supply factors, such as Saudi Arabia’s insistence to maintain production and the boom in U.S. oil production due to new fracking technologies (see chart below), have arguably had a larger negative impact on the more than -50% deterioration in oil prices. Fears of additional Iranian oil supply hitting the global oil markets as a result of the Iranian nuclear deal have also added to the downward pressure on prices.
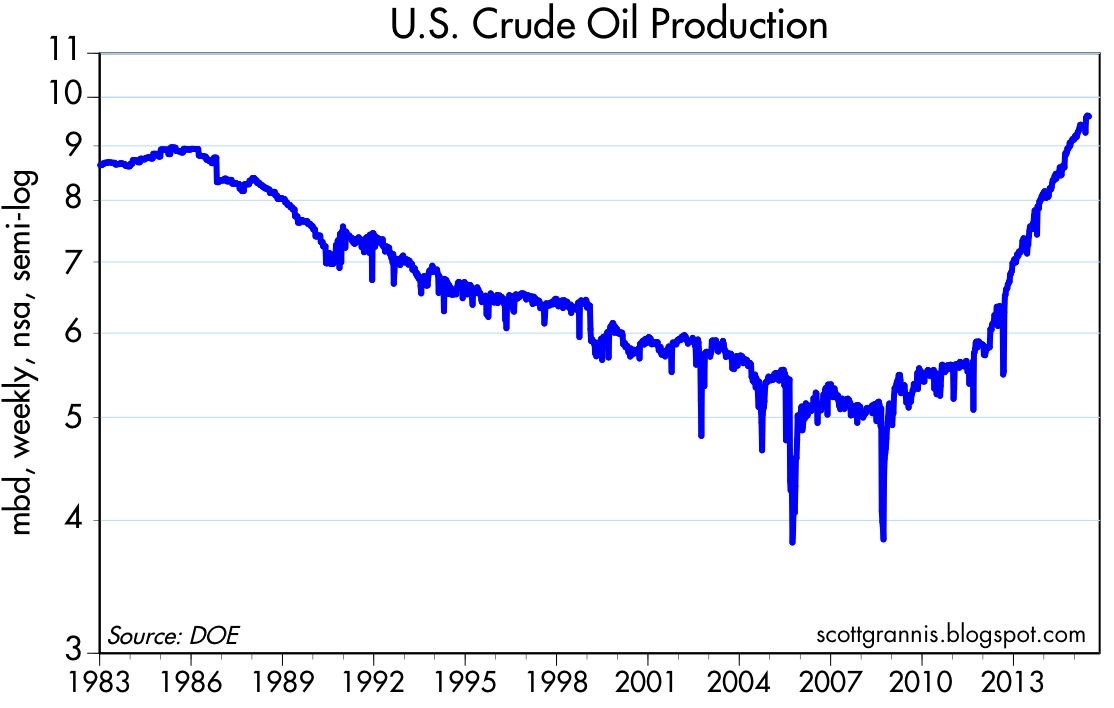
Source: Scott Grannis
What is bad for oil prices and the oil producers is good news for the rest of the economy. Transportation is the lubricant of the global economy, and therefore lower oil prices will act as a stimulant for large swaths of the global marketplace. Here in the U.S., consumer savings from lower energy prices have largely been used to pay down debt (deleverage), but eventually, the longer oil prices remain depressed, incremental savings should filter into our economy through increased consumer spending.
But prices are likely not going to stay low forever because producers are responding drastically to the price declines. All one needs to do is look at the radical falloff in the oil producer rig count (see chart below). As you can see, the rig count has fallen by more than -50% within a six month period, meaning at some point, the decline in global production will eventually provide a floor to prices and ultimately provide a tailwind.
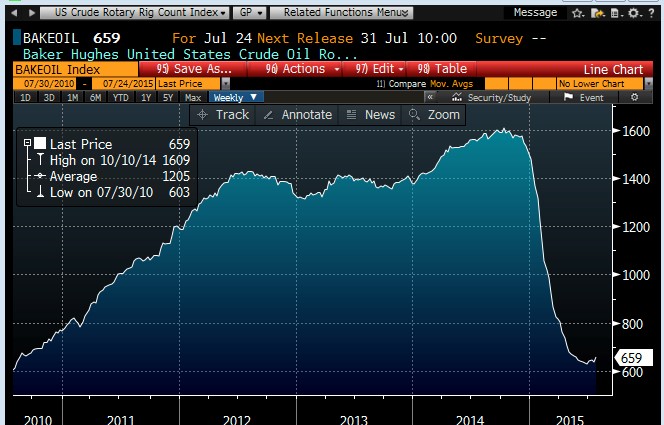
Source: Scott Grannis
If we broaden our perspective beyond just oil, and look at the broader commodity complex, we can see that the recent decline in commodity prices has been painful, but nowhere near the Armageddon scenario experienced during 2008-2009 (see chart below – gray areas = recessions).
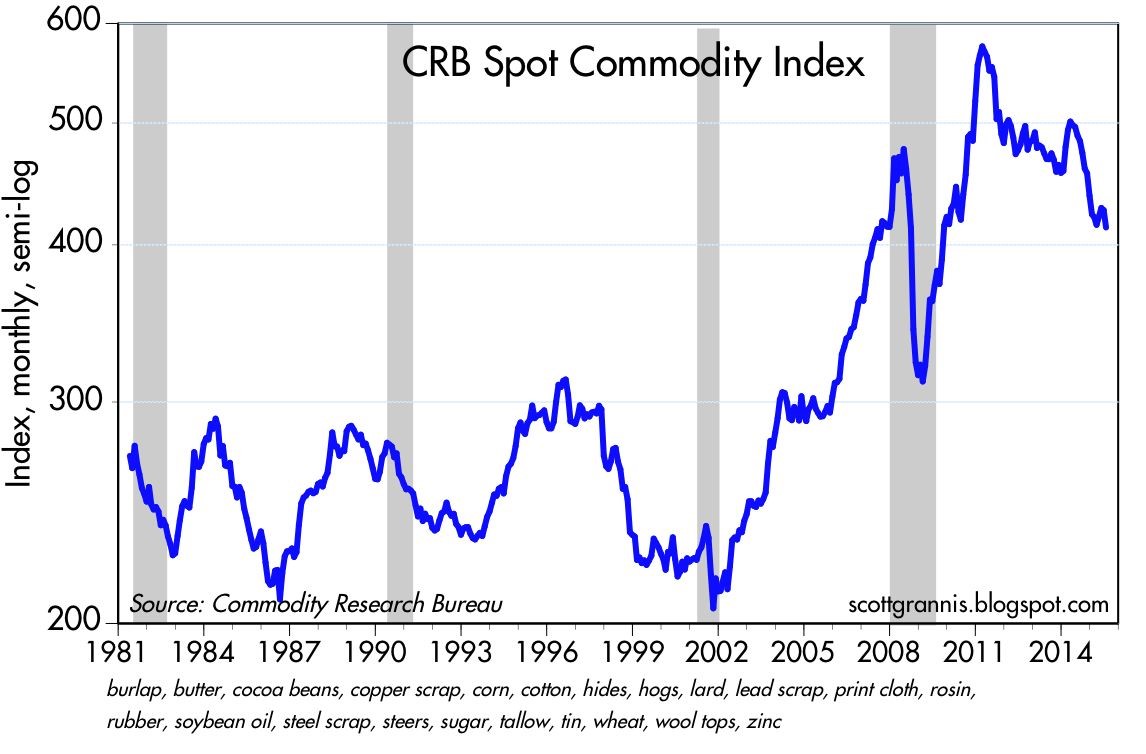
Source: Scott Grannis
Although this conversation has focused on commodities, the same supply-demand principles apply to the stock market as well. Stock market prices as measured by the S&P 500 index have remained near record levels, but as I have written in the past, the records cannot be attributed to the lackluster demand from retail investors (see ICI fund flow data).
Although U.S. stock fundamentals remain relatively strong (e.g., earnings, interest rates, valuations, psychology), much of the strength can be explained by the constrained supply of stocks. How has stock supply been constrained? Some key factors include the trillions in dollars of supply soaked up by record M&A activity (mergers and acquisition) and share buybacks.
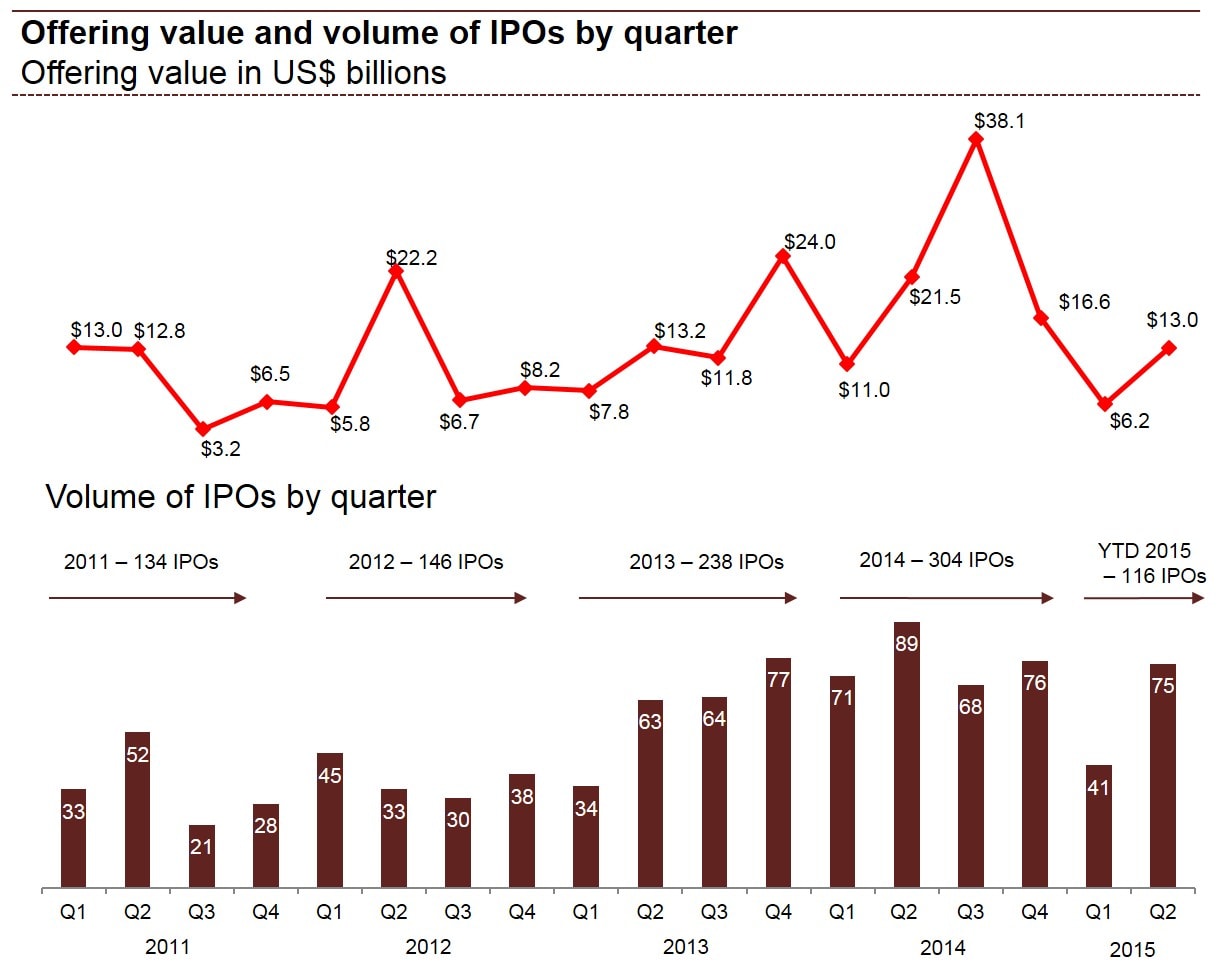
In addition to the declining stock supply from M&A and share buybacks, there has been limited supply of new IPO issues (initial public offerings) coming to market, as evidenced by the declines in IPO dollar and unit volumes in the first half of 2015, as compared to last year. More specifically, first half IPO dollar volmes were down -41% to $19.2 billion and the number of 2015 IPOs has declined -27% to 116 from 160 for the same time period.
Price cycles vary dramatically in price and duration across all financial markets, including stocks, bonds, oil, interest rates, currencies, gold, and pork bellies, among others. Not even the smartest individual or most powerful computer on the planet can consistently time the short-term shifts in financial markets, but using the powerful economic laws of supply and demand can help you profitably make adjustments to your investment portfolio(s).

See Also – The Lesson of a Lifetime (Investing Caffeine)
Wade W. Slome, CFA, CFP®
Plan. Invest. Prosper.
DISCLOSURE: Sidoxia Capital Management (SCM) and some of its clients hold positions in certain exchange traded funds (ETFs), but at the time of publishing, SCM had no direct position in any other security referenced in this article. No information accessed through the Investing Caffeine (IC) website constitutes investment, financial, legal, tax or other advice nor is to be relied on in making an investment or other decision. Please read disclosure language on IC Contact page.
The Thrill of the Chase

Men (and arguably women to a lesser extent) enjoy the process of hunting for a mate. Chasing the seemingly unattainable event aligns with man’s innate competitive nature. But the quest for the inaccessible is not solely limited to dating. When it comes to other aspirational categories, humans also want what they cannot have because they revel in a challenge. Whether it’s a desirable job, car, romantic partner, or even an investment, people bask in the pursuit.
For many investment daters and trading speculators, 2008-2009 was a period of massive rejection. Rather than embracing the losses as a new opportunity, many wallowed in cash, CDs, bonds, and/or gold. This strategy felt OK until the massive 5-year bull market went on a persistent, upward tear beginning in 2009. Now, as the relentless bull market has continued to set new all-time record highs, the negative sentiment cycle has slowly shifted in the other direction. Back in 2009, many investors regretted owning stocks and as a result locked in losses by selling at depressed prices. Now, the regret of owning stocks has shifted to remorse for not owning stocks. Missing a +23% annual return for five years, while getting stuck with a paltry 0.25% return in a savings account or 3-4% annual return achieved in bonds, can harm the psyche and make savers bitter.
Greed hasn’t fully set in like we witnessed in the late period of the 1990s tech boom, but nevertheless, some of the previous overly cautious “sideliners” feel compelled to now get into the stock game (see Get Out of Stocks!*) or increase their equity allocation. Like a desperate, testosterone-amped teen chasing a prom date, some speculators are chasing stocks, regardless of the price paid. As I’ve noted before, the overall valuation of the stock market seems quite reasonable (see PE ratio chart in Risk Aversion Declining – S. Grannis), despite selective pockets of froth popping up in areas like biotech stocks, internet companies, and junk bonds.
Even if chasing is a bad general investment practice, in the short-run, chasing stocks (or increasing equity allocations) may work because overall prices of stocks remain about half the price they were at the 2000 bubble peak (see Siegel Bubblicious article). How can stocks be -50% off when stock prices today (S&P 500) are more than +25% higher today than the peak in 2000? Plain and simply, it’s the record earnings (see It’s the Earnings Stupid). In the latest Sidoxia newsletter we highlighted the all-time record corporate profits, which are conveniently excluded from most stock market discussions in the blogosphere and other media outlets.
The Investor’s Emotional Roller Coaster (Perceived Risk vs Actual Risk)
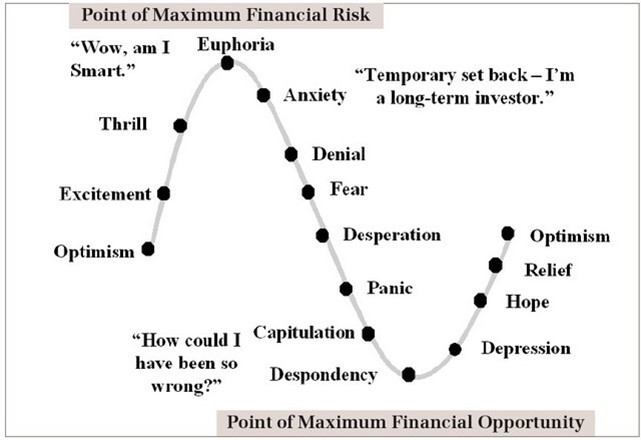
The “Thrill of the Chase” is but a single emotion on the roller coaster sentiment spectrum (see Barry Ritholtz chart in Sentiment Cycle of Fear and Greed). The problem with the above chart is many investors confuse actual risk from perceived risk. Many investors perceive the “euphoric” stage of an economic cycle (top of the chart) as low-risk, when in actuality this point reflects peak risk. One can look back to the late 1990s and early 2000 when technology shares were priced at more than 100x years in earnings and every hairdresser, cabdriver and relative were plunging their life savings into stocks. The good news from my vantage point is we are a ways from that euphoric state (asset fund flows and consumer confidence are but a few data points to support this assertion).
The key to reversing the sentiment roller coaster is to follow the thought process of investment greats who learned to avoid euphoria in up markets:
“I’m always more depressed by an overpriced market in which many stocks are hitting new highs every day than by a beaten-down market in a recession.” -Peter Lynch
“Be fearful when others are greedy, and be greedy when others are fearful.” –Warren Buffett
While the “Thrill of the Chase” can seem exciting and a rational strategy at the time, successful long-term investors are better served by remaining objective, unemotional, and numbers-driven. If you don’t have the time, interest, or emotional fortitude to be disciplined, then find an experienced investment manager or advisor to assist you. That will make your emotional roller coaster ride even more thrilling.
Wade W. Slome, CFA, CFP®
Plan. Invest. Prosper.
DISCLOSURE: Sidoxia Capital Management (SCM) and some of its clients hold long positions in certain exchange traded funds, but at the time of publishing SCM had no direct position in any other security referenced in this article. No information accessed through the Investing Caffeine (IC) website constitutes investment, financial, legal, tax or other advice nor is to be relied on in making an investment or other decision. Please read disclosure language on IC Contact page.
Get Out of Stocks!*

Get out of stocks!* Why the asterisk mark (*)? The short answer is there is a certain population of people who are looking at alluring record equity prices, but are better off not touching stocks – I like to call these individuals the “sideliners”. The sideliners are a group of investors who may have owned stocks during the 2006-2008 timeframe, but due to the subsequent recession, capitulated out of stocks into gold, cash, and/or bonds.
The risk for the sideliners getting back into stocks now is straightforward. Sideliners have a history of being too emotional (see Controlling the Investment Lizard Brain), which leads to disastrous financial decisions. So, even if stocks outperform in the coming months and years, the sideliners will most likely be slow in getting back in, and wrongfully knee-jerk sell at the hint of an accelerated taper, rate-hike, or geopolitical sneeze. Rather than chase a stock market at all-time record highs, the sideliners would be better served by clipping coupons, saving, and/or finish that bunker digging project.
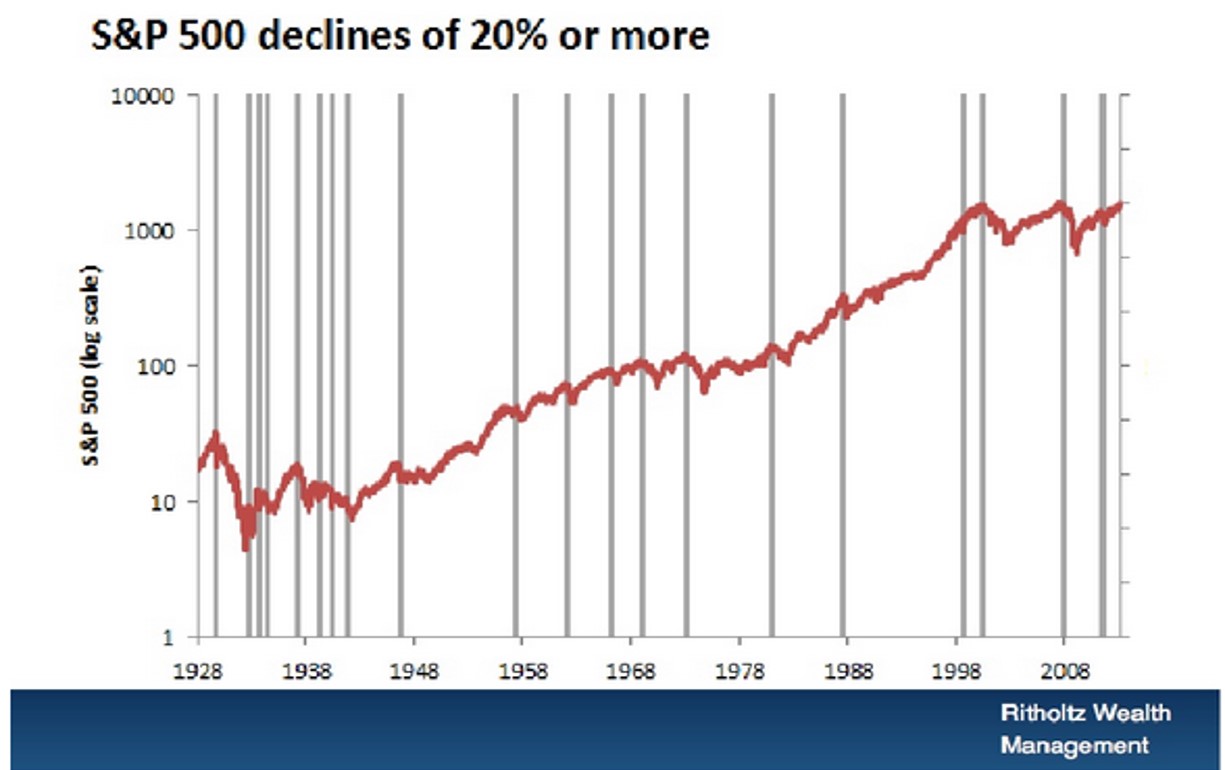
The fact is, if you can’t stomach a -20% decline in the stock market, you shouldn’t be investing in stocks. In a recent presentation, Barry Ritholtz, editor of The Big Picture and CIO of Ritholtz Wealth Management, beautifully displayed the 20 times over the last 85 years that the stocks have declined -20% or more (see chart below). This equates to a large decline every four or so years.
Strategist Dr. Ed Yardeni hammers home a similar point over a shorter duration (2008-2014) by also highlighting the inherent volatility of stocks (see chart below).
Stated differently, if you can’t handle the heat in the stock kitchen, it’s probably best to keep out.
It’s a Balancing Act
For the rest of us, the vast majority of investors, the question should not be whether to get out of stocks, it should revolve around what percentage of your portfolio allocation should remain in stocks. Despite record low yields and record high bond prices (see Bubblicious Bonds and Weak Competition, it is perfectly rational for a Baby-Boomer or retiree to periodically ring their stock-profit cash register, and reallocate more dollars toward bonds. Even if you forget about the 30%+ stock return achieved last year and the ~6% return this year, becoming more conservative in (or near) retirement with a larger bond allocation still makes sense. For some of our clients, buying and holding individual bonds until maturity reduces the risky outcome associated with a potential of interest rates spiking.
With all of that said, our current stance at Sidoxia doesn’t mean stocks don’t offer good value today (see Buy in May). For those readers who have followed Investing Caffeine for a while, they will understand I have been relatively sanguine about the prospects of equities for some time, even through a host of scary periods. Whether it was my attack of bears Peter Schiff, Nouriel Roubini, or John Mauldin in 2009-2010, or optimistic articles written during the summer crash of 2011 when the S&P 500 index declined -22% (see Stocks Get No Respect or Rubber Band Stretching), our positioning did not waver. However, as stock values have virtually tripled in value from the 2009 lows, more recently I have consistently stated the game has gotten a lot tougher with the low-hanging fruit having already been picked (earnings have recovered from the recession and P/E multiples have expanded). In other words, the trajectory of the last five years is unsustainable.
Fortunately for us, at Sidoxia we’re not hostage to the upward or downward direction of a narrow universe of large cap U.S. domestic stock market indices. We can scour the globe across geographies and capital structure. What does that mean? That means we are investing client assets (and my personal assets) into innovative companies covering various growth themes (robotics, alternative energy, mobile devices, nanotechnology, oil sands, electric cars, medical devices, e-commerce, 3-D printing, smart grid, obesity, globalization, and others) along with various other asset classes and capital structures, including real estate, MLPs, municipal bonds, commodities, emerging markets, high-yield, preferred securities, convertible bonds, private equity, floating rate bonds, and TIPs as well. Therefore, if various markets are imploding, we have the nimble ability to mitigate or avoid that volatility by identifying appropriate individual companies and alternative asset classes.
Irrespective of my shaky short-term forecasting abilities, I am confident people will continue to ask me my opinion about the direction of the stock market. My best advice remains to get out of stocks*…for the “sideliners”. However, the asterisk still signifies there are plenty of opportunities for attractive returns to be had for the rest of us investors, as long as you can stomach the inevitable volatility.
Wade W. Slome, CFA, CFP®
Plan. Invest. Prosper.
DISCLOSURE: Sidoxia Capital Management (SCM) and some of its clients hold long positions in certain exchange traded funds, but at the time of publishing SCM had no direct position in any other security referenced in this article. No information accessed through the Investing Caffeine (IC) website constitutes investment, financial, legal, tax or other advice nor is to be relied on in making an investment or other decision. Please read disclosure language on IC Contact page.
The Ski Slope Market: What’s Next in 2014?

This article is an excerpt from a previously released Sidoxia Capital Management complementary newsletter (January 2, 2014). Subscribe on the right side of the page for the complete text.
Skiing, or snowboarding in my case, is a lot like investing in the stock market…a bumpy ride. Snow, wind, ice, and moguls are common for seasoned skiers, and interest rate fluctuations, commodity price spikes, geopolitical turmoil, and -10% corrections are ordinary occurrences for veteran equity investors. However, in 2013 stock investors enjoyed pristine conditions, resulting in the best year for the Dow Jones Industrial Average since 1996. Individuals owning stocks witnessed their portfolios smoothly race to sunny, powder-like returns. More specifically, a December Santa Claus rally (S&P +2.4% for the month) capped off a spectacular year, which resulted in the S&P 500 Index soaring +30%, the NASDAQ Composite Index +38%, and the Dow +26%.
Despite the meteoric move in stocks this year, many observers missed the excitement of the equity ski slopes in exchange for lounging in the comfort of the deceivingly risky but warm lodge. In the lodge, these stock-frightened individuals sipped hot cocoa with wads of inflation-losing cash, bonds, and gold. As a result, these perceived safe assets have now become symbolic relics of the 2008-2009 financial crisis. In the short-run, the risk-averse coziness of the lodge may feel wonderful, but before the lounging observers can say “bull market,” the overpriced cocoas and holiday drinks will eat holes through retirement wallets and purses.
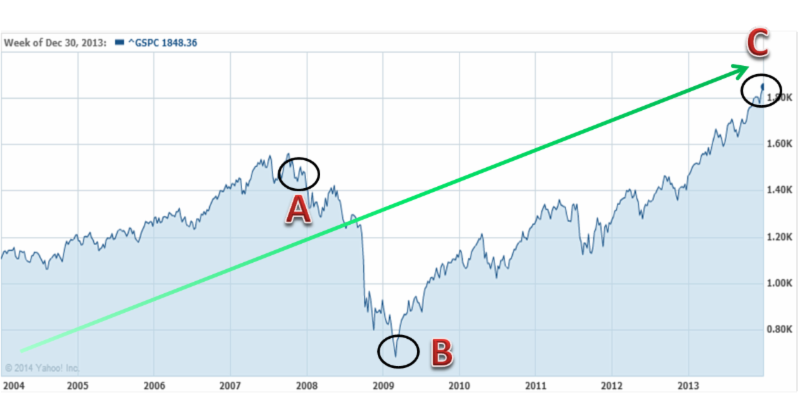
As you can see from the chart below, it is easy for the nervous lodge loungers to vividly remember the scary collapse of 2008-09 (point A to B). Surprisingly, many of these same skeptics are able to ignore or discount the explosive move of 2009-13 (point B to C). There’s another way of looking at this volatile time period. Had an investor fallen into a coma six years ago and then awakened today, an S&P portfolio would still have risen a respectable +26% (point A to C), plus more than +10% or so from dividends.
Turbulent Times on Back-Country Bond & Gold Trails
While stockholders have thoroughly enjoyed the recent climate, the 2013 weather conditions haven’t been as ideal for gold and bond investors. Gold investors felt less-than-precious in 2013 as they went flying off a cliff and broke a leg. In fact, the shiny metal suffered its worst performance in 30 years and underperformed stocks by a whopping -58%. With this year’s -28% loss (GLD), gold has underperformed stocks over the last six years, after including the impact of dividends.
Like gold traders, most bondholders were wounded in 2013 as well, but they did not get completely buried in an avalanche. Nevertheless, 2013 was a rocky ride overall for the bond haven hunters, as evidenced by the iShares Barclays Aggregate Bond composite (AGG), which fell -4%. As I’ve discussed previously, in Confessions of a Bond Hater, not all bonds are created equally, and actually many Sidoxia client portfolios include shorter-duration bonds, inflation protection bonds, convertible bonds, floating rate bonds, and high-yield bonds. Structured correctly, a thoughtfully constructed bond portfolio can outperform in a rising rate environment like we experienced in 2013.
Although bonds as a broad category may not currently offer great risk-reward characteristics, individuals in the mid-to-latter part of retirement need less volatility and more income – attributes bonds (not stocks) can offer. In other words, certain people are better served by snow-shoeing, or going on sleigh rides rather than risking a wipeout or tree collision on a downhill ski adventure. By owning the right types of bonds, your portfolio can avoid a severe investment crash.
Positive 2014 Outlook but Helmet Advised
With the NASDAQ index having more than tripled to over 4,176 from the 2009 lows, napping spectators are beginning to wake up and take notice. After money hemorrhaged out of the stock market for years (despite positive total returns in 2009, 2010, 2011, 2012), the fear trend began to reverse itself in 2013 and investment capital began returning to stock funds (see Here Comes the Dumb Money).
Adding fuel to the bull market fire, the International Monetary Fund (IMF) head Christine Lagarde recently signaled an increase in economic growth forecasts for the U.S. in 2014, thanks to an improving employment picture, successful Congressional budget negotiations, and actions by the Federal Reserve to unwind unprecedented monetary stimulus. If you consider the added factors of rising corporate profits, improving CEO confidence (e.g., Ford expansion), the shale energy boom, an expanding housing market, and our technology leadership position, one can paint a reasonably optimistic picture for the upcoming years.
Nonetheless, I am quick to remind investors and clients that the pace of the +30% appreciation in 2013 is unsustainable, and we are still overdue for a -10% correction in the major stock indexes.
The fundamental outlook for the economy may be improving, but there are still plenty of clouds on the horizon that could create a short-term market snowstorm. Domestically, we have the upcoming 2014 mid-term elections; debt ceiling negotiations; and a likely continuation of the Federal Reserve tapering program. Abroad, there are Iranian nuclear program talks; instability in Syria; meager and uncertain growth in Europe; and volatile economic climates in emerging markets like China, Brazil and India. After such a large advance this year, any one of these concerns (or some other unforeseen event) could provide an ample excuse to sell stocks and take some profits.
Since wipeouts are common, a protective helmet in the form of a valuation-oriented, globally diversified portfolio is strongly advised. For seasoned skiers and long-term investors, experiencing the never-ending ups and downs of skiing (investing) is a necessity to reach a desired destination. If you have trouble controlling your skis (money/emotions), it’s wise to seek the assistance of an experienced instructor (investment advisor) so your investment portfolio doesn’t crash.
Wade W. Slome, CFA, CFP®
Plan. Invest. Prosper.
DISCLOSURE: Sidoxia Capital Management (SCM) and some of its clients hold positions in certain exchange traded funds (ETFs), but at the time of publishing SCM had no direct position in AGG, GLD, F, or any other security referenced in this article. No information accessed through the Investing Caffeine (IC) website constitutes investment, financial, legal, tax or other advice nor is to be relied on in making an investment or other decision. Please read disclosure language on IC Contact page.
Sleeping Through Bubbles and Decade Long Naps
We have lived through many investment bubbles in our history, and unfortunately most investors sleep through the early wealth-creating inflation stages. Typically, the average investor wakes up later to a hot idea once every man, woman, and child has identified the clear trend…right as the bubble is about burst. Sadly, the masses do a great job of identifying financial bubbles at the end of a cycle, but have a tougher time realizing the catastrophic consequences of exiting a tired winner. Or as strategist Jim Stack states, “Bubbles, for the most part, are invisible to those trapped inside the bubble.” The challenge of recognizing bubbles explains why they are more easily classified as bubbles after a colossal collapse occurs. For those speculators chasing a precise exit point on a bubblicious investment, they may be better served by waiting for the prick of the bubble, then take a decade long nap before revisiting the fallen angel investment idea.
Even for the minority of pundits and investors who are able to accurately identify these financial bubbles in advance, a much smaller number of these professionals are actually able to pinpoint when the bubble will burst. Take for example Alan Greenspan, the ex-Federal Reserve Chairman from 1987 to 2006. He managed to correctly identify the technology bubble in late-1996 when he delivered his infamous “irrational exuberance” speech, which questioned the high valuation of the frothy, tech-driven stock market. The only problem with Greenspan’s speech was his timing was massively off. Stated differently, Greenspan was three years premature in calling out the pricking of the bubble, as the NASDAQ index subsequently proceeded to more than triple from early 1997 to early 2000 (the index exploded from about 1,300 to over 5,000).
One of the reasons bubbles are so difficult to time during their later stages is because the deflation period occurs so quickly. As renowned value investor Howard Marks fittingly notes, “The air always goes out a lot faster than it went in.”
Bubbles, Bubbles, Everywhere
Financial bubbles do not occur every day, but thanks to the psychological forces of investor greed and fear, bubbles do occur more often than one might think. As a matter of fact, famed investor Jeremy Grantham claims to have identified 28 bubbles in various global markets since 1920. Definitions vary, but Webster’s Dictionary defines a financial bubble as the following:
A state of booming economic activity (as in a stock market) that often ends in a sudden collapse.
Although there is no numerical definition of what defines a bubble or collapse, the financial crisis of 2008 – 2009, which was fueled by a housing and real estate bubble, is the freshest example in most people minds. However, bubbles go back much further in time – here are a few memorable ones:
Dutch Tulip-Mania: Fear and greed have been ubiquitous since the dawn of mankind, and those emotions even translate over to the buying and selling of tulips. Believe it or not, some 400 years ago in the 1630s, individual Dutch tulip bulbs were selling for the same prices as homes ($61,700 on an inflation adjusted basis). This bubble ended like all bubbles, as you can see from the chart below.
Source: The Stock Market Crash.net
British Railroad Mania: In the mid-1840s, hundreds of companies applied to build railways in Britain. Like all bubbles, speculators entered the arena, and the majority of companies went under or got gobbled up by larger railway companies.
Roaring 20s: Here in the U.S., the Roaring 1920s eventually led to the great Wall Street Crash of 1929, which finally led to a nearly -90% plunge in the Dow Jones Industrial stock index over a relatively short timeframe. Leverage and speculation were contributors to this bust, which resulted in the Great Depression.
Nifty Fifty: The so-called Nifty Fifty stocks were a concentrated set of glamour stocks or “Blue Chips” that investors and traders piled into. The group of stocks included household names like Avon (AVP), McDonald’s (MCD), Polaroid, Xerox (XRX), IBM and Disney (DIS). At the time, the Nifty Fifty were considered “one-decision” stocks that investors could buy and hold forever. Regrettably, numerous of these hefty priced stocks (many above a 50 P/E) came crashing down about 90% during the1973-74 period.
Japan’s Nikkei: The Japanese Nikkei 225 index traded at an eye popping Price-Earnings (P/E) ratio of about 60x right before the eventual collapse. The value of the Nikkei index increased over 450% in the eight years leading up to the peak in 1989 (from 6,850 in October 1982 to a peak of 38,957 in December 1989).
Source: Thechartstore.com
The Tech Bubble: We all know how the technology bubble of the late 1990s ended, and it wasn’t pretty. PE ratios above 100 for tech stocks was the norm (see table below), as compared to an overall PE of the S&P 500 index today of about 14x.
Source: Wall Street Journal – March 14, 2000
The Next Bubble
What is/are the next investment bubble(s)? Nobody knows for sure, but readers of Investing Caffeine know that long-term bonds are one fertile area. Given the generational low in yields and rates, and the near doubling of long-term Treasury prices over the last twelve years, it can be difficult to justify heavy allocations of inflation losing bonds for long time-horizon investors. Gold, another asset class that has increased massively in price (over 6-fold rise since about 2000) and attracted swaths of speculators, is another target area. However, as we discussed earlier, timing bubble bursts is extremely challenging. Nevertheless, the great thing about long-term investing is that probabilities and valuations ultimately do matter, and therefore a diversified portfolio skewed away from extreme valuations and speculative sectors will pay handsome dividends over the long-run.
Many traders continue to daydream as they chase performance through speculative investment bubbles, looking to squeeze the last ounce of an easily identifiable trend. As the lead investment manager at Sidoxia Capital Management, I spend less time sucking the last puff out of a cigarette, and spend more time opportunistically devoting resources to less popular growth trends. As demonstrated with historical examples, following the trend du jour eventually leads to financial ruin and nightmares. Avoiding bubbles and pursuing fairly priced growth prospects is the way to achieve investment prosperity…and provide sweet dreams.
Wade W. Slome, CFA, CFP®
Plan. Invest. Prosper.
DISCLOSURE: Sidoxia Capital Management (SCM) and some of its clients hold positions in certain exchange traded funds (ETFs) and are short TLT, but at the time of publishing SCM had no direct positions in AVP, MCD, XRX, IBM, DIS, or any other security referenced in this article. No information accessed through the Investing Caffeine (IC) website constitutes investment, financial, legal, tax or other advice nor is to be relied on in making an investment or other decision. Please read disclosure language on IC Contact page.
Lent: Giving Up the Gold Vice

Source: Photobucket
When it comes to Lent, most Christian denomination followers give up a vice, such as food, alcohol, or now in more modern times…Facebook (FB). Since Lent began on Ash Wednesday this year (February 22, 2012), investors have given up something else – gold (GLD). As a matter of fact, the shiny metal has declined by about -8% since Lent began. Stocks, on the other hand, as measured by the S&P 500, have outperformed gold by more than 10% over this period (the Lent period damage is even worse, if you look at the NASDAQ).
If you go back further in time, the underperformance is more extreme, once you account for dividends, which gold of course does not provide. For example, since the peak of the financial crisis panic in March of 2009, S&P 400, S&P 600, and NASDAQ stocks have outperformed gold by more than +40%. Yet, I am still waiting for the sign-spinning guy at the corner of First St. & Main St. to advertise stock trade-in opportunities. Contrarians may also get a kick out of the top investment CNBC survey too.

Source: Orlando Sentinel
Last Friday’s jobs data was nothing to write home about, so gold cheerleaders might wait for more fiat currency debasement to come in the form of QE3 (i.e., quantitative easing or printing press). But once again, while this potential added monetary stimulus may not be bad for gold, let’s not forget that stocks still outperformed gold under QE1 & QE2.
As I have always stated, I can’t disagree with the inflationary pressures that are brewing. Stimulative monetary and fiscal policies, coupled with emerging market expansion and undisciplined government spending don’t paint a pretty inflationary picture. So if that’s the case, why not focus on other commodities that provide real utility besides just shininess (e.g., agricultural goods, copper, aluminum, oil, and even silver).
The gold bugs may still have a little post-Lent party, until rates start going up and panic insurance premiums go down, but once the Fed’s easing policy stance changes (see Paul Volcker Fed Chairman era) and fiscal sanity eventually returns to Washington, investors may look to another vice to gorge on.
See also some other items to gorge on: CLICK HERE
Wade W. Slome, CFA, CFP®
Plan. Invest. Prosper.
DISCLOSURE: Sidoxia Capital Management (SCM) and some of its clients own certain exchange traded funds (including small cap ETFs, mid cap ETFs, energy ETFs, commodity ETFs) , but at the time of publishing SCM had no direct position in GLD, FB, or any other security referenced in this article. No information accessed through the Investing Caffeine (IC) website constitutes investment, financial, legal, tax or other advice nor is to be relied on in making an investment or other decision. Please read disclosure language on IC “Contact” page.
No Respect: The Rodney Dangerfield of the Investment World

Source: Photobucket
Ask any average Joe off the street what investment category is at or near record all-time highs, and a good number of them will confidently answer “gold,” as prices recently eclipsed $1,600 per ounce. But of course this makes perfect sense, right? The Fed is printing money like it’s going out of style, the dollar is collapsing like a drunken sailor, inflation is about to sky-rocket to the moon, and China is on the verge of becoming the world’s new reserve currency. Never mind that Greece, Portugal and Ireland are in shambles with the Euro on its death bed. Or Japan has achieved a debt to GDP ratio that would even make U.S. vote grubbing politicians blush. A sub-3% 10-Year Treasury Note doesn’t appear to discourage fervent gold-bugs either.
No Respect
While gold has experienced an incredible sextupling in prices over the last decade and hit new-all time highs, believe it or not, there is an unlikely asset class that is reaching new historic highs and has outperformed gold for almost 2.5 years. Can you guess what asset class star I am talking about? If I said U.S. “stocks,” would you believe me? OK, well maybe I’m not referring to large capitalization stocks like Johnson & Johnson (JNJ), Microsoft Corp. (MSFT), Wal-Mart Stores (WMT), Intel Corp. (INTC), and AT&T Inc. (T), all of which have effectively gone nowhere in the 21st Century. However, the story is quite different if you look at small and mid capitalization stocks, which have received about as much respect as Rodney Dangerfield.
As a matter of fact, the S&P 400 (MidCap Index) and S&P 600 Index (SmallCap Index) have more than doubled gold’s performance since the lows of March 2009 (SmallCap +149.0%; MidCap +145.1%; Gold/GLD +71.0%). Given the spectacular performance of small and mid-sized companies, I’m still waiting with bated breath for a telemarketer call asking me if I have considered selling my small and mid cap stock certificates for cash – since everyone has melted their gold chains and fillings, a new hobby is needed.

S&P 400 MidCap and S&P 600 SmallCap (Source: Yahoo! Finance)
What Next?
Has the fear trade ended? Perhaps not, if you consider European sovereign debt and U.S. debt ceiling concerns, but what happens if the half empty glass becomes half full. The early 1980s may be a historical benchmark period for comparison purposes. An interesting thing happened from 1980-1982 when Federal Reserve Chairman Paul Volcker began raising interest rates to fight inflation – gold prices dropped -65% (~$800/oz. to under $300/oz.) from 1980-1982 and the shiny metal lived through approximately a 25 year period with ZERO price appreciation. Since there is only one direction for the Fed’s zero interest rate policy (ZIRP) to go, conceivably history will repeat itself once again?
In hindsight gold was a beautiful safe haven vehicle during the panic-filled, nail-biting period during late-2007 throughout 2008. Since then, small and mid cap stocks have trounced gold. Like stocks, Rodney Dangerfield may have gotten no respect, but once fear has subsided and rates start increasing, maybe stocks will steal the show and get the respect they deserve.
See also Rodney Dangerfield’s perspective on Doug Kass and the Triple Lindy
Wade W. Slome, CFA, CFP®
Plan. Invest. Prosper.
DISCLOSURE: Performance data from Morningstar.com. Sidoxia Capital Management (SCM) and some of its clients own certain exchange traded funds (including small cap and mid cap ETFs), and WMT, but at the time of publishing SCM had no direct position in JNJ, MSFT, INTC, T, or any other security referenced in this article. No information accessed through the Investing Caffeine (IC) website constitutes investment, financial, legal, tax or other advice nor is to be relied on in making an investment or other decision. Please read disclosure language on IC “Contact” page.
Buffett on Gold Fondling and Elephant Hunting

Warren Buffett is kind enough to occasionally grace investors with his perspectives on a wide range of subjects. In his recently released annual letter to shareholders he covered everything from housing and leverage to liquidity and his optimistic outlook on America (read full letter here). Taking advice from the planet’s third wealthiest person (see rankings) is not a bad idea – just like getting basketball pointers from Hall of Famer Michael Jordan or football tips from Pro Bowler Tom Brady isn’t a bad idea either.
Besides being charitable with billions of his dollars, the “Oracle of Omaha” was charitable with his time, spending three hours on the CNBC set (a period equal to $12 million in Charlie Sheen dollars) answering questions, all at the expense of his usual money-making practice of reading through company annual reports and 10Qs.
Buffett’s interviews are always good for a few quotable treasures and he didn’t disappoint this time either with some “gold fondling” and “elephant hunting” quotes.
Buffett on Gold & Commodities
Buffett doesn’t hold back on his disdain for “fixed-dollar investments” and isn’t shy about his feelings for commodities when he says:
“The problem with commodities is that you are betting on what someone else would pay for them in six months. The commodity itself isn’t going to do anything for you….it is an entirely different game to buy a lump of something and hope that somebody else pays you more for that lump two years from now than it is to buy something that you expect to produce income for you over time.”
Here he equates gold demand to fear demand:
“Gold is a way of going long on fear, and it has been a pretty good way of going long on fear from time to time. But you really have to hope people become more afraid in a year or two years than they are now. And if they become more afraid you make money, if they become less afraid you lose money, but the gold itself doesn’t produce anything.”
Buffett goes on to say this about the giant gold cube:
“I will say this about gold. If you took all the gold in the world, it would roughly make a cube 67 feet on a side…Now for that same cube of gold, it would be worth at today’s market prices about $7 trillion dollars – that’s probably about a third of the value of all the stocks in the United States…For $7 trillion dollars…you could have all the farmland in the United States, you could have about seven Exxon Mobils (XOM), and you could have a trillion dollars of walking-around money…And if you offered me the choice of looking at some 67 foot cube of gold and looking at it all day, and you know me touching it and fondling it occasionally…Call me crazy, but I’ll take the farmland and the Exxon Mobils.”
Although not offered up in this particular interview, here is another classic quote by Buffett on gold:
“[Gold] gets dug out of the ground in Africa, or someplace. Then we melt it down, dig another hole, bury it again and pay people to stand around guarding it. It has no utility. Anyone watching from Mars would be scratching their head.”
For the most part I agree with Buffett on his gold commentary, but when he says commodities “don’t do anything for you,” I draw the line there. Many commodities, outside of gold, can do a lot for you. Steel is building skyscrapers, copper is wiring cities, uranium is fueling nuclear facilities, and corn is feeding the masses. Buffett believes in buying farms, but without the commodities harvested on that farm, the land would not be producing the income he so emphatically cherishes. Gold on the other hand, while providing some limited utility, has very few applications…other than looking shiny and pretty.
Buffett on Elephant Hunting
Another subject that Buffett addresses in his annual shareholder letter, and again in this interview, is his appetite to complete large “elephant” acquisitions. Since Berkshire Hathaway (BRKA/B) is so large now (total assets over $372 billion), it takes a sizeable elephant deal to be big enough to move the materiality needle for Berkshire.
“We’re looking for elephants. For one thing, there aren’t many elephants out there, and all the elephants don’t want to go in our zoo…It’s going to be rare that we are going find something selling in the tens of billions of dollars; where I understand the business; where the management wants to join up with Berkshire; where the price makes the deal feasible; but it will happen from time to time.”
Buffett’s target universe is actually fairly narrow, if you consider his estimate of about 50 targets that meet his true elephant definition. He has been quite open about the challenges of managing such a gigantic portfolio of assets. The ability to outperform the indexes becomes more difficult as the company swells because size becomes an impediment – “gravity always wins.”
With experience and age comes quote-ability, and Warren Buffett has no shortage in this skill department. The fact that Buffett’s investment track record is virtually untouchable is reason enough to hang upon his every word, but his uncanny aptitude to craft stories and analogies – such as gold fondling and elephant hunting – guarantees I will continue waiting with bated breath for his next sage nuggets of wisdom.
Wade W. Slome, CFA, CFP®
Plan. Invest. Prosper.
DISCLOSURE: Sidoxia Capital Management (SCM) and some of its clients own certain exchange traded funds (including commodities) and commodity related equities, but at the time of publishing SCM had no direct position in BRKA/B, XOM or any other security referenced in this article. No information accessed through the Investing Caffeine (IC) website constitutes investment, financial, legal, tax or other advice nor is to be relied on in making an investment or other decision. Please read disclosure language on IC “Contact” page.


