Posts tagged ‘fund flows’
Stirring the Sentiment Tea Leaves Redux

Despite the Volatility Index (VIX) currently operating at the low end of historical ranges (9.36), the equity markets operate on a perpetual volatility rollercoaster. This period of relative calm has not stopped participants from searching for the Holy Grail of indicators in hopes of determining whether the next large move in the markets is upwards or downwards. Although markets may be efficient in the long-run (see Crisis Black Eye), in the short-run, financial markets are hostage to fear and greed, and these emotions have been on full display. Although the Dow Jones Industrial Average has almost catapulted almost +4,000 points since the period right before the 2016 Presidential Election, last June also produced a roughly -1,000 point decline in the Dow. With fresh fears over Russian intervention-collusion, global monetary policy uncertainty, and political risk in North Korea, investors are grasping for clues as they read the indicator tea leaves to better position their portfolios. Some of these contrarian sentiment indicators can be helpful to your portfolio, if used properly. However, in large part, interpreting many of the sentiment indicators is as useful as reading tea leaves for your winning lotto number picks.
The Art of Tea Leave Reading
The premise behind contrarian investing is fairly simple – if you follow the herd, you will be led to the slaughterhouse. There is a tendency for investors to succumb to short-termism and act on their emotions rather than reason. The pendulum of investment emotions continually swings back and forth between fear and greed, and many of these indicators are designed with the goal of capturing emotion extremes.
The concept of mass hysteria is nothing new. Back in 1841, Charles Mackay published a book entitled, Extraordinary Popular Delusions and the Madness of Crowds, in which Mackay explores the psychology of crowds and mass mania through centuries of history, including the infamous Dutch Tulip Mania of the early 1600s (see Soros Super Bubble).
Out of sympathy for your eyeballs, I will not conduct an in-depth review of all the contrarian indicators, but here is brief sampling:
Sentiment Surveys: The American Association of Individual Investors (AAII) releases weekly survey results from its membership. A different survey, conducted by Investors Intelligence, called the Advisors Sentiment Index, surveys authors of various stock advice newsletters. These data can provide some insights, but as you can probably gather, these surveys are also very subjective and often conflicting.
Put-Call Ratio: This is a widely used ratio that measures the trading volume of bearish put options to bullish call options and is used to gauge the overall mood of the market. When investors are fearful and believe prices will go lower, the ratio of puts to calls escalates. At historically high levels (see chart below), this ratio usually indicates a bottoming process in the market.
Volatility Index (VIX): The VIX indicator or “Fear Gauge” calculates inputs from various call and put options to create an approximation of the S&P 500 index implied volatility for the next 30 days. Put simply, when fear is high, the price of insurance catapults upwards and the VIX moves higher.
Strategist Sentiment: If you’re looking for a contrarian call to payoff, I wouldn’t hold your breath by waiting for bearish strategist sentiment to kick-in. Barry Ritholtz at the Big Picture got it right when he summarized Barron’s bullish strategist outlook by saying, “File this one under Duh!” Like most Wall Street and asset management firms, strategists have an inherent conflict of interest to provide a rosy outlook. More often than not, strategists’ opinions move like the wind in whatever direction stocks are currently moving.
Short Interest: The higher the amount of shares shorted, the larger the pent-up demand to buy shares becomes in the future. Extremely high levels of short interest tend to coincide with price bottoms because as prices begin to move higher, holders of short positions often feel “squeezed” to buy shares and push prices higher.
Fund Flow Data: The direction of investment dollars flowing in and out of mutual funds can provide some perspective on the psychology of the masses. This data can be found at the Investment Company Institute (ICI). Given the bloodletting of the 2008-2009 financial crisis, investors skepticism has made stocks about as popular as the approval ratings of Congress.
When it comes to sentiment indicators, I believe actions speak much louder than words. To the extent I actually do track some of these indicators, I pay much less attention to those indicators based on opinions, surveys, and technical analysis data (see Astrology or Lob Wedge). Most of my concentration is centered on those indicators explaining actual measurable investor behavior (i.e., Put-Call, VIX, Short Interest, Fund Flow, and other action-oriented trading metrics).
As we know from filtering through the avalanche of daily news data, the world can obviously can be a scary place (see Head Fakes Surprise). If you believe the world is on the cusp of ending and/or you do not believe investors are sufficiently bearish, I encourage you to build your own personal bunker and stuff it with gold or Bitcoin. If, however, you are looking to sharpen the returns on your portfolio and are thirsty for some emotional answers, pour yourself a cup of tea and pore over some sentiment indicators.

Wade W. Slome, CFA, CFP®
Plan. Invest. Prosper.
DISCLOSURE: Sidoxia Capital Management (SCM) and some of its clients own certain exchange traded funds, but at the time of publishing SCM had no direct position in any security referenced in this article. No information accessed through the Investing Caffeine (IC) website constitutes investment, financial, legal, tax or other advice nor is to be relied on in making an investment or other decision. Please read disclosure language on IC “Contact” page.
Chasing Headlines

It’s been an amazing start to the year. First the market cratered on slowing China economic concerns, domestic recessionary fears, deteriorating oil prices, and negative interest rates abroad. In response to all these worries (and others), stocks dove more than -11% (S&P 500 Index) in January, before settling down. Subsequently, the market has made a screaming recovery, in part due to dovish monetary policy comments (i.e., reduction in forecasted interest rate hikes) and diminished anxiety over a potential global collapse. Month-to-date stocks are up an impressive +5.4%, and year-to-date equities are flattish, or down less than -1%.
With an endless amount of information flowing across our smart phones and computers, it becomes quite easy and tempting to chase news headlines, just like a hyper dog chasing a car. But even once an investor catches up (or reacts) to a headline, there’s confusion around how to profit from the fleeting information. First of all, every plugged-in hedge fund and institutional investor has likely already traded on the stale information you received. Second of all, rarely is the data relevant to the long-term cash generating capabilities of the company or economy. And lastly, the news is more often than not, instantly factored into the stock price. Chasing news headlines only eaves individual investors holding the bag of performance-shattering transactions costs, taxes, and worn-out pricing.
The heightened volatility in late 2015 and early 2016 hasn’t however prevented investors and so-called pundits from attempting to time the market. Any battle-tested investment veteran knows it’s virtually impossible to consistently time the market (see also Market Timing Treadmill), but this fact hasn’t prevented speculators from attempting the feat nonetheless. Famed investment guru, Peter Lynch, who earned an average +29% annual return from 1977-1990, summed it up well when he stated the following:
“Far more money has been lost by investors preparing for corrections, or trying to anticipate corrections, than has been lost in corrections themselves.”
The Important Factors
As I’ve written many times in the past, the keys to long-term stock performance are not knee-jerk reactions to headlines, but rather these following crucial factors (see also Don’t Be a Fool, Follow the Stool):
- Profits
- Interest Rates
- Sentiment
- Valuations
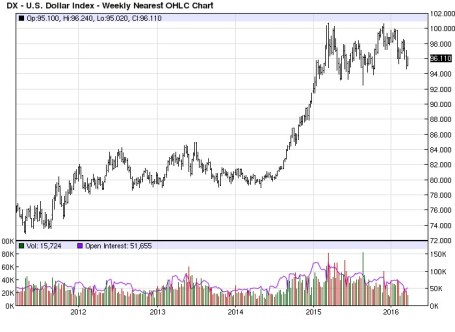
On the profit growth front, corporate income has been pressured by numerous headwinds over the last few years, including an export-shattering increase in the value of the U.S. dollar and a profit-squeezing collapse in energy sector earnings. As you can see from the chart below, the value of the U.S. dollar increased by about 25% from mid-2014 to early-2015, in part because of diverging global central bank policies (more hawkish U.S. Fed vs. more dovish ECB/international central banks). Since that spike, the dollar has settled into a broad range (95 – 100), and the former forceful headwind have now turned into modest tailwinds. This trend is important because an estimated 35-40% of corporate profits are derived from international operations.
Adding insult to injury, the roughly greater than -70% decline in forward energy earnings over the last 18 months has caused a significant hit to overall S&P 500 profits. The tide appears to be finally turning (or at least stabilizing) however, as we’ve seen oil prices rebound by about +30% this year from the lows in January. If these aforementioned trends persist, profit pressures in 2016 are likely to abate significantly, and may actually become additive to growth.
Source: Barchart.com
Profits are important, but so are interest rates. While incessant talk about the path of future Fed policy continues to blanket the airwaves (see also Fed Fatigue), absent a rapid increase in interest rates (say 300-400 basis points), interest rates remain unambiguously positive for equity markets, providing a floor for the oft-repeated volatility in financial markets. As long as stocks are providing higher yields than many bonds, and depositors are earning 0% (or negative rates) on their checking accounts, stocks may remain unloved, but not forgotten.
And speaking of unloved, the sentiment for stocks remains sour. One need look no further than the quarter-billion dollars in hemorrhaging outflows out of U.S. equity funds (see ICI Long-Term Mutual Fund Flows) since 2014. This deep underlying skepticism serves as a positive contrarian indicator for future equity prices. Right now, very few individual investors are swimming in the pool – the time to get out of the stock market pool is when everyone is jumping in.
And lastly, valuations remain very much in line with historical averages (approximatqely 17x 2016 projected earnings), especially considering the generational low in interest rates. Bears continue to point to the elevated CAPE ratio, which has been a disastrous indicator the last seven years (and longer), as a reason to remain cautious. The ironic part is that valuations are virtually guaranteed to improve a few years from now as we roll off the artificially depressed years of 2008-2010.
When you add it all up, zero (or negative) interest rates, combined with the other key factors of profits, sentiment, and valuations, equities remain an important and attractive part of a diversified long-term portfolio. Your objectives, time horizon, and risk tolerance will always drive the proportion of your equity allocation. Nevertheless, some bond exposure is essential to smooth out volatility. Regardless of your investment strategy, chasing headlines, like a dog chasing a car, serves no purpose other than leaving you with a tired, unproductive investment portfolio.
Wade W. Slome, CFA, CFP®
Plan. Invest. Prosper.
DISCLOSURE: Sidoxia Capital Management (SCM) and some of its clients own certain exchange traded funds, but at the time of publishing SCM had no direct position in any other security referenced in this article. No information accessed through the Investing Caffeine (IC) website constitutes investment, financial, legal, tax or other advice nor is to be relied on in making an investment or other decision. Please read disclosure language on IC “Contact” page.
Going Shopping: Chicken vs. Beef

The headlines haven’t been very rosy over the last week, but when is that ever not the case? Simply put, gloom and doom sells. The Chinese stock market is collapsing; the Yuan is plummeting; there are rising tensions in the Middle East; terrorism is rising to the fore; and commodity prices are falling apart at the seams. This is only a partial snapshot of course, and does not paint a complete or accurate picture. Near record-low interest rates; record corporate profits (outside of energy); record-low oil prices; unprecedented accommodative central bank policies; and attractive valuations are but a few of the positive, countervailing factors that rarely surface through the media outlets.
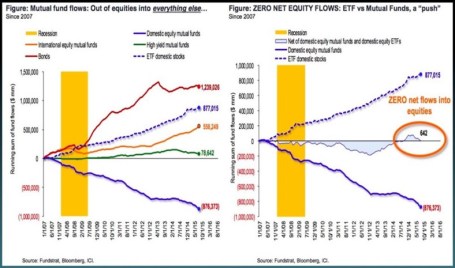
At the end of the day, smart long-term investors understand investing in financial markets is a lot like grocery store shopping. Similarly to stocks and bonds, prices at the supermarket fluctuate daily. Whether you’re comparing beef (bonds) and chicken (stocks) prices in the meat department (stock market), or apple (real estate) and orange (commodities) prices in the produce department (global financial markets), ultimately, shrewd shoppers eventually migrate towards purchasing the best values. Since the onset of the 2008-2009 financial crisis, risk aversion has dominated over value-based prudence as evidenced by investors flocking towards the perceived safety of cash, Treasury bonds, and other fixed income securities that are expensively priced near record highs. As you can see from the chart below, investors poured $1.2 trillion into bonds and effectively $0 into stocks. Consumers may still be eating lots of steaks (bonds) currently priced at $6.08/lb while chicken (stocks) is at $1.48/lb (see U.S. Department of Labor Data – Nov. 2015), but at some point, risk aversion will abate, and consumers will adjust their preferences towards the bargain product.
Some Shoppers Still Buying Chicken
While the general public may have missed the massive bull market in stocks, astute corporate executives and investment managers took advantage of the equity bargains in recent years, as seen by stock prices tripling from the March 2009 lows. As corporate profits and margins have marched to record levels, CEOs/CFOs put their money where their mouths are by investing trillions of dollars into share buybacks and mergers & acquisitions transactions.
Despite the advance in the multi-year bull market, with the recent sell-off, panic has once again dominated rational thinking. We see this rare phenomenon (a few times over the last century) manifest itself through a stock market dividend yield that exceeds the yield on Treasury bonds (2.2% S&P 500 vs 2.1% 10-Year Treasury). But if we are once again comparing beef vs. chicken prices (bonds vs stocks), the 6% earnings yield on stocks (i.e., Inverse P/E ratio or E/P) now looks even more compelling relative to the 2% yield on bonds. For example, the iShares Core U.S. Aggregate Bond ETF (AGG) is currently yielding a meager 2.3%.
For a general overview, Scott Grannis at Calafia Beach Pundit summarizes the grocery store flyer of investment options below:
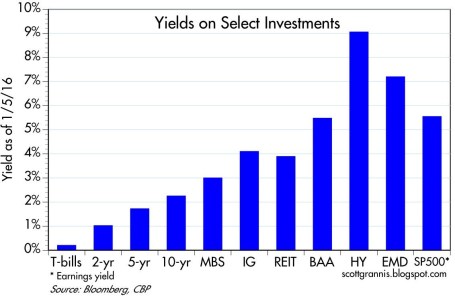
While these yield relationships can and will certainly change under various economic scenarios, there are no concrete signs of an impending recession. The recent employment data of 292,000 new jobs added during December (above the 200,000 estimate) is verification that the economy is not falling off a cliff into recession (see chart below). As I’ve written in the past, the positively-sloped yield curve also bolsters the case for an expansionary economy.

Source: Calafia Beach Pundit
While it’s true the Chinese economy is slowing, its rate is still growing at multiples of the U.S. economy. As a communist country liberalizes currency and stock market capital controls (i.e., adds/removes circuit breakers), and also attempts to migrate the economy from export-driven growth to consumer-driven expansion, periodic bumps and bruises should surprise nobody. With that said, China’s economy is slowly moving in the right direction and the government will continue to implement policies and programs to stimulate growth (see China Leaders Flag More Stimulus).
As we have recently experienced another China-driven correction in the stock market, and the U.S. economic expansion matures, equity investors must realize volatility is the price of admission for earning higher long-term returns. However, rather than panicking from fear-driven headlines, it’s times like these that should remind you to sharpen your shopping list pencil. You want to prudently allocate your investment dollars when deciding whether now’s the time to buy chicken (6% yield) or beef (2% yield).
Wade W. Slome, CFA, CFP®
Plan. Invest. Prosper.
DISCLOSURE: Sidoxia Capital Management (SCM) and some of its clients hold positions in certain exchange traded funds (ETFs) including AGG, but at the time of publishing had no direct position in any other security referenced in this article. No information accessed through the Investing Caffeine (IC) website constitutes investment, financial, legal, tax or other advice nor is to be relied on in making an investment or other decision. Please read disclosure language on IC Contact page.
F.U.D. and Dividend Shock Absorbers

As the existential question remains open on whether Greece will remain a functioning entity within the eurozone, investor anxiety and manic behavior continues to be the norm. Rampant fear seems very counterintuitive for a stock market that has more than tripled in value from early 2009 with the S&P 500 index only sitting -3% below all-time record highs. Common sense would dictate that euphoric investor appetites have contributed to years of new record highs in the U.S. stock market, but that isn’t the case now. Rather, the enormous appreciation experienced in recent years can be better explained by the trillions of dollars directed towards buoyant share buybacks and mergers.
With a bull market still briskly running into its sixth year, where can we find the evidence for all this anxiety? Well, if you don’t believe all the nail biting concerns you hear from friends, family members, and co-workers about a Grexit (Greek exit from the euro), Chinese stock market bubble, Puerto Rico collapse, and/or impending Fed rate hike, then here are a few confirming data points.
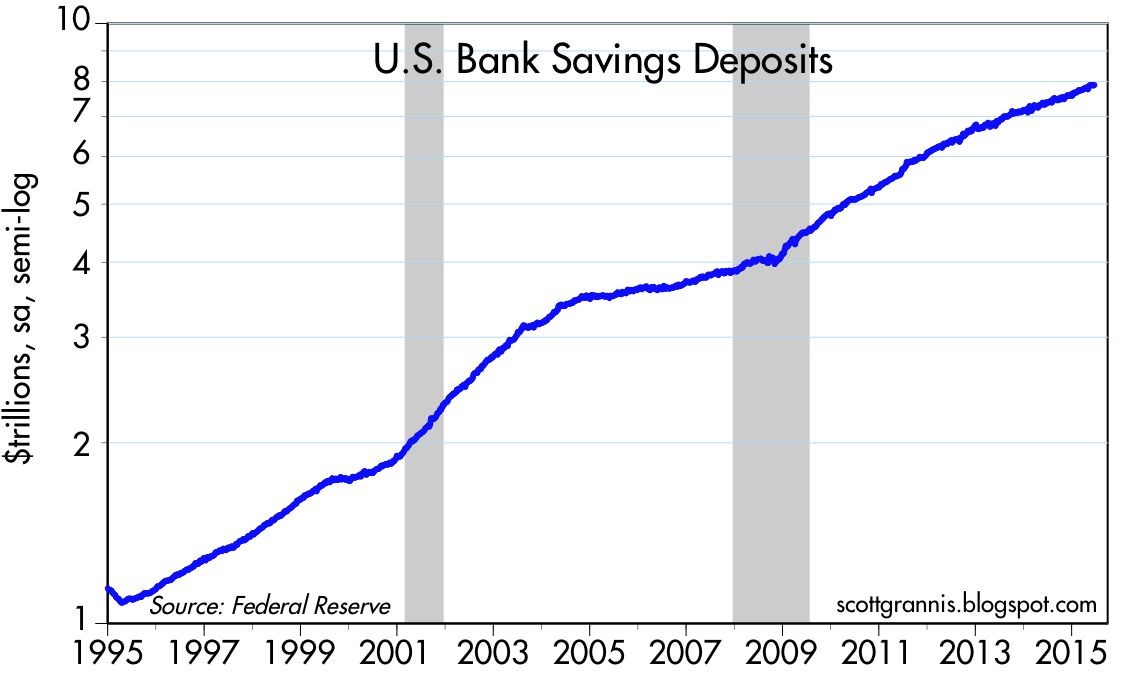
For starters, let’s take a look at the record $8 trillion of cash being stuffed under the mattress at near 0% rates in savings deposits (see chart below). The unbelievable 15% annual growth rate in cash hoarding since the turn of the century is even scarier once you consider the massive value destruction from the eroding impact of inflation and the colossal opportunity costs lost from gains and yields in alternative investments.
Next, you can witness the irrational risk averse behavior of investors piling into low (and negative) yielding bonds. Case in point are the 10-year yields in developing countries like Germany, Japan, and the U.S. (see chart below).
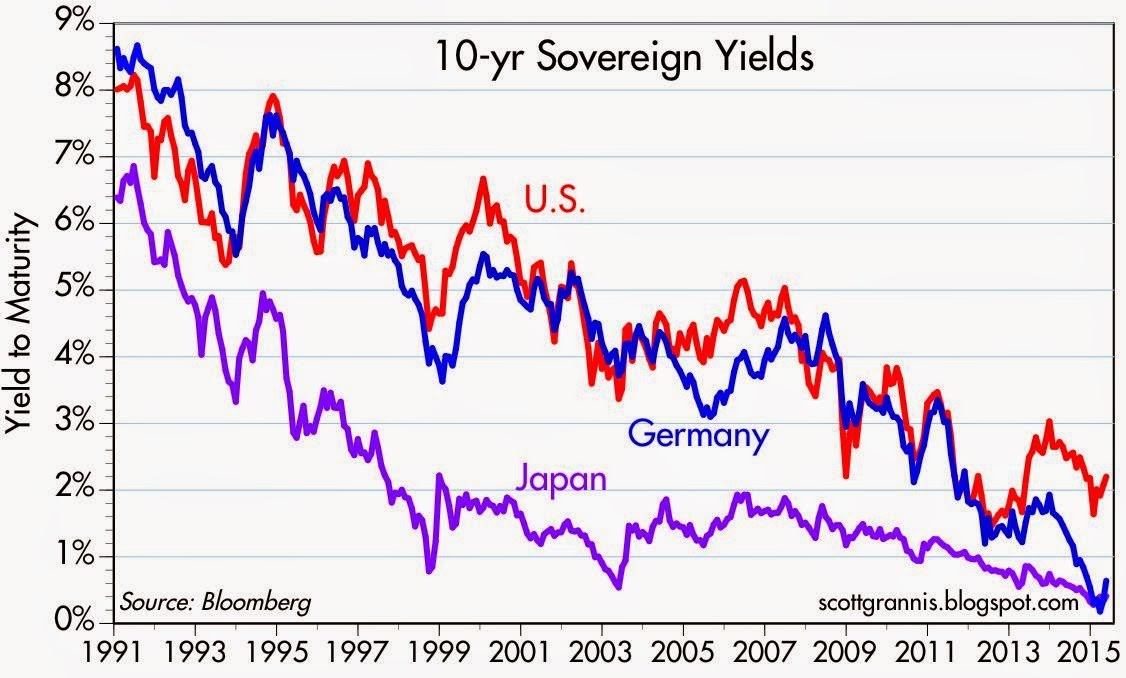
The 25-year downward trend in rates is a very scary development for yield-hungry investors. The picture doesn’t look much prettier once you realize the compensation for holding a 30-year bond (currently +3.2%) is only +0.8% more than holding the same Treasury bond for 10 years (now +2.4%). Yes, it is true that sluggish global growth and tame inflation is keeping a lid on interest rates, but these trends highlight once again that F.U.D. (fear, uncertainty, and doubt) has more to do with the perceived flight to safety and high bond prices (low bond yields).
In addition, the -$57 billion in outflows out of U.S. equity funds this year is further evidence that F.U.D. is out in full force. As I’ve noted on repeated occasions, when the tide turns on a sustained multi-year basis and investors dive head first into stocks, this will be proof that the bull market is long in the tooth and conservatism should be the default posture.
Dividend Shock Absorbers
There are always plenty of scary headlines that tempt investors to bail out of their investments. Today those alarming headlines span from Greece and China to Puerto Rico and the Federal Reserve. When the winds of fear, uncertainty, and doubt are fiercely swirling, it’s important to remember that any investment strategy should be constructed in a diversified manner that meshes with your time horizon and risk tolerance.
Consistent with maintaining a diversified portfolio, owning reliable dividend paying stocks is an important component of investment strategy, especially during volatile periods like we are experiencing currently. Sure, I still love to own high octane, non-dividend growth stocks in my personal and client portfolios, but owning stocks with a healthy stream of dividends serve as shock absorbers in bumpy markets with periodic surprise potholes.
As I’ve note before, bond issuers don’t call up investors and raise periodic coupon payments out of the kindness of their hearts, but stock issuers can and do raise dividends (see chart below). Most people don’t realize it, but over the last 100 years, dividends have accounted for approximately 40% of stocks’ total return as measured by the S&P 500.
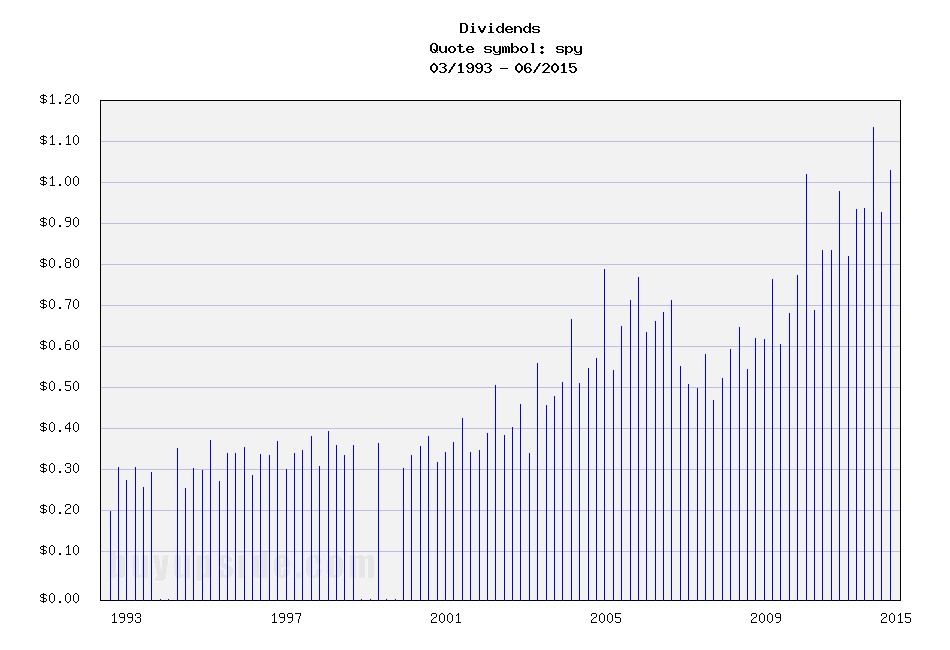
Source: BuyUpside.com
Markets will continue to move up and down on the news du jour, but dividends overall remain fairly steady. In the worst financial crisis in a generation, dividends dipped temporarily, but as I explain in a previous article (The Gift that Keeps on Giving), dividends have been on a fairly consistent 6% growth trajectory over the last two decades. With corporate dividend payout ratios well below long term historical averages of 50%, companies still have plenty of room to maintain (and grow) dividends – even if the economy and corporate profits slow.
Don’t succumb to all the F.U.D., and if you feel yourself beginning to fall into that trap, re-evaluate your portfolio to make sure your diversified portfolio has some shock absorbers in the form of dividend paying stocks. That way your portfolio can handle those unexpected financial potholes that repeatedly pop up.

Wade W. Slome, CFA, CFP®
Plan. Invest. Prosper.
DISCLOSURE: Sidoxia Capital Management (SCM) and some of its clients hold positions in certain exchange traded funds (ETFs) and SPY, but at the time of publishing, SCM had no direct position in any other security referenced in this article. No information accessed through the Investing Caffeine (IC) website constitutes investment, financial, legal, tax or other advice nor is to be relied on in making an investment or other decision. Please read disclosure language on ICContact page.
Markets Soar and Investors Snore

This article is an excerpt from a previously released Sidoxia Capital Management complementary newsletter (August 1, 2013). Subscribe on the right side of the page for the complete text.
If you haven’t been paying close attention, or perhaps if you were taking a long nap, you may not have noticed that the stock market was up an astounding +5% in July (+78% if compounded annualized), pushing the S&P 500 index up +18% for the year to near all-time record highs. Wait a second…how can that be when that bald and grey-bearded man at the Federal Reserve has hinted at bond purchase “tapering” (see also Fed Fatigue)? What’s more, I thought the moronic politicians were clueless about our debt and deficit-laden economy, jobless recovery, imploding eurozone, Chinese real estate bubble, and impending explosion of inflation – all of which are expected to sink our grandchildren’s grandchildren into a standard of living not seen since the Great Depression. Okay, well a dash of hyperbole and sarcasm never hurt anybody.
This incessant stream of doom-and-gloom pouring over our TVs, newspapers, and internet devices has numbed Americans’ psyches. To prove my point, the next time you are talking to somebody at the water cooler, church, soccer game, or happy hour, gauge how excited your co-worker, friend, or acquaintance gets when you bring up the subject of the stock market. If my suspicions are correct, they are more likely to yawn or pass out from boredom than to scream in excitement or do cartwheels.
You don’t believe me? Reality dictates the wounds from the 2008-2009 financial crisis are still healing. Panic and fear may have disappeared, but skepticism remains in full gear, even though stocks have more than doubled in price in recent years. Here is some data to support my case there are more stock detractors than defenders:
Record Savings Deposits
 |
| Source: Calafia Beach Pundit |
Although there are no signs of an impending recession, defensive cash hoarded in savings deposits has almost increased by $3 trillion since the end of the financial crisis.
Blah Consumer Confidence
 |
| Source: Calafia Beach Pundit |
As you can see from the chart above, Consumer Confidence has bounced around quite a bit over the last 30+ years, but there is no sign that consumer sentiment has turned euphoric.
15-Year Low Stock Market Participation
 |
|
Source: Gallup Poll
|
There has been a trickling of funds into stocks in 2013, yet participation in the stock market is at a 15-year low. Investors remain nervous.
Lack of Equity Fund Buying
 |
| Source: ICI & Calafia Beach Pundit |
After a short lived tax-driven purchase spike in January, the buying trend quickly turned negative in the ensuing months. Modest inflows resumed into equity funds during the first few weeks of July (source: ICI), but the meager stock fund investments represent < 95% of 2012 positive bond flows ($15 billion < $304 billion, respectively). Moreover, these modest stock inflows pale in comparison to the hundreds of billions in investor withdrawals since 2008. See also Fund Flows Paradox – Investing Caffeine.
Decline in CNBC Viewership
In spite of the stock market more than doubling in value from the lows of 2009, CNBC viewer ratings are the weakest in about 20 years (source: Value Walk). Stock investing apparently isn’t very exciting when prices go up.
The Hater’s Index:
And if that is not enough, you can take a field trip to the hater’s comment section of my most recent written Seeking Alpha article, The Most Hated Bull Market Ever. Apparently the stock market more than doubling creates some hostile feelings.
JOLLY & JOVIAL MEMO

Keeping the previous objective and subjective data points in mind, it’s clear to me the doom-and-gloom memo has been adequately distributed to the masses. Less clear, however, is the dissemination success of the jolly-and-jovial memo. I think Ron Bailey, an author and science journalist at Reason.com (VIDEO), said it best, “News is always bad news. Good news is simply not news…that is our [human] bias.” If you turn on your local TV news, I think you may agree with Ron. Nevertheless, there are actually plenty of happier news items to report, so here are some positive bullet points to my economic and stock market memo:
16th Consecutive Positive GDP Quarter*
 |
| Source: Quartz.com |
The broadest measure of economic activity, GDP (Gross Domestic Product), was reported yesterday and came in better than expected in Q2 (+1.7%) for the 16th straight positive reported quarter (*Q1-2011 was just revised to fractionally negative). Obviously, the economists and dooms-dayers who repeatedly called for a double-dip recession were wrong.
40 Consecutive Months & 7 Million Jobs
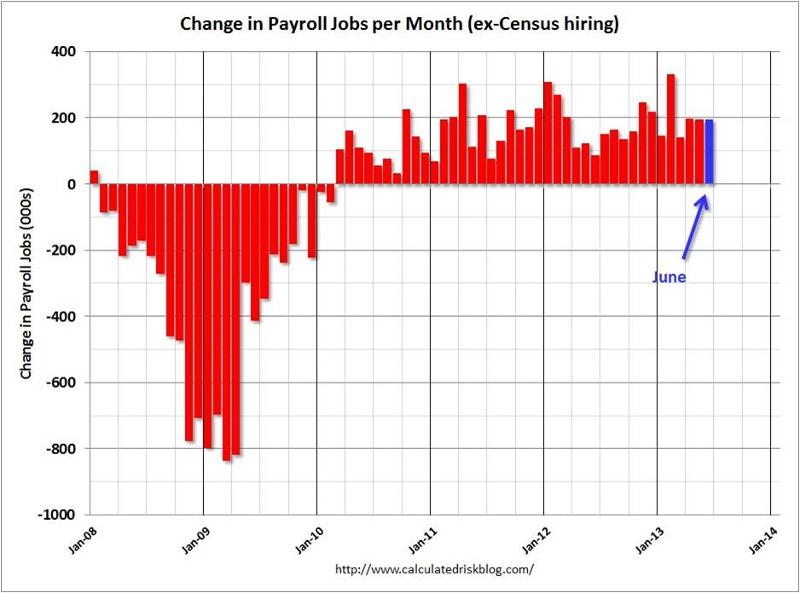
Source: Calculated Risk
The economic recovery has been painfully slow, but nevertheless, the U.S. has experienced 40 consecutive months of private sector job additions, representing +7.2 million jobs created. With about -9 million jobs lost during the most recent recession, there is still plenty of room for improvement. We will find out if the positive job creation streak will continue this Friday when the July total non-farm payroll report is released.
Housing on the Mend
 |
| Source: Calafia Beach Pundit |
New home sales are up significantly from the lows; housing starts have risen about 40% over the last two years; and Case Shiller home prices rose by +12.2% in the latest reported numbers. The housing market foundation is firming.
Auto Sales Rebound
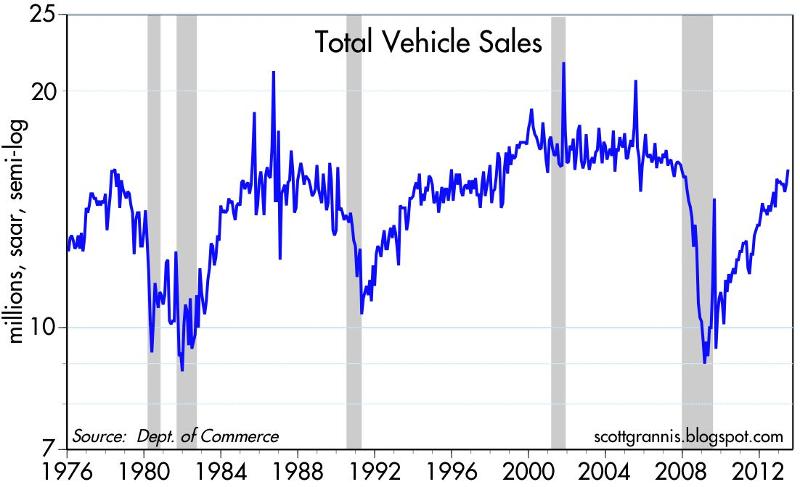 |
| Source: Calafia Beach Pundit |
Auto sales remain on a tear, reaching an annualized level of 15.9 million vehicles, the highest since November 2007, and up +12% from June 2012. Car sales have almost reached pre-recessionary levels.
Record Corporate Profits
 |
| Source: Dr. Ed’s Blog |
Optimistic forecasts have been ratcheted down, nonetheless corporate profits continue to grind to all-time record highs. As you can see, operating earnings have more than doubled since 2003. Given reasonable historical valuations in stocks, as measured by the P/E (Price Earnings) ratio, persistent profit growth should augur well for stock prices.
Bad Banks Bounce Back
Europe on the Comeback Trail
 |
| Source: Calafia Beach Pundit |
There are signs of improvement in the Eurozone after years of recession. Talks of a European Armageddon have recently abated, in part because of Markit manufacturing manager purchasing statistics that are signaling expansion for the first time in two years.
Overall, corporations are achieving record profits and sitting on mountains of cash. The economy is continuing on a broad, steady recovery, however investors remain skeptical. Domestic stocks are at historic levels, but buying stocks solely because they are going up is never the right reason to invest. Alternatively, bunkering away excessive cash in useless, inflation depreciating assets is not the best strategy either. If nervousness and/or anxiety are driving your investment strategy, then perhaps now is the time to create a long-term plan to secure your financial future. However, if your goal is to soak up the endless doom-and-gloom and watch your money melt away to inflation, then perhaps you are better off just taking another nap.
Wade W. Slome, CFA, CFP®
Plan. Invest. Prosper.
DISCLOSURE: Sidoxia Capital Management (SCM) and some of its clients hold positions in certain exchange traded funds (ETFs), but at the time of publishing, SCM had no direct position in any other security referenced in this article. No information accessed through the Investing Caffeine (IC) website constitutes investment, financial, legal, tax or other advice nor is to be relied on in making an investment or other decision. Please read disclosure language on IC Contact page.
2012 Investing Caffeine Greatest Hits

Source: Photobucket
Between Felix Baumgartner flying through space at the speed of sound and the masses flapping their arms Gangnam style, we all still managed to survive the Mayan apocalyptic end to the world. Investing Caffeine also survived and managed to grow it’s viewership by about +50% from last year.
Thank you to all the readers who inspire me to spew out my random but impassioned thoughts on a somewhat regular basis. Investing Caffeine and Sidoxia Capital Management wish you a healthy, happy, and prosperous New Year in 2013!
Here are some of the most popular Investing Caffeine postings over the year:

Explaining how billions of dollars in stock selling can lead to doubling in stock prices.
2) Uncertainty: Love It or Hate It?

Source: Photobucket
Good investors love ambiguity.
3) USA Inc.: Buy, Hold or Sell?
What would you do if our country was a stock?
4) Fiscal Cliff: Will a 1937 Repeat = 2013 Dead Meat?
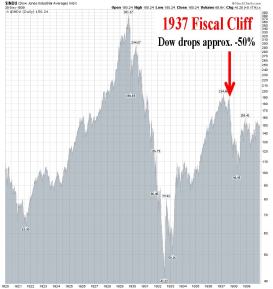
Source: StockCharts.com
Determining whether history will repeat itself after the presidential elections.
5) Robotic Chain Saw Replaces Paul Bunyan

How robots are changing the face of the global job market.
6) Floating Hedge Fund on Ice Thawing Out

Lessons learned from Iceland four years after Lehman Brothers.
7) Sidoxia’s Investor Hall of Fame

Continue reading at IC & perhaps you too can become a member?!
8) Broken Record Repeats Itself

It appears that the cycle from previous years is happening again.
9) The European Dog Ate My Homework

Explaining the tight correlation of European & U.S. markets, and what to do about it.
10) Cash Security Blanket Turns into Tourniquet

Stock market returns are beginning to make change perceptions about holding cash.
Wade W. Slome, CFA, CFP®
Plan. Invest. Prosper.
DISCLOSURE: Sidoxia Capital Management (SCM) and some of its clients hold positions in certain exchange traded funds (ETFs), but at the time of publishing SCM had no direct positions in any other security referenced in this article. No information accessed through the Investing Caffeine (IC) website constitutes investment, financial, legal, tax or other advice nor is to be relied on in making an investment or other decision. Please read disclosure language on IC Contact page.
Cash Security Blanket Turns Into Tourniquet
![]()
Article is an excerpt from Sidoxia Capital Management’s April 2012 newsletter. Subscribe on right side of page.
That warm safety blanket of cash that millions of Americans have clutched on to during the 2008-09 financial crisis; the 2010 “Flash Crash”; and the 2011 U.S. credit downgrade felt cozy during the bumpy ride we experienced over the last three years. Now with domestic stocks (S&P 500) up +12% in the first quarter of 2012, that same comfy blanket of CDs, money market, and checking accounts is switching into a painful tourniquet, cutting off the lucrative blood and oxygen supply to millions of Americans’ future retirement plans.
Earning next to nothing by stuffing your money under the mattress (0.7% average CD rate – Bankrate.com) isn’t going to make many financial dreams a reality. The truth of the matter is that due to inflation (running +2% to +3% per year), blanket holders are losing about -2% per year in the true value of their savings.
Your Choice: 3 Years or 107 years?
If you like to accumulate money, would you prefer doubling your money in 3 years or 107 years? Although the S&P 500 has more than doubled over the last three years, based on fund flows data and cash balances at the banks, apparently more individuals prefer waiting until the year 2119 (107 years from now) for their money to double – SEE CHART BELOW.

Obviously the massive underperformance of CDs cherry picks the time-period a bit, given the superb performance of stocks from 2009 – 2012 year-to-date. Over 1999-2012 stock performance hasn’t been as spectacular, but what we do know is that despite the lackluster performance of stocks over the last 12 years, corporate profits have about doubled in a similar timeframe, making equity prices that much more attractive relative to 1999.
With the economy and employment picture improving, some doomsday scenarios have temporarily been put on the backburner. As the recovery has gained some steam, many people are opening their bank statements with the painful realization, “I just made $31.49 on my checking maximizer account last year! Wow, how incredible…I can now go out and buy a half-tank of gas.” Never mind that healthcare premiums are exploding, food costs are skyrocketing, and that vacation you were planning is now out of reach. If you’re a mega-millionaire, perhaps you can make these stingy rates work for you, but for most of the other people, successful retirements will require more efficient use of their investment dollars. Or of course you can always work at Wal-Mart (WMT) as a greeter in your 80s.
Rationalizing with a Teen
Some people get it and some don’t. Trying to time the market, by getting in and out at the right times is a losing battle (see Getting Off the Market Timing Treadmill). Even the smartest professionals in the industry have little accuracy and cannot consistently predict the direction of the markets. Rationalizing the ups and downs of the financial markets is equivalent to rationalizing the actions of a teenager. Sometimes the outcomes are explainable, but most of the times they are not.
What an astute investor does know is that higher long-term returns come with higher volatility. So while the last four years have been a bumpy ride for investors, this is nothing new for an experienced investor who has studied the history of financial markets. There have been a dozen or so recessions since World War II, and we’ll have a dozen or so more over the next 50-60 years. Wars, banking crises, currency crises, and political turmoil have been a constant over history. Despite all these setbacks, the equity markets have climbed over +1,300% over the last 30 years or so. The smartest financial minds on the planet (e.g., the Ben Bernankes and Alan Greenspans of the world) haven’t been able to figure it out, so if they couldn’t do it, how is an average Joe supposed to be able to time the market? The answer is nobody can predict the direction of the market reliably.
As my clients and Investing Caffeine followers know, for those individuals with adequate savings and shorter time horizons, much of this conversation is irrelevant. However, based on our country’s low savings rate and the demographics of longer Baby Boomer life expectancies, most individuals can’t afford to stuff all their money under the mattress. As famous investor Sir John Templeton stated, “The only way to avoid mistakes is not to invest – which is the biggest mistake of all.” Earning 0.7% on your nest egg is difficult to call investing.
Ignoring the Experts
Why is the investing game so difficult? For starters, individuals are constantly bombarded by so-called experts through television, radio, and newspapers. Not only did Federal Reserve Chairmen Alan Greenspan and Ben Bernanke get the economy, financial markets, and housing markets wrong, the most powerful and smart financial institution CEOs were dead wrong as well. Look no further than Lehman Brothers (Dick Fuld), Citigroup Inc. (Chuck Prince), and American International Group (Martin Sullivan), which were believed to house some of the shrewdest executives – they too completely missed the financial crisis.
Rather than listening to shoddy predictions from pundits who have little to no investing experience, it makes more sense to listen to successful long-term investors who have survived multiple investment cycles and lived to tell the tale. Those people include the great fund manager Peter Lynch who said it is better to “assume the market is going nowhere and invest accordingly,” rather than try to time the market.
What You Hear
As the market has more than doubled over the last 37 months, here are some clouds of pessimism that these same shoddy economists, strategists, and analysts have described for investors:
* Europe and Greece’s impending fiscal domino collapse
* Excessive money printing at the Federal Reserve through quantitative easing and other programs
* Imminent government disintegration due to unresolved structural debts and deficits
* Elevated unemployment rates and pathetic job creation statistics
* Rigged high frequency trading and “Flash Crash”
* Credit downgrade and political turmoil in Washington
* Looming Chinese real estate bubble and subsequent hard economic landing
Unfortunately, many investors got sucked up in these ominous warnings and missed most, if not all, of the recent doubling in equity markets.
What You Don’t Hear
What you haven’t heard from the popular press are the following headlines:
* 10 consecutive quarters of GDP growth
* Record corporate profits and profit margins
* Equity valuations attractively priced below 50-year average (14.4 < 16.6 via Calafia Beach Pundit)
* Rising dividends with yields approaching 3%, if you consider recent bank announcements
* Record low interest rates and moderate inflation make earnings streams and dividends that much more valuable
* Four million new jobs created over the last three years
* S&P Smallcap near all-time highs (21 years); S&P Midcap index near all-time highs (20 years); NASDAQ is at 11-year highs; Dow Jones Industrials and S&P 500 near 4-year-highs.
* Record retail sales with a consumer that has reduced household debt

Source: Calafia Beach Pundit
Given the massive upward run in the stock market over the last few years (and a complacent short-term VIX reading of 15), stocks are ripe for a breather. With that said, I would advise any blanket holders to not get too comfy with that money decaying away in a CD, money market, or savings account. Waiting too long may turn that security blanket into a tourniquet – forcing investors to amputate a portion of their future retirement savings.
Wade W. Slome, CFA, CFP®
Plan. Invest. Prosper.
DISCLOSURE: Sidoxia Capital Management (SCM) and some of its clients own certain exchange traded funds and WMT, but at the time of publishing SCM had no direct position in C, AIG, RATE, Lehman Brothers, or any other security referenced in this article. No information accessed through the Investing Caffeine (IC) website constitutes investment, financial, legal, tax or other advice nor is to be relied on in making an investment or other decision. Please read disclosure language on IC “Contact” page.
Stirring the Sentiment Tea Leaves Redux
The equity markets have been on a volatility rollercoaster while participants continue to search for the Holy Grail of indicators – in hopes of determining whether the next large move in the markets is upwards or downwards. Although markets may be efficient in the long-run (see Crisis Black Eye), in the short-run, financial markets are hostage to fear and greed, and these emotions have been on full display. In the last two weeks alone, we have witnessed the Dow Jones Industrial Average catapult skyward over +1,200 points, while just a few weeks earlier the Dow cratered about -800 points in a five day period. With fresh fears of a European banking collapse, a global recession, and an uncertain election in the U.S. approaching, investors are grasping for clues as they read the indicator tea leaves to better position their portfolios. Some of these contrarian sentiment indicators can be helpful to your portfolio, if used properly, however interpreting many of the sentiment indicators is as useful as reading tea leaves is for picking winning lotto numbers.
The Art of Tea Leave Reading
The premise behind contrarian investing is fairly simple – if you follow the herd, you will be led to the slaughterhouse. There is a tendency for investors to succumb to short-termism and act on their emotions rather than reason. The pendulum of investment emotions continually swings back and forth between fear and greed, and many of these indicators are designed with the goal of capturing emotion extremes.
The concept of mass hysteria is nothing new. Back in 1841, Charles Mackay published a book entitled, Extraordinary Popular Delusions and the Madness of Crowds, in which Mackay explores the psychology of crowds and mass mania through centuries of history, including the infamous Dutch Tulip Mania of the early 1600s (see Soros Super Bubble).
Out of sympathy for your eyeballs, I will not conduct an in-depth review of all the contrarian indicators, but here is brief sampling:
Sentiment Surveys: The American Association of Individual Investors (AAII) releases weekly survey results from its membership. With the recent stock market bounce, bullish sentiment has escalated up near historic averages (39.8% bullish), yet the bears still remain skeptical – more than 6% higher than normal (36.4% bearish). A different survey, conducted by Investors Intelligence, called the Advisors Sentiment Index, surveys authors of various stock advice newsletters. The index showed bearish sentiment reaching 46.3%, the highest negative reading since the 2008-2009 bear market low. These data can provide some insights, but as you can probably gather, these surveys are also very subjective and often conflicting.
Put-Call Ratio: This is a widely used ratio that measures the trading volume of bearish put options to bullish call options and is used to gauge the overall mood of the market. When investors are fearful and believe prices will go lower, the ratio of puts to calls escalates. At historically high levels (see chart below), this ratio usually indicates a bottoming process in the market.
Volatility Index (VIX): The VIX indicator or “Fear Gauge” calculates inputs from various call and put options to create an approximation of the S&P 500 index implied volatility for the next 30 days. Put simply, when fear is high, the price of insurance catapults upwards and the VIX moves higher. Over the last 25 years a VIX reading of 44 or higher has only been reached nine times (source: Don Hays), so as you can see from the chart below, the recent market rally has coincided with the short-term peak in the VIX.

Source: Market-Harmonics.com
Strategist Sentiment: If you’re looking for a contrarian call to payoff, I wouldn’t hold your breath by waiting for bearish strategist sentiment to kick-in. Barry Ritholtz at the Big Picture got it right when he summarized Barron’s bullish strategist outlook by saying, “File this one under Duh!” Like most Wall Street and asset management firms, strategists have an inherent conflict of interest to provide a rosy outlook. For what it’s worth, the market is up slightly since the Barron’s strategist outlook was published last month.
Short Interest: The higher the amount of shares shorted, the larger the pent-up demand to buy shares becomes in the future. Extremely high levels of short interest tend to coincide with price bottoms because as prices begin to move higher, holders of short positions often feel “squeezed” to buy shares and push prices higher. According to SmartMoney.com, hedge fund managers own the lowest percentage of stocks (45%) since March 2009 market price bottom. Research from Data Explorer also suggests that sentiment is severely negative – the highest short interest level experienced since mid-2009.
Fund Flow Data: The direction of investment dollars flowing in and out of mutual funds can provide some perspective on the psychology of the masses. Recent data coming from the Investment Company Institute (ICI) shows that -$63.6 billion has flowed out of all equity funds in 2011, while +$81.7 billion has flowed into bond funds. Suffice it to say, investor nervousness has made stocks as about as popular as the approval ratings of Congress.
When it comes to sentiment indicators, I believe actions speak much louder than words. To the extent I actually do track some of these indicators, I pay much less attention to those indicators based on opinions, surveys, and technical analysis data (see Astrology or Lob Wedge). Most of my concentration is centered on those indicators explaining actual measurable investor behavior (i.e., Put-Call, VIX, Short Interest, Fund Flow, and other action-oriented trading metrics).
As we know from filtering through the avalanche of daily news data, the world can obviously become a much worse place (i.e., Greece, eurozone collapse, double-dip, inflation, banking collapse, muni defaults, widening CDS spreads, etc,). If you believe the world is on the cusp of ending and/or you do not believe investors are sufficiently bearish, I encourage you to build your bunker stuffed with gold, and/or join the nearest local Occupy Wall Street chapter. If, however, you are looking to sharpen the returns on your portfolio and are thirsty for some emotional answers, pour yourself a cup of tea and pore over some sentiment indicators.
Wade W. Slome, CFA, CFP®
Plan. Invest. Prosper.
DISCLOSURE: Sidoxia Capital Management (SCM) and some of its clients own certain exchange traded funds, but at the time of publishing SCM had no direct position in JPM, or any other security referenced in this article. No information accessed through the Investing Caffeine (IC) website constitutes investment, financial, legal, tax or other advice nor is to be relied on in making an investment or other decision. Please read disclosure language on IC “Contact” page.
Equities Up, But Investors Queasy

The market may have recovered partially from its illness over the last two years, but investors are still queasy when it comes to equities. The market is up by more than +60% since the March 2009 lows despite the unemployment rate continuing to tick higher, reaching 10.2% in October. Even though equity markets have rebounded, recovering investors have flocked to the drug store with their prescriptions for bonds. Mark Dodson, CFA, from Hays Advisory published a telling chart that highlights the extreme aversion savers have shown towards stocks.

Source: Hays Advisory LLC (Thomson Reuters Datastream)
Dodson adds:
“Net new fund mutual fund flows favor bonds over stocks dramatically, so much so that flows are on the cusp of breaking into record territory, with the previous record occurring back in the doldrums of the 2002 bear market. Given nothing but the chart (above), we would never in a million years guess that the stock market has rallied 50-60% off the March lows. It looks more like what you would see right in the throes of a nasty stock market decline.”
Checking and savings data from the Federal Reserve Bank of Saint Louis further corroborates the mood of the general public as the nausea of the last two years has yet to wear off. The mountains of cash on the sidelines have the potential of fueling further gains under the right conditions (see also Dry Powder Piled High story).

As Dodson notes in the Hays Advisory note, not everything is doom and gloom when it comes to stocks. For one, insider purchases according to the Emergent Financial Gambill Ratio is the highest since the recent bear market came to a halt. This trend is important, because as Peter Lynch emphasizes, “There are many reasons insiders sell shares but only one reason they buy, they feel the price is going up.”
What’s more, the yield curve is the steepest it has been in the last 25 years. This opposing signal should provide comfort to those blue investors that cried through inverted yield curves (T-Bill yields higher than 10-Year Notes) that preceded the recessions of 2000 and 2008.
Equity investors are still feeling ill, but time will tell if a dose of bond selling and a prescription for “cash-into-stocks” will make the queasy patient feel better?
Wade W. Slome, CFA, CFP®
Plan. Invest. Prosper.
DISCLOSURE: No information accessed through the Investing Caffeine (IC) website constitutes investment, financial, legal, tax or other advice nor is to be relied on in making an investment or other decision. Please read disclosure language on IC “Contact” page.


