Posts tagged ‘Cash’
Cash Is Trash

The S&P 500 stock market index took a breather and ended its six-month winning streak, declining -4.8% for the month. Even after this brief pause, the S&P has registered a very respectable +14.7% gain for 2021, excluding dividends. Nevertheless, even though the major stock market indexes are roaming near all-time record highs, FUD remains rampant (Fear, Uncertainty, Doubt).
As the 10-Year Treasury Note yield has moved up to a still-paltry 1.5% level this month, the talking heads and peanut gallery bloggers are still fretting over the feared Federal Reserve looming “tapering”. More specifically, Jerome Powell, the Fed Chairman and the remainder of those on the FOMC (Federal Open Market Committee) are quickly approaching the decision to reduce monthly bond purchases (i.e., “tapering”). The so-called, quantitative easing (QE) program is currently running at about $120 billion per month, which was established with the aim to lower interest rates and stimulate the economy. Now that the COVID recovery is well on its way, the Fed is effectively trying to decrease the size of the current, unruly punch-keg down to the volume of a more manageable punch bowl.
Stated differently, even when the arguably overly-stimulative current bond buying slows or stops, the Federal Funds Rate is still effectively set at 0% today, a level that still offers plenty of accommodative fuel to our economy. Although interest rates will not stay at 0% forever, many people forget that between 2008 and 2015, the Fed Funds Rate stubbornly stayed sticky at 0% (i.e., a full punch bowl) for seven years, even without any spike in inflation.
Because the economy continues to improve, current consensus projections by economists show the first interest rate increase of this cycle (i.e., “liftoff”) to occur sometime in 2022 and subsequently climb to a still extraordinarily low level of 2.0% by 2024 (see “Dot Plot” below). For reference, the projected 2.0% figure would still be significantly below the 6.5% Fed Funds Rate we saw in the year 2000, the 5.3% in 2007, or the 2.4% in 2019. If history is any guide, under almost any scenario, Chairman Powell is very much a dove and is likely to tap the interest rate hike brakes very gently.

Low But Not the Lowest
In a world of generationally low interest rates, what I describe as our low bond yields here in the United States are actually relatively high, if you consider rates in other major industrialized economies and the trillions of negative-interest-rate bonds littered all over the rest of the world (see August’s article, $16.5 Trillion in Negative-Yielding Debt). Although our benchmark government rates are hovering around 1.5%, as you can see from the chart below, Germany is sitting considerably lower at -0.2%, Japan at 0.1%, France at 0.2%, and the United Kingdom at 1.0%.

Taper Schmaper
As with many government related policies, the Federal Reserve often gets too much credit for successes and too much blame for failures, as it relates to our economy. I have illustrated the extent of how globally interconnected our world of interest rates is, and one taper announcement is unlikely to reverse a four-decade disinflationary declining trend in interest rates.
Back in 2013, after of five years of quantitative easing (QE) that began in 2008, investors were terrified that interest rates were artificially being depressed by a money-printing Fed that had gone hog-wild in bond buying. At that time, pundits feared an imminent explosion higher in interest rates once the Fed began tapering. So, what happened after Federal Reserve Chairman Ben Bernanke broached the subject of tapering on June 19, 2013? The opposite occurred. Although 10-Year yields jumped 0.1% to 2.3% on the day of the announcement, interest rates spent the majority of the next six years declining to 1.6% in 2019, pre-COVID. As COVID began to spread globally, rates declined further to 0.95% in March of 2020, the day before Jerome Powell announced a fresh new round of quantitative easing (see chart below).
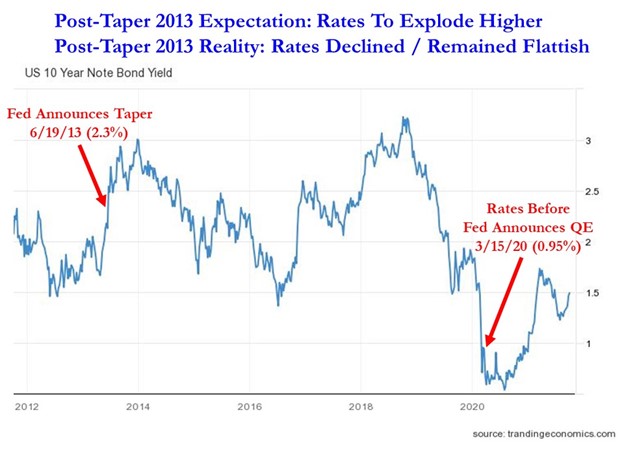
Obviously, every economic period is different from previous ones, and fearing to fall off the floor to lower interest rate levels is likely misplaced at such minimal current rates (1.5%). However, panicking over potential exploding interest rates, as in 2013 (which did not happen), again may not be the most rational behavior either.
What to Do?
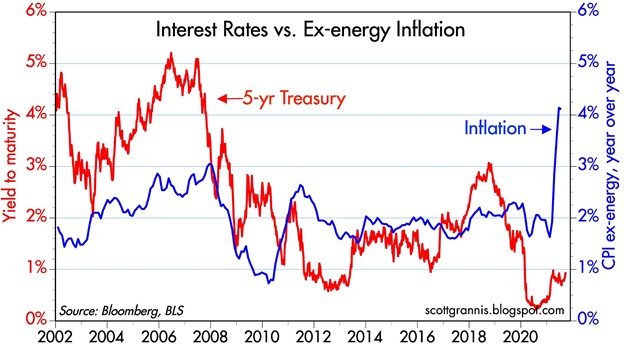
If interest rates are low, and inflation is high (see chart below), then what should you do with your money? Currently, if your money is sitting in cash, it is losing 4-5% in purchasing power due to inflation. If your money is sitting in the bank earning minimal interest, you are not going to be doing much better than that. Everybody’s time horizon and risk tolerance is different, but regardless of your age or anxiety level, you need to efficiently invest your money in a diversified portfolio to counter the insidious, degrading effects of inflation and generationally low interest rates. The “do-nothing” strategy will only turn your cash into trash, while eroding the value of your savings and retirement assets.

Wade W. Slome, CFA, CFP®
Plan. Invest. Prosper.
This article is an excerpt from a previously released Sidoxia Capital Management complimentary newsletter (October 1, 2021). Subscribe on the right side of the page for the complete text.
DISCLOSURE: Sidoxia Capital Management (SCM) and some of its clients hold positions in certain exchange traded funds (ETFs), but at the time of publishing had no direct position in any other security referenced in this article. No information accessed through the Investing Caffeine (IC) website constitutes investment, financial, legal, tax or other advice nor is to be relied on in making an investment or other decision. Please read disclosure language on IC Contact page.
Investors Perilously Wait for Goldilocks Market

Like Goldilocks searching for the “just right” porridge, chair size, and bed, so too are investors searching for the Goldilocks stock market that is not too hot or too cold. Many are aptly calling this the “most hated” bull market in recent history as Goldilock investors have decided to stay home rather than look for an investment prize. What many investors don’t quite realize is that waiting too long for an elusive, perfect Goldilocks scenario will only lead to your portfolio getting eaten by unhappy bears.
Waiting on the sidelines for a perfect buy signal is a hopeless endeavor (see also Getting Off the Market Timing Treadmill). The evidence for extreme risk aversion is extensive. From a corporate standpoint, it’s clear executives and board members have been scarred by the 2008-2009 financial crisis. Management teams have been quick to cut expenses and slow to invest and hire. And speaking of hiring, the post-crisis expansion has led to the slowest job recovery since World War II.
In the face of all the investor pessimism, the economy has been adding a few million jobs per year on average, resulting in a unemployment level below 5%; corporate profits at/near record levels; and trillions of dollars of cash piling up on corporate balance sheets. Rather than accelerate investments, companies have by and large chosen to spend that mountain of cash into trillions of rising dividends and share buybacks.
Risk aversion is evident at the individual level as well. Part of the explanation of why corporations have increased dividends to record levels is due to 76 million Baby Boomers approaching or entering retirement. Boomers need more income just as interest rates are rapidly approaching 0%, and in many cases negative interest rates, which effectively means they are earning $0 on their bank savings and losing to inflation.
Collecting fatter dividend checks from stocks actually sounds pretty attractive when individual investors are scared silly about geopolitics, terrorism, elections, Zika virus, and other horror story headlines of the day. Fortunately, it’s profits, interest rates, valuations, and contrarian sentiment indicators that control the stock market (see Follow the Stool), and not Fox, CNN, ABC, NBC, and internet bloggers (myself included).
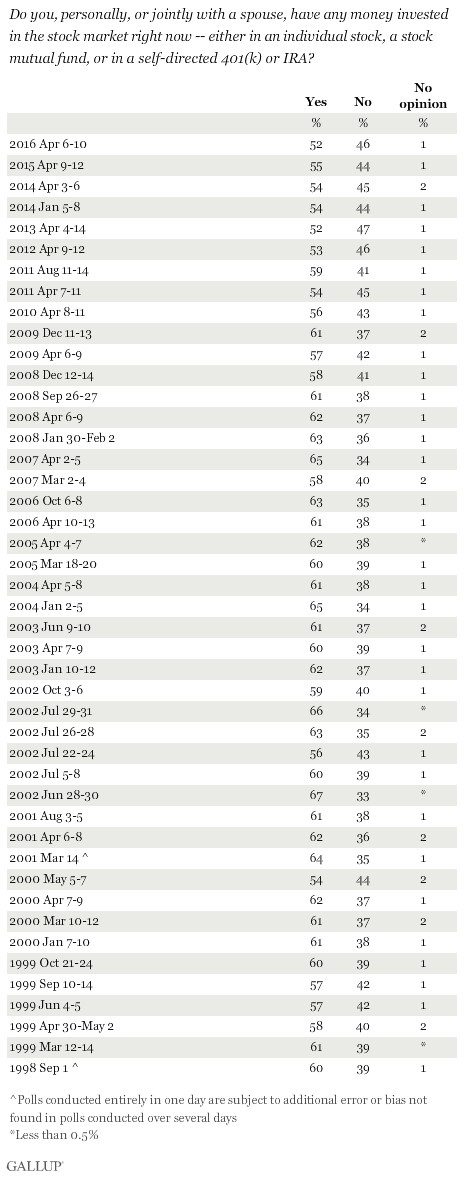
With all this scary news, no wonder investors are afraid to invest. Gallup conducted a survey earlier this year asking investors whether they were invested in the stock market. With the stock market at or near record all-time highs, stock ownership should be up…right? Wrong! The Gallup results showed stock ownership at its lowest level in 18 years, as long as results have been tabulated (1998).
In case you are still skeptical, we can point to other evidence of investor skepticism. If you believe, like I do, that actions speak louder than words, then the actions of individuals are screaming with risk aversion at the top of their lungs. In order to understand how frightened individuals are, all you have to do is look at the more than $8 trillion (with a “t”) of cash sitting in personal savings accounts earning nothing (see chart below).

Source: Calafia Beach Pundit
You can see from the chart above, the slope of cash accumulation accelerated at a steeper slope after the Great Recession. Besides allowing the mountain of cash to pile up, what else have investors been doing with their greenbacks? One thing for sure is individuals have been spooked into paying down debt (reducing leverage), as you can see from the chart below.

Source: Calafia Beach Pundit
As Warren Buffett reminds investors, it is best to “buy fear, and sell greed.” There is plenty of other evidence, including the examples above, that shows most average investors are destructive by doing the opposite…they buy greed, and sell fear. Sadly, sitting on the sidelines with cash stuffed under your mattress, earning nothing and losing to inflation, is not the optimal strategy for long-term wealth creation and preservation. Investors can continue waiting for Goldilock conditions, but unfortunately, history reminds us that market timing, sideline-sitters are likely to get eaten by the bears.

Wade W. Slome, CFA, CFP®
Plan. Invest. Prosper.
DISCLOSURE: Sidoxia Capital Management (SCM) and some of its clients hold positions in certain exchange traded funds (ETFs), but at the time of publishing had no direct position in any other security referenced in this article. No information accessed through the Investing Caffeine (IC) website constitutes investment, financial, legal, tax or other advice nor is to be relied on in making an investment or other decision. Please read disclosure language on IC Contact page.
Financial Markets Recharge with a Nap…Zzzzzz

This article is an excerpt from a previously released Sidoxia Capital Management complimentary newsletter (January 4, 2016). Subscribe on the right side of the page for the complete text.
Did you enjoy your New Year’s festivities? If you were like me and ate excessively and drank too much egg nog, you may have decided along the line to take a nap. It’s not a bad idea to recharge those batteries before implementing those New Year’s resolutions and jumping on the treadmill. That’s exactly what happened in the financial markets this year. After six consecutive years of positive returns in the Dow Jones Industrial Average (2009 – 2014), stock markets took a snooze in 2015, as measured by the S&P 500 and Dow, which were each down -0.7% and -2.2%, respectively. And bonds didn’t fare any better, evidenced by the -1.9% decline in the Aggregate Bond ETF (AGG), over the same time period. Given the deep-seated fears about the Federal Reserve potentially catapulting interest rates higher in 2015, investors effectively took a big yawn by barely nudging the 10-year Treasury Note yield higher by +0.1% from 2.2% to 2.3%.
Even though 2015 ended up being a quiet year overall, there were plenty of sweet dreams mixed in with scary nightmares during the year-long nap:
INVESTMENT SWEET DREAMS
Diamonds in the Rough: While 2015 stock prices were generally flat to down around the globe (Vanguard Total Word -4.2%), there was some sunshine and rainbows gleaming for a number of segments in the market. For example, handsome gains were achieved in the NASDAQ index (+5.7%); Biotech Index – BTK (+10.9%); Consumer Discretionary ETF – XLY (+8.3%); Health Care ETF – VHT (+5.8%); Information Technology ETF – VGT (+4.6%); along with numerous other investment areas.
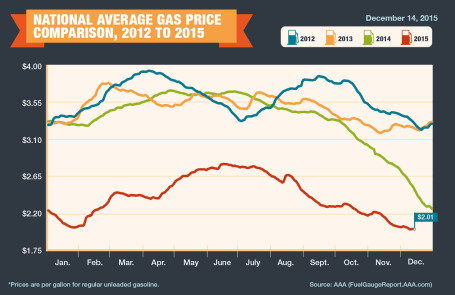
Fuel Fantasy Driven by Low Gas Prices: Gas prices averaged $2.01 per gallon nationally in December (see chart below), marking the lowest prices seen since 2009. Each penny in lower gas prices roughly equates to $1 billion in savings, which has strengthened consumers’ balance sheets and contributed to the multi-year economic expansion. Although these savings have partially gone to pay down personal debt, these gas reserves have also provided a financial tailwind for record auto sales (estimated 17.5million in 2015) and a slow but steady recovery in the housing market. The outlook for “lower-for-longer” oil prices is further supported by an expanding oil glut from new, upcoming Iranian supplies. Due to the lifting of economic sanctions related to the global nuclear deal, Iran is expected to deliver crude oil to an already over-supplied world energy market during the first quarter of 2016. Additionally, the removal of the 40-year ban on U.S. oil exports -could provide a near-term ceiling on energy prices as well.
Counting Cash Cows
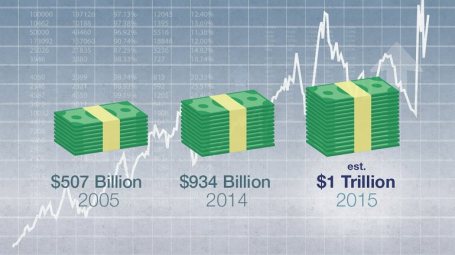
Catching some shut-eye after reading frightening 2015 headlines on the China slowdown, $96 billion Greek bailout/elections, and Paris/San Bernardino terrorist attacks forced some nervous investors to count sheep to fall asleep. However, long-term investors understand that underpinning this long-lived bull market are record revenues, profits, and cash flows. The record $4.7 trillion dollars in 2015 estimated mergers along with approximately $1 trillion in dividends and share buybacks (see chart below) is strong confirmation that investors should be concentrating on counting more cash cows than sheep, if they want to sleep comfortably.
INVESTMENT NIGHTMARES
Creepy Commodities: Putting aside the -30% collapse in WTI crude oil prices last year, commodity investors overall were exhausted in 2015. The -24% decline in the CRB Commodity Index and the -11% weakening in the Gold Index (GLD) was further proof that a strong U.S. dollar, coupled with stagnant global growth, caused investors a lot of tossing and turning. While bad for commodity exporting countries, the collapse in commodity prices will ultimately keep a lid on inflation and eventually become stimulative for those consumers suffering from lower standards of living.
Dollar Dread: The +25% spike in the value of the U.S. dollar over the last 18 months has made life tough for multinational companies. If your business received approximately 35-40% of their profits overseas and suddenly your goods cost 25% more than international competitors, you might grind your teeth in your sleep too. Monetary policies around the globe, including the European Union, will have an impact on the direction of future foreign exchange rates, but after a spike in the value of the dollar in early 2015, there are signs this scary move may now be stabilizing. Although multinationals are getting squeezed, now is the time for consumers to load up on cheap imports and take that bargain foreign vacation they have long been waiting for.
January has been a challenging month the last couple years, and inevitably there will be additional unknown turbulence ahead – the opening day of 2016 not being an exception (i.e., China slowdown concerns and Mideast tensions). However, given near record-low interest rates, record corporate profits, and accommodative central bank policies, the 2015 nap taken by global stock markets should supply the necessary energy to provide a lift to financial markets in the year ahead.

Wade W. Slome, CFA, CFP®
Plan. Invest. Prosper.
DISCLOSURE: Sidoxia Capital Management (SCM) and some of its clients hold positions VHT, AGG, and in certain exchange traded funds (ETFs), but at the time of publishing had no direct position VT, BTK, XLY, VGT, GLD, or in any other security referenced in this article. No information accessed through the Investing Caffeine (IC) website constitutes investment, financial, legal, tax or other advice nor is to be relied on in making an investment or other decision. Please read disclosure language on IC Contact page.
The Ski Slope Market: What’s Next in 2014?

This article is an excerpt from a previously released Sidoxia Capital Management complementary newsletter (January 2, 2014). Subscribe on the right side of the page for the complete text.
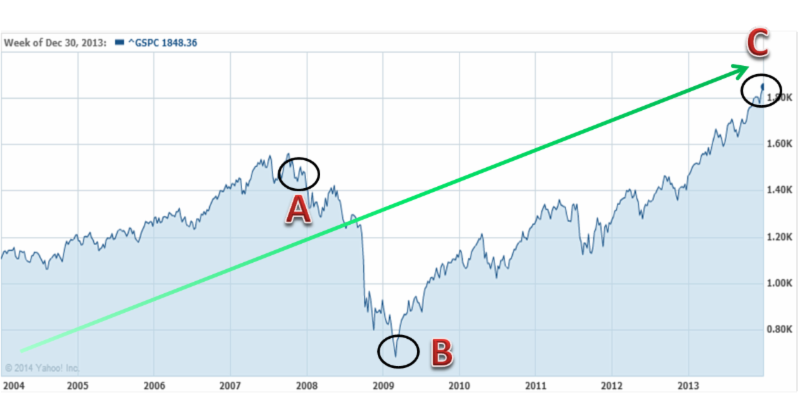
Skiing, or snowboarding in my case, is a lot like investing in the stock market…a bumpy ride. Snow, wind, ice, and moguls are common for seasoned skiers, and interest rate fluctuations, commodity price spikes, geopolitical turmoil, and -10% corrections are ordinary occurrences for veteran equity investors. However, in 2013 stock investors enjoyed pristine conditions, resulting in the best year for the Dow Jones Industrial Average since 1996. Individuals owning stocks witnessed their portfolios smoothly race to sunny, powder-like returns. More specifically, a December Santa Claus rally (S&P +2.4% for the month) capped off a spectacular year, which resulted in the S&P 500 Index soaring +30%, the NASDAQ Composite Index +38%, and the Dow +26%.
Despite the meteoric move in stocks this year, many observers missed the excitement of the equity ski slopes in exchange for lounging in the comfort of the deceivingly risky but warm lodge. In the lodge, these stock-frightened individuals sipped hot cocoa with wads of inflation-losing cash, bonds, and gold. As a result, these perceived safe assets have now become symbolic relics of the 2008-2009 financial crisis. In the short-run, the risk-averse coziness of the lodge may feel wonderful, but before the lounging observers can say “bull market,” the overpriced cocoas and holiday drinks will eat holes through retirement wallets and purses.
As you can see from the chart below, it is easy for the nervous lodge loungers to vividly remember the scary collapse of 2008-09 (point A to B). Surprisingly, many of these same skeptics are able to ignore or discount the explosive move of 2009-13 (point B to C). There’s another way of looking at this volatile time period. Had an investor fallen into a coma six years ago and then awakened today, an S&P portfolio would still have risen a respectable +26% (point A to C), plus more than +10% or so from dividends.
Turbulent Times on Back-Country Bond & Gold Trails
While stockholders have thoroughly enjoyed the recent climate, the 2013 weather conditions haven’t been as ideal for gold and bond investors. Gold investors felt less-than-precious in 2013 as they went flying off a cliff and broke a leg. In fact, the shiny metal suffered its worst performance in 30 years and underperformed stocks by a whopping -58%. With this year’s -28% loss (GLD), gold has underperformed stocks over the last six years, after including the impact of dividends.
Like gold traders, most bondholders were wounded in 2013 as well, but they did not get completely buried in an avalanche. Nevertheless, 2013 was a rocky ride overall for the bond haven hunters, as evidenced by the iShares Barclays Aggregate Bond composite (AGG), which fell -4%. As I’ve discussed previously, in Confessions of a Bond Hater, not all bonds are created equally, and actually many Sidoxia client portfolios include shorter-duration bonds, inflation protection bonds, convertible bonds, floating rate bonds, and high-yield bonds. Structured correctly, a thoughtfully constructed bond portfolio can outperform in a rising rate environment like we experienced in 2013.
Although bonds as a broad category may not currently offer great risk-reward characteristics, individuals in the mid-to-latter part of retirement need less volatility and more income – attributes bonds (not stocks) can offer. In other words, certain people are better served by snow-shoeing, or going on sleigh rides rather than risking a wipeout or tree collision on a downhill ski adventure. By owning the right types of bonds, your portfolio can avoid a severe investment crash.
Positive 2014 Outlook but Helmet Advised
With the NASDAQ index having more than tripled to over 4,176 from the 2009 lows, napping spectators are beginning to wake up and take notice. After money hemorrhaged out of the stock market for years (despite positive total returns in 2009, 2010, 2011, 2012), the fear trend began to reverse itself in 2013 and investment capital began returning to stock funds (see Here Comes the Dumb Money).
Adding fuel to the bull market fire, the International Monetary Fund (IMF) head Christine Lagarde recently signaled an increase in economic growth forecasts for the U.S. in 2014, thanks to an improving employment picture, successful Congressional budget negotiations, and actions by the Federal Reserve to unwind unprecedented monetary stimulus. If you consider the added factors of rising corporate profits, improving CEO confidence (e.g., Ford expansion), the shale energy boom, an expanding housing market, and our technology leadership position, one can paint a reasonably optimistic picture for the upcoming years.
Nonetheless, I am quick to remind investors and clients that the pace of the +30% appreciation in 2013 is unsustainable, and we are still overdue for a -10% correction in the major stock indexes.
The fundamental outlook for the economy may be improving, but there are still plenty of clouds on the horizon that could create a short-term market snowstorm. Domestically, we have the upcoming 2014 mid-term elections; debt ceiling negotiations; and a likely continuation of the Federal Reserve tapering program. Abroad, there are Iranian nuclear program talks; instability in Syria; meager and uncertain growth in Europe; and volatile economic climates in emerging markets like China, Brazil and India. After such a large advance this year, any one of these concerns (or some other unforeseen event) could provide an ample excuse to sell stocks and take some profits.
Since wipeouts are common, a protective helmet in the form of a valuation-oriented, globally diversified portfolio is strongly advised. For seasoned skiers and long-term investors, experiencing the never-ending ups and downs of skiing (investing) is a necessity to reach a desired destination. If you have trouble controlling your skis (money/emotions), it’s wise to seek the assistance of an experienced instructor (investment advisor) so your investment portfolio doesn’t crash.
Wade W. Slome, CFA, CFP®
Plan. Invest. Prosper.
DISCLOSURE: Sidoxia Capital Management (SCM) and some of its clients hold positions in certain exchange traded funds (ETFs), but at the time of publishing SCM had no direct position in AGG, GLD, F, or any other security referenced in this article. No information accessed through the Investing Caffeine (IC) website constitutes investment, financial, legal, tax or other advice nor is to be relied on in making an investment or other decision. Please read disclosure language on IC Contact page.
The Pleasure/Pain Principle

The financial crisis of 2008-2009 was painful, not to mention the Flash Crash of 2010; the Debt Ceiling / Credit Downgrade of 2011; and the never-ending European saga. Needless to say, these and other events have caused pain akin to burning one’s hand on the stove. This unpleasant effect has rubbed off on investors.
Admitting one has a problem is half the battle of conquering a challenge. A key challenge for many investors is understanding the crippling effects fear can have on personal investment decisions. While there are certainly investors who constantly see financial markets through rose-colored glasses (my glasses I argue are only slightly tinted), Nobel Prize winner Daniel Kahneman and his partner Amos Tversky understand the pain of losses can be twice as painful as the pleasure experienced through gains (see diagram below).

Source: Investopedia
Said a little differently, faced with sure gain, most investors are risk-averse, but faced with sure loss, investors prefer risk-taking. Don’t believe me? Well, let’s take a look at some of Kahneman and Tversky’s behavioral finance work on what they called “Prospect Theory” (1979) – the analysis of decisions made under various risk scenarios.
In one specific experiment, Kahneman and Tversky presented groups of subjects with a number of problems. One group of subjects was presented with this problem:
Problem #1: In addition to whatever you own, you have been given $1,000. You are now asked to choose between:
A. A sure gain of $500
B. A 50% change to gain $1,000 and a 50% chance to gain nothing.
Another group of subjects was presented with this problem:
Problem #2: In addition to whatever you own, you have been given $2,000. You are now asked to choose between:
A. A sure loss of $500
B. A 50% chance to lose $1,000 and a 50% chance to lose nothing.
In the first group, 84% of the respondents chose A and in the second group, 69% of the respondents chose B. Both problems are identical in terms of the net cash outcomes ($1,500 for Answer A, and 50% chance of $1,000 or $2,000 for Answer B). Nonetheless, due the different “loss phrasing” in each question, Answer A sounds more appealing in Question #1, and Answer B sounds more appealing in Question #2. The results are irrational, but investors have been known to be illogical too.
In practical trading terms, the application of “Prospect Theory” often manifests itself via the pain principle. Due to loss aversion, investors tend to cash in gains too early and fail to allow their winning stocks to run higher for a long enough period.
The framing of the Kahneman and Tversky’s questions is no different than the framing of political and economic issues by the various media outlets (see Pessimism Porn). Fear can generate advertising revenue and fear can also push investors into paralysis (see the equity fund flow data in Fund Flows Paradox).
Greed can sell in the financial markets too. The main sources of financial market greed have been primarily limited to bonds, cash, and gold. If you caught those trends early enough, you are happy as a clam, but like most things in life, nothing lasts forever. The same principle applies to financial markets, and over time, capital in today’s winners will slowly transition into today’s losers (i.e., tomorrow’s winners).
A healthy amount of fear is healthy, but correctly understanding the dynamics of the “Pleasure/Pain Principle” can turn those fearful tears into profitable pleasure.
Wade W. Slome, CFA, CFP®
Plan. Invest. Prosper.
DISCLOSURE: Sidoxia Capital Management (SCM) and some of its clients own certain exchange traded funds (including fixed income ETFs), but at the time of publishing SCM had no direct position in GLD, or any other security referenced in this article. No information accessed through the Investing Caffeine (IC) website constitutes investment, financial, legal, tax or other advice nor is to be relied on in making an investment or other decision. Please read disclosure language on IC “Contact” page.
Cash Security Blanket Turns Into Tourniquet
![]()
Article is an excerpt from Sidoxia Capital Management’s April 2012 newsletter. Subscribe on right side of page.
That warm safety blanket of cash that millions of Americans have clutched on to during the 2008-09 financial crisis; the 2010 “Flash Crash”; and the 2011 U.S. credit downgrade felt cozy during the bumpy ride we experienced over the last three years. Now with domestic stocks (S&P 500) up +12% in the first quarter of 2012, that same comfy blanket of CDs, money market, and checking accounts is switching into a painful tourniquet, cutting off the lucrative blood and oxygen supply to millions of Americans’ future retirement plans.
Earning next to nothing by stuffing your money under the mattress (0.7% average CD rate – Bankrate.com) isn’t going to make many financial dreams a reality. The truth of the matter is that due to inflation (running +2% to +3% per year), blanket holders are losing about -2% per year in the true value of their savings.
Your Choice: 3 Years or 107 years?
If you like to accumulate money, would you prefer doubling your money in 3 years or 107 years? Although the S&P 500 has more than doubled over the last three years, based on fund flows data and cash balances at the banks, apparently more individuals prefer waiting until the year 2119 (107 years from now) for their money to double – SEE CHART BELOW.

Obviously the massive underperformance of CDs cherry picks the time-period a bit, given the superb performance of stocks from 2009 – 2012 year-to-date. Over 1999-2012 stock performance hasn’t been as spectacular, but what we do know is that despite the lackluster performance of stocks over the last 12 years, corporate profits have about doubled in a similar timeframe, making equity prices that much more attractive relative to 1999.
With the economy and employment picture improving, some doomsday scenarios have temporarily been put on the backburner. As the recovery has gained some steam, many people are opening their bank statements with the painful realization, “I just made $31.49 on my checking maximizer account last year! Wow, how incredible…I can now go out and buy a half-tank of gas.” Never mind that healthcare premiums are exploding, food costs are skyrocketing, and that vacation you were planning is now out of reach. If you’re a mega-millionaire, perhaps you can make these stingy rates work for you, but for most of the other people, successful retirements will require more efficient use of their investment dollars. Or of course you can always work at Wal-Mart (WMT) as a greeter in your 80s.
Rationalizing with a Teen
Some people get it and some don’t. Trying to time the market, by getting in and out at the right times is a losing battle (see Getting Off the Market Timing Treadmill). Even the smartest professionals in the industry have little accuracy and cannot consistently predict the direction of the markets. Rationalizing the ups and downs of the financial markets is equivalent to rationalizing the actions of a teenager. Sometimes the outcomes are explainable, but most of the times they are not.
What an astute investor does know is that higher long-term returns come with higher volatility. So while the last four years have been a bumpy ride for investors, this is nothing new for an experienced investor who has studied the history of financial markets. There have been a dozen or so recessions since World War II, and we’ll have a dozen or so more over the next 50-60 years. Wars, banking crises, currency crises, and political turmoil have been a constant over history. Despite all these setbacks, the equity markets have climbed over +1,300% over the last 30 years or so. The smartest financial minds on the planet (e.g., the Ben Bernankes and Alan Greenspans of the world) haven’t been able to figure it out, so if they couldn’t do it, how is an average Joe supposed to be able to time the market? The answer is nobody can predict the direction of the market reliably.
As my clients and Investing Caffeine followers know, for those individuals with adequate savings and shorter time horizons, much of this conversation is irrelevant. However, based on our country’s low savings rate and the demographics of longer Baby Boomer life expectancies, most individuals can’t afford to stuff all their money under the mattress. As famous investor Sir John Templeton stated, “The only way to avoid mistakes is not to invest – which is the biggest mistake of all.” Earning 0.7% on your nest egg is difficult to call investing.
Ignoring the Experts
Why is the investing game so difficult? For starters, individuals are constantly bombarded by so-called experts through television, radio, and newspapers. Not only did Federal Reserve Chairmen Alan Greenspan and Ben Bernanke get the economy, financial markets, and housing markets wrong, the most powerful and smart financial institution CEOs were dead wrong as well. Look no further than Lehman Brothers (Dick Fuld), Citigroup Inc. (Chuck Prince), and American International Group (Martin Sullivan), which were believed to house some of the shrewdest executives – they too completely missed the financial crisis.
Rather than listening to shoddy predictions from pundits who have little to no investing experience, it makes more sense to listen to successful long-term investors who have survived multiple investment cycles and lived to tell the tale. Those people include the great fund manager Peter Lynch who said it is better to “assume the market is going nowhere and invest accordingly,” rather than try to time the market.
What You Hear
As the market has more than doubled over the last 37 months, here are some clouds of pessimism that these same shoddy economists, strategists, and analysts have described for investors:
* Europe and Greece’s impending fiscal domino collapse
* Excessive money printing at the Federal Reserve through quantitative easing and other programs
* Imminent government disintegration due to unresolved structural debts and deficits
* Elevated unemployment rates and pathetic job creation statistics
* Rigged high frequency trading and “Flash Crash”
* Credit downgrade and political turmoil in Washington
* Looming Chinese real estate bubble and subsequent hard economic landing
Unfortunately, many investors got sucked up in these ominous warnings and missed most, if not all, of the recent doubling in equity markets.
What You Don’t Hear
What you haven’t heard from the popular press are the following headlines:
* 10 consecutive quarters of GDP growth
* Record corporate profits and profit margins
* Equity valuations attractively priced below 50-year average (14.4 < 16.6 via Calafia Beach Pundit)
* Rising dividends with yields approaching 3%, if you consider recent bank announcements
* Record low interest rates and moderate inflation make earnings streams and dividends that much more valuable
* Four million new jobs created over the last three years
* S&P Smallcap near all-time highs (21 years); S&P Midcap index near all-time highs (20 years); NASDAQ is at 11-year highs; Dow Jones Industrials and S&P 500 near 4-year-highs.
* Record retail sales with a consumer that has reduced household debt

Source: Calafia Beach Pundit
Given the massive upward run in the stock market over the last few years (and a complacent short-term VIX reading of 15), stocks are ripe for a breather. With that said, I would advise any blanket holders to not get too comfy with that money decaying away in a CD, money market, or savings account. Waiting too long may turn that security blanket into a tourniquet – forcing investors to amputate a portion of their future retirement savings.
Wade W. Slome, CFA, CFP®
Plan. Invest. Prosper.
DISCLOSURE: Sidoxia Capital Management (SCM) and some of its clients own certain exchange traded funds and WMT, but at the time of publishing SCM had no direct position in C, AIG, RATE, Lehman Brothers, or any other security referenced in this article. No information accessed through the Investing Caffeine (IC) website constitutes investment, financial, legal, tax or other advice nor is to be relied on in making an investment or other decision. Please read disclosure language on IC “Contact” page.
M&A: Top or Bottom?

James Stewart at Smart Money recently wrote a piece attempting to debunk the consensus view, which holds the belief that increased mergers and acquisitions (M&A) activities is a leading indicator of positive market returns. There is no doubt, in the desert of positive news headlines, the bulls are searching for signs of an oasis to rescue them. Temporarily quenching the thirst of the bulls were $90 billion of proposed deals last week, including the hefty $40 billion hostile takeover offer of Potash Corp. (POT) by BHP Billiton Ltd. (BHP).
Is this uptick in deal announcements the sign of greener pastures, or is it what Stewart calls a “reverse indicator” of the market’s direction?
Stewart buttresses his argument by showing how record deal activity occurs at peaks of the market. For example, global M&A activity crested at $4.3 trillion in 2007, right before the market cratered in 2008. This peak can be compared to the previous trough of $1.3 trillion in M&A transactions in 2002, just as the economy was freshly recovering out of the recession. The trough to peak period for this M&A cycle lasted about five years (2002-2007), so I’m having a little trouble understanding how Stewart is claiming a peak is imminent after less than 1 year into the new M&A cycle (the recent M&A trough occurred in 2009 at $1.3 trillion)? Wouldn’t his analysis imply a gradual increase in deals until 2014? Well, for now, let’s just go with his rapid orgasm thesis and move onto his next points.
Stewart proceeds to rationalize the spate of new deal announcements with the following reasons:
- Higher Prices Perk Up Previously Reluctant Sellers: The general price rebound in the market from the nadir in March 2009 is one major contributing factor to why previously reluctant targets are now warming up to fresh overtures.
- Suitors More Comfortable: In 2009, buyers weren’t in the mood for paying top dollar for companies experiencing deteriorating fundamentals. Prices may be higher in 2010, but the Armageddon scenarios of early 2009 have momentarily been put on hold.
- Money Can’t Get Any Tighter: The cheap, loosey-goosy lending standards in the pre-2008 M&A golden era no longer exist, but conditions can’t get much worse than the log-jammed lending standards practiced in 2009.
The Real Reason for Deals Rising

Source: The Wall Street Journal
One word…cash. About $1.8 trillion of it is just piling up on the non-financial balance sheets of domestic companies (Financial Times). The tribes are getting restless with the obscene amounts of money earning 1% or less (read Steve Jobs: Gluttonous Hog article) and shareholders want to see more productive strategies applied to their capital. Frankly, I much prefer organic investment (e.g., R&D and marketing), share buybacks, and dividends over large destructive acquisitions any day. Just ask the executives at AOL/Time Warner, Mercedes Benz/Chrysler, and Sprint/Nextel how those large deals worked out for them. For some reason, many men like driving big macho trucks, just as many CEOs like controlling big companies.
One Reason to Buy and Many Reasons to Sell
I can’t disagree with James’s thesis that M&A markets get overheated near market tops, but I think there is a lot of room in deal announcements between the $90 billion in deals announced last week and the $4.3 trillion peak. I also agree that one good week of M&A announcements should not be extrapolated into eternity.
Worth noting as well, I believe there is a substantial difference in the financing market today versus the prior peak. In the BHP/Potash deal for example, BHP offered $40 billion in cash…not stock. BHP is putting its money where its mouth is, particularly its $18 billion in annual cash flow and its healthy balance sheet. Internal financing wasn’t the main priority in the mid-2000s, when companies (including private equity) were more cavalier with OPM (other people’s money), specifically with the endless pools of cheap bank financing.
Currently, companies have deep pockets, but very short arms, and as a result, companies have been very stingy with their capital. However, if we continue to see more internally financed cash deals, I will view that trend as a tremendously positive signal of longer-term fundamental confidence, a characteristic which was absent last year.
On the topic of insider buying, Peter Lynch pointed out “there is only one reason to buy and many reasons to sell” – the only real reason to purchase is the belief stock prices will move higher. Since the availability of cheap capital has been severely hampered, a wide swath of companies will have to rely on their own cash generation – not OPM. Since outside capital is scarce, the companies with cash flexibility will be more prudent in their M&A due diligence.
Overall, James Stewart may be right about the sustainability of M&A going into next year. However, in the short-run, as the gargantuan corporate cash piles get put to use through more M&A, and share buybacks, simple supply-demand economics indicate a shrinking equity base should bode well for market prices, all else equal. Uncertainty is available in large quantities right now, so time will tell if deal making will diminish into a market top, or gain momentum into a bull market. With all that cash sitting on the sidelines, my guess is we are closer to the trough of the M&A wave versus the top. If I’m wrong, don’t hold your breath for a Microsoft-Google (MSFT/GOOG) or Exxon-Chevron (XOM/CVX) merger anytime soon.
Read Full Smart Money M&A Article Here (Hat-Tip Josh Brown TRB)
Wade W. Slome, CFA, CFP®
Plan. Invest. Prosper.
*DISCLOSURE: Sidoxia Capital Management (SCM) and some of its clients own certain exchange traded funds, GOOG, and AAPL, but at the time of publishing SCM had no direct position in BHP, POT, MSFT, XOM, CVX, AOL/Time Warner (TWX), Mercedes Benz/Chrysler, and Sprint/Nextel (S) or any other security referenced in this article. No information accessed through the Investing Caffeine (IC) website constitutes investment, financial, legal, tax or other advice nor is to be relied on in making an investment or other decision. Please read disclosure language on IC “Contact” page.
Cash Pile Still Growing

Despite the sluggish economic reports, corporate cash piles have been expanding (see “Nest Egg” chart), thanks to aggressive cost-cutting, stabilization in GDP numbers, and meager capital programs. As part of stingy CFOs and executives controlling expenses, companies have been slow to hire despite an expected two quarters of economic growth. Job hiring is likely to remain scarce since capacity utilization and capital expenditures will probably remain priorities before job payrolls expand. It may be that jobs were the first area cut as the crisis unfolded and the last aspect to rebound in the economic expansion.

Source: The Wall Street Journal and Capital IQ
As the saying goes, “A bank only lends to those people whom do not need it.” Common knowledge has it that most jobs are created from small and medium sized businesses (SMBs). Unfortunately, the inaccessibility of loans for these SMBs has contributed to the lackluster job recovery. The hemorrhaging of jobs has slowed to a trickle, but sustainable recovery will eventually require new, substantive job creation. Rather than fund what appear to be risky loans to SMBs, banks are choosing to repair their weary balance sheets to reap the benefits of a very steep yield curve (borrowing at low short-term interest rates and lending at relatively high long-term interest rates). Bankers are not the only people stockpiling cash (see other article on cash). On the capital raise side, larger corporations have had more success in tapping the capital credit markets since bond issuance has been flowing nicely.

Source: Haver Analytics and Gluskin Sheff
As multi-national corporations continue to benefit from a relatively weak dollar and Wall Street persists to underestimate the trajectory of the U.S. corporate profit rebound, banks are hoarding more capital, which is leading to a larger cash pile. When will all this cash reflow back into the marketplace? The timing is unclear, but if the profitability and hoarding trends continue, the low-yielding cash piles spoiling on the balance sheets are likely to be released into the economy in the form of capital expenditures and rehiring. Job seekers will breathe a sigh of relief once these corporate wallets become too uncomfortably fat.
Wade W. Slome, CFA, CFP®
Plan. Invest. Prosper.
DISCLOSURE: Sidoxia Capital Management (SCM) and some of its clients own certain exchange traded funds (such as VFH), but at time of publishing had no direct position in any company mentioned in this article. No information accessed through the Investing Caffeine (IC) website constitutes investment, financial, legal, tax or other advice nor is to be relied on in making an investment or other decision. Please read disclosure language on IC “Contact” page.
Dry Powder Piled High

Money goes where it is treated best. Sometimes idle cash contributes to the inflation of speculative bubbles, while sometimes that same capital gets buried in a bunker out of fear. The mood-swing pendulum is constantly changing; however with the Federal Funds Rate at record lows, some of the bunker money is becoming impatient. With the S&P 500 up +60% since the March lows, investors are getting antsy to put some of the massive mounds of dry powder back to work – preferably in an investment vehicle returning more than 1%.
How much dry powder is sloshing around? A boatload. Bloomberg recently referenced data from ICI detailing money market accounts flush with a whopping $3.5 trillion. This elevated historical number comes despite a $439.5 million drop from the record highs experienced in January of this year.
From a broader perspective, if you include cash, money-market, and bank deposits, the nation’s cash hoard reached $9.55 trillion in September. What can $10 trillion dollars buy? According to Bloomberg, you could own the whole S&P 500 index, which registers in at a market capitalization price tag of about $9.39 trillion. The article further puts this measure in context:
“Since 1999, so-called money at zero maturity has on average accounted for 62 percent of the stock index’s worth. … Before the collapse of New York-based Lehman Brothers Holdings Inc. last year, the amount of cash never exceeded the value of U.S. equities.”
Cash levels remain high, but the 60% bounce from the March lows is slowly siphoning some money away. According to ICI data, $15.8 billion has been added to domestic-equity funds since March. Trigger shy fund managers, fearful of the macro-economic headlines, have been slow to put all their cash to work, as well. Jeffrey Saut, chief investment strategist at Raymond James & Associates adds “Many of the fund managers I talk to that have missed this rally or underplayed this rally are sitting with way too much cash.”
With so much cash on the sidelines, what do valuations look like since the March rebound?
“The index [S&P 500] trades for 2.18 times book value, or assets minus liabilities, 33 percent below its 15-year average, data compiled by Bloomberg show. The S&P 500 was never valued below 2 times net assets until the collapse of Lehman, data starting in 1994 show. The index fetches 1.15 times sales, 22 percent less than its average since 1993.”
On a trailing P/E basis (19x’s) the market is not cheap, but the Q4 earnings comparisons with last year are ridiculously easy and companies should be able to trip over expectations. The proof in the pudding comes in 2010 when growth in earnings is projected to come in at +34% (Source: Standard & Poor’s), which translates into a much more attractive multiple of 14 x’s earnings. Revenue growth is the missing ingredient that everyone is looking for – merely chopping an expense path to +34% earnings growth will be a challenging endeavor for corporate America.
Growth outside the U.S. has been the most dynamic and asset flows have followed. With some emerging markets up over +100% this year, the sustainability will ultimately depend on the shape of the global earnings recovery. At the end of the day, with piles of dry powder on the sidelines earning next to nothing, eventually that capital will operate as productive fuel to drive prices higher in the areas it is treated best.
Read the Complete Bloomberg Article Here.
Wade W. Slome, CFA, CFP®
Plan. Invest. Prosper.
Mountains of Cash Starting to Trickle Back

The month of July was an interesting month because investors opened their 401k and investment statements for the first time in a long while to notice an unfamiliar trend… account values were actually up. Like a child that has burnt their hand on a stove, the wounds and memories are still too fresh – more time must pass before investors decide to get back into the market in full force.
As you can see from the charts below, as investors globally panicked throughout 2008 and early 2009, money earning next to nothing in CDs and Money Market accounts was stuffed under the mattress in droves. The fear factor of last fall has caused current liquid assets to stand near 10 year highs at a level near 120% of the S&P 500 total market capitalization (Thomson Reuters) and at more extreme levels last fall if you just look at Money Market assets (bottom chart) . Now that the Armageddon scenario has been temporarily put to rest, we’re starting to see some of that cash to trickle back into the market. The silver lining is that there is still plenty of dry powder left to drive the market higher – not overnight, but once sustained confidence returns. If the earnings outlook continues to improve, come the beginning of October when 3rd quarter statements arrive in the mail, the pain of not being in the market will overwhelm the fear of burning another hand on the stove like in 2008.

It is funny how the sentiment pendulum can swing from the grips of despair a year ago. There is still headroom for the market to climb higher before the pendulum swings too far in the bullish direction – if you don’t believe me just look on the horizon at the mountain of cash.

Source: SentimenTrader.com (Fall 2008)
Wade W. Slome, CFA, CFP®
Plan. Invest. Prosper.


