Posts tagged ‘10-year Treasury’
Yield Starving Foreigners Go Muni Hunting

In the current cold, barren, negative interest rate environment, foreign investors are getting hungry and desperate as they hunt for yield. In the hopes of kick-starting economic activity around the globe, central bankers are taking the drastic measure of establishing negative interest rate policies. This unusual endeavor is pressing international investors to chase yield, no matter how small, wherever they can find it.
One of those areas in which foreigners are hunting for yield is the U.S. municipal bond market (see FT article). On the surface, this sounds ludicrous. Why would an outsider living in Germany or Japan invest in a U.S. municipal bond that yields a paltry rate that’s less than 1.7%, especially considering those investors will not benefit from the tax-free income advantages offered to Americans?
As strange as it sounds, Natalie Cohen, Wells Fargo’s head of municipal research correctly pointed out this pursuit for municipal bond yield across continents boils down to simple math. “Even if [foreign investors] are not subject to the US tax code, a plus two is better than a minus one,” Cohen notes.
Although foreign investment in the $3.7 trillion municipal bond market is relatively small, the rapidly rising appetite for munis is clearly evident, as shown in the chart below.
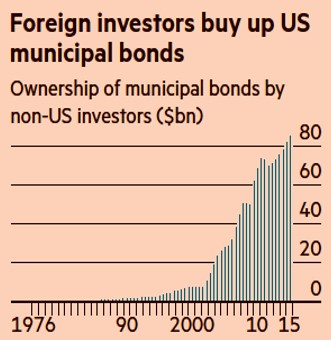
Source: The Financial Times
With our country’s crumbling roads and bridges, these ever-increasing piles of foreign cash pouring into our municipal bonds are helping fund a broad array of U.S. infrastructure projects. Given the election season is upon us, this issue may gain heightened attention. Both likely-presidential candidates are highlighting the need for infrastructure investment as part of their platforms, and the NIRP (negative interest rate policies) agenda of international central banks may make these municipal infrastructure dreams a reality.
We Americans are no stranger to the idea of borrowing money from foreigners. In fact, the Chinese own about $1.3 trillion of our Treasury bonds. This is all fine and dandy as long as the international appetite for lending us money remains healthy. If our city, state, and federal governments become too addicted to the Chinese, Europeans, and Japanese loans, financial risks can/will grow to unmanageable levels. Guess what happens once our borrowings swell to a level that forces foreigners to question our ability of repaying their debt? Interest rates will accelerate upwards, our interest payments will balloon, and our deficits will widen. The consequences of these unfavorable outcomes will be devastating budget cuts and/or tax increases.
For the time being, we will gladly accept the charitable donations of foreign investors to help lower funding costs for our sorely needed infrastructure projects. Fortunately, for now fiscal sanity is prevailing. The post financial crisis political environment has scared municipalities from borrowing too much, as explained here by the FT:
“For local and state politicians grappling with pension reforms, new healthcare programs and — in Alaska, Texas and Oklahoma — a drag on finances from lower energy prices, the looming presidential election is also diminishing the appeal of [municipal debt] issuance.”
In a near-zero/negative rate environment, there certainly will be incentives for irresponsible governments and corporations to extend themselves too far with cheap debt. However, in the short-run, as starving foreigners hunt for yield in the U.S. municipal bond market, Americans have the opportunity of exploiting this foreign generosity for the benefit our country’s long-term infrastructure.

Wade W. Slome, CFA, CFP®
Plan. Invest. Prosper.
DISCLOSURE: Sidoxia Capital Management (SCM) and some of its clients hold positions in certain exchange traded funds (ETFs), but at the time of publishing had no direct position in any other security referenced in this article. No information accessed through the Investing Caffeine (IC) website constitutes investment, financial, legal, tax or other advice nor is to be relied on in making an investment or other decision. Please read disclosure language on IC Contact page.
Flat Pancakes & Dividends

Over the last 18 months, stock prices have been flat as a pancake. Absent a few brief China and recessionary scares, the Dow Jones Industrial Average index has spent most of 2015 and 2016 trading between the relatively tight levels of 17,000 – 18,000. Record corporate profits and faster growth than other developed and developing markets have created a tug-of-war with countervailing factors. A strong dollar, reversal in monetary policy, geopolitical turmoil, and volatile commodity markets have produced a neutralizing struggle among corporate executives with deep financial pockets and short arms. In this environment, share buybacks, stable profit margins, and growing dividends have taken precedence over accelerated capital investments and expensive new-hires.
With flat stock prices and interest rates at unprecedented low levels, it’s during times like these that stock investors really appreciate the appetizing flavor of stable, growing dividends. To this day, I still find it almost impossible to fathom how investors are burning money by irrationally speculating in $7 trillion in negative interest rate bonds (see Retire at Age 90).
Historically there are very few periods in which stock dividend yields have exceeded bond yields (2.1% S&P yield vs. 1.8% 10-Year Treasury yield). As I showed in my Dividend Floodgates article, for roughly 50 years (1960 – 2010), the yield on the 10-Year Treasury Notes have exceeded the dividend yield on stocks (S&P 500) – that longstanding trend does not hold today.
In the face of the competitive stock market, several trends are contributing to the upward trajectory in dividend payments (see chart below).
#1.) Corporate profits (ex-Energy) are growing and at/near record levels. Earnings are critical in providing fertile ground for dividend growth.
#2.) Demographics, plain and simple. As 76 million Baby Boomers transition into retirement, their income needs escalate. These shareholders whine and complain to corporate executives to share the spoils and increase dividends.
#3.) Low interest rates and disinflation are shrinking the available pool of income generating assets. As I pointed out above, when trillions of dollars are getting thrown into negative yielding investments, many investors are flocking to alternative income-generating assets…like dividend paying stocks.
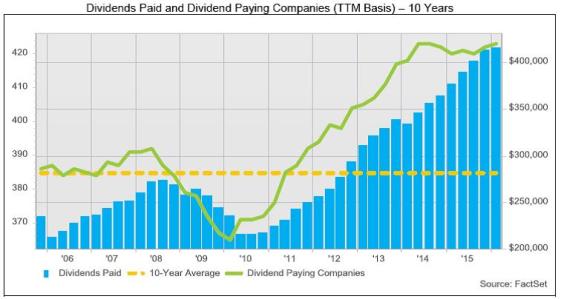
Source: FactSet
The Power of Dividends (Case Studies)
Most people don’t realize it, but over the last 100 years, dividends have accounted for approximately 40% of stocks’ total return as measured by the S&P 500. In other words, using history as a guide, if you initially invested in a stock XYZ at $100 that appreciated in value to $160 (+60%) 10 years later, that stock on average would have supplied an incremental $40 in dividends (40%) over that period, creating a total return of 100%.
Rather than using a hypothetical example, here are a few stock specific illustrations that highlight the amazing power of compounding dividend growth rates. Here are two “Dividend Aristocrats” (stocks that have increased dividends for at least 25 consecutive years):
- PepsiCo Inc (PEP): PepsiCo has increased its dividend for an astonishing 44 consecutive years. Today, the dividend yield is 2.9% based on the current share price. But had you purchased the stock in June 1972 for $1.60 per share (split-adjusted), you would currently be earning a +188% dividend yield ($3.01 dividend / $1.60 purchase price), which doesn’t even account for the +6,460% increase in the share price ($104.96 per share today from $1.60 in 1972). Over that 44 year period, the split-adjusted dividend has increased from about $0.02 per share to an annualized $3.01 dividend per share today, which equates to a mind-blowing +16,153% increase. On top of the $103 price appreciation, assuming a conservative 5% dividend reinvestment rate, my estimates show investors would have received more than $60 in reinvested dividends, making the total return that much more gargantuan.
- Emerson Electric Co (EMR): Emerson Electric too has had an even more incredible streak of dividend increases, which has now extended for 59 consecutive years. Emerson currently yields a respectable 3.6% rate, but if you purchased the stock in June 1972 for $3.73 per share (split-adjusted), you would currently be earning a +51% dividend yield ($1.92 dividend / $3.73 purchase price), which doesn’t even consider the +1,423% increase in the share price ($53.31 per share today from $3.73 in 1972).
There is never a shortage of FUD (Fear, Uncertainty, and Doubt), which has kept stock prices flat as a pancake over the last couple of years, but market leading franchise companies with stable/increasing dividends do not disappear during challenging times. Record profits (ex-energy), demographics, and a scarcity of income-generating investment alternatives are all contributing factors to the increased appetite for dividends. If you want to sweeten those flat pancakes, do yourself a favor and pour some quality dividend syrup over your investment portfolio.
Wade W. Slome, CFA, CFP®
Plan. Invest. Prosper.
DISCLOSURE: Sidoxia Capital Management (SCM) and some of its clients hold positions in certain exchange traded funds (ETFs) and PEP, but at the time of publishing had no direct position in EMR or any other security referenced in this article. No information accessed through the Investing Caffeine (IC) website constitutes investment, financial, legal, tax or other advice nor is to be relied on in making an investment or other decision. Please read disclosure language on IC Contact page.
Going Shopping: Chicken vs. Beef

The headlines haven’t been very rosy over the last week, but when is that ever not the case? Simply put, gloom and doom sells. The Chinese stock market is collapsing; the Yuan is plummeting; there are rising tensions in the Middle East; terrorism is rising to the fore; and commodity prices are falling apart at the seams. This is only a partial snapshot of course, and does not paint a complete or accurate picture. Near record-low interest rates; record corporate profits (outside of energy); record-low oil prices; unprecedented accommodative central bank policies; and attractive valuations are but a few of the positive, countervailing factors that rarely surface through the media outlets.
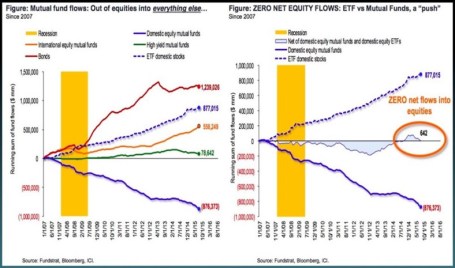
At the end of the day, smart long-term investors understand investing in financial markets is a lot like grocery store shopping. Similarly to stocks and bonds, prices at the supermarket fluctuate daily. Whether you’re comparing beef (bonds) and chicken (stocks) prices in the meat department (stock market), or apple (real estate) and orange (commodities) prices in the produce department (global financial markets), ultimately, shrewd shoppers eventually migrate towards purchasing the best values. Since the onset of the 2008-2009 financial crisis, risk aversion has dominated over value-based prudence as evidenced by investors flocking towards the perceived safety of cash, Treasury bonds, and other fixed income securities that are expensively priced near record highs. As you can see from the chart below, investors poured $1.2 trillion into bonds and effectively $0 into stocks. Consumers may still be eating lots of steaks (bonds) currently priced at $6.08/lb while chicken (stocks) is at $1.48/lb (see U.S. Department of Labor Data – Nov. 2015), but at some point, risk aversion will abate, and consumers will adjust their preferences towards the bargain product.
Some Shoppers Still Buying Chicken
While the general public may have missed the massive bull market in stocks, astute corporate executives and investment managers took advantage of the equity bargains in recent years, as seen by stock prices tripling from the March 2009 lows. As corporate profits and margins have marched to record levels, CEOs/CFOs put their money where their mouths are by investing trillions of dollars into share buybacks and mergers & acquisitions transactions.
Despite the advance in the multi-year bull market, with the recent sell-off, panic has once again dominated rational thinking. We see this rare phenomenon (a few times over the last century) manifest itself through a stock market dividend yield that exceeds the yield on Treasury bonds (2.2% S&P 500 vs 2.1% 10-Year Treasury). But if we are once again comparing beef vs. chicken prices (bonds vs stocks), the 6% earnings yield on stocks (i.e., Inverse P/E ratio or E/P) now looks even more compelling relative to the 2% yield on bonds. For example, the iShares Core U.S. Aggregate Bond ETF (AGG) is currently yielding a meager 2.3%.
For a general overview, Scott Grannis at Calafia Beach Pundit summarizes the grocery store flyer of investment options below:
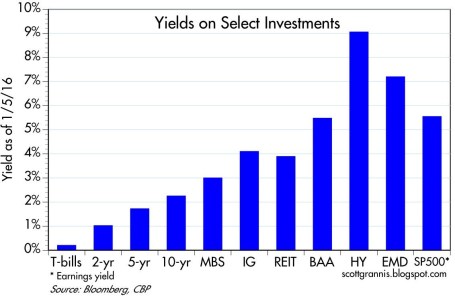
While these yield relationships can and will certainly change under various economic scenarios, there are no concrete signs of an impending recession. The recent employment data of 292,000 new jobs added during December (above the 200,000 estimate) is verification that the economy is not falling off a cliff into recession (see chart below). As I’ve written in the past, the positively-sloped yield curve also bolsters the case for an expansionary economy.

Source: Calafia Beach Pundit
While it’s true the Chinese economy is slowing, its rate is still growing at multiples of the U.S. economy. As a communist country liberalizes currency and stock market capital controls (i.e., adds/removes circuit breakers), and also attempts to migrate the economy from export-driven growth to consumer-driven expansion, periodic bumps and bruises should surprise nobody. With that said, China’s economy is slowly moving in the right direction and the government will continue to implement policies and programs to stimulate growth (see China Leaders Flag More Stimulus).
As we have recently experienced another China-driven correction in the stock market, and the U.S. economic expansion matures, equity investors must realize volatility is the price of admission for earning higher long-term returns. However, rather than panicking from fear-driven headlines, it’s times like these that should remind you to sharpen your shopping list pencil. You want to prudently allocate your investment dollars when deciding whether now’s the time to buy chicken (6% yield) or beef (2% yield).
Wade W. Slome, CFA, CFP®
Plan. Invest. Prosper.
DISCLOSURE: Sidoxia Capital Management (SCM) and some of its clients hold positions in certain exchange traded funds (ETFs) including AGG, but at the time of publishing had no direct position in any other security referenced in this article. No information accessed through the Investing Caffeine (IC) website constitutes investment, financial, legal, tax or other advice nor is to be relied on in making an investment or other decision. Please read disclosure language on IC Contact page.
Is Good News, Bad News?

The tug-of-war is officially on as investors try to decipher whether good news is good or bad for the stock market? On the surface, the monthly January jobs report released by the Bureau of Labor Statistics (BLS) appeared to be welcomed, positive data. Total jobs added for the month tallied +257,000 (above the Bloomberg consensus of +230,000) and the unemployment rate registered 5.7% thanks to the labor participation rate swelling during the month (see chart below). More specifically, the number of people looking for a job exceeded one million, which is the largest pool of job seekers since 2000.
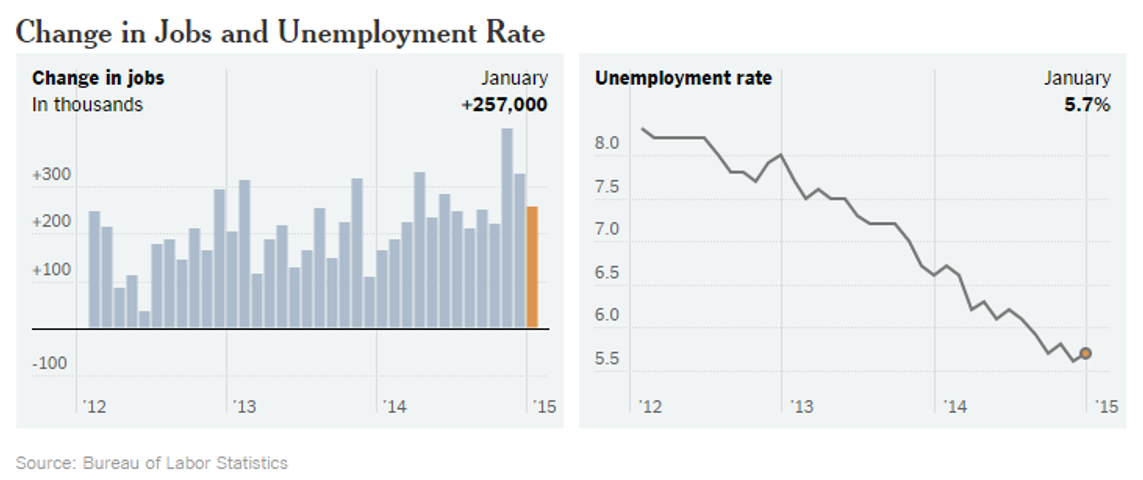
Source: BLS via New York Times
Initially the reception by stocks to the jobs numbers was perceived positively as the Dow Jones Industrial index climbed more than 70 points on Friday. Upon further digestion, investors began to fear an overheated employment market could lead to an earlier than anticipated interest rate hike by the Federal Reserve, which explains the sell-off in bonds. The yield on the 10-Year Treasury proceeded to spike by +0.13% before settling around 1.94% – that yield compares to a recent low of 1.65% reached last week. The initial euphoric stock leap eventually changed direction with the Dow producing a -180 point downward reversal, before the Dow ended the day down -62 points for the session.
Crude Confidence?
The same confusion circling the good jobs numbers has also been circulating around lower oil prices, which on the surface should be extremely positive for the economy, considering consumer spending accounts for roughly 70% of our country’s economic output. Lower gasoline prices and heating bills means more discretionary spending in the pockets of consumers, which should translate into more economic activity. Furthermore, it comes as no surprise to me that oil is both figuratively and literally the lubricant for moving goods around our country and abroad, as evidenced by the Dow Jones Transportation index that has handily outperformed the S&P 500 index over the last 18 months. While this may truly be the case, many journalists, strategists, economists, and analysts are nevertheless talking about the harmful deflationary impacts of declining oil prices. Rather than being viewed as a stimulative lubricant to the economy, many of these so-called pundits point to low oil prices as a sign of weak global activity and an omen of worse things to come.
This begs the question, as I previously explored a few years ago (see Good News=Good News?), is it possible that good news can actually be good news? Is it possible that lower energy costs for oil importing countries could really be stimulative for the global economy, especially in regions like Europe and Japan, which have been in a decade-long funk? Is it possible that healthier economies benefiting from substantial job creation can cause a stingy, nervous, and scarred corporate boardrooms to finally open up their wallets to invest more significantly?
Interest Rate Doom May Be Boom?
Quite frankly, all the incessant, never-ending discussions about an impending financial market Armageddon due to a potential single 0.25% basis point rate hike seem a little hyperbolic. Could I be naively whistling past the graveyard? From my perspective, although it is a foregone conclusion the Fed will have to increase interest rates above 0%, this is nothing new (I’m really putting my neck out there on this projection). Could this cause some volatility when it finally happens…of course. Just look at what happened to financial markets when former Federal Reserve Chairman Ben Bernanke merely threatened investors with a wind-down of quantitative easing (QE) in 2013 and investors had a taper tantrum. Sure, stocks got hit by about -5% at the time, but now the S&P 500 index has catapulted higher by more than +25%.
Looking at how stocks react in previous rate hike cycles is another constructive exercise. The aggressive +2.50% in rate hikes by former Fed Chair Alan Greenspan in 1995 may prove to be a good proxy (see also 1994 Bond Repeat?). After suffering about a -10% correction early in 1994, stocks rallied in the back-half to end the year at roughly flat.
And before we officially declare the end of the world over a single 0.25% hike, let’s not forget that the last rate hike cycle (2004 – 2006) took two and a half years and 17 increases in the targeted Federal Funds rate (1.00% to 5.25%). Before the rate increases finally broke the stock market’s back, the bull market moved about another +40% higher…not too shabby.
Lastly, before writing the obituary of this bull market, it’s worth noting the yield curve has been an incredible leading indicator and currently this gauge is showing zero warnings of any dark clouds approaching on the horizon (see chart below). As a matter of fact, over the last 50 years or so, the yield curve has turned negative (or near 0%) before every recession.
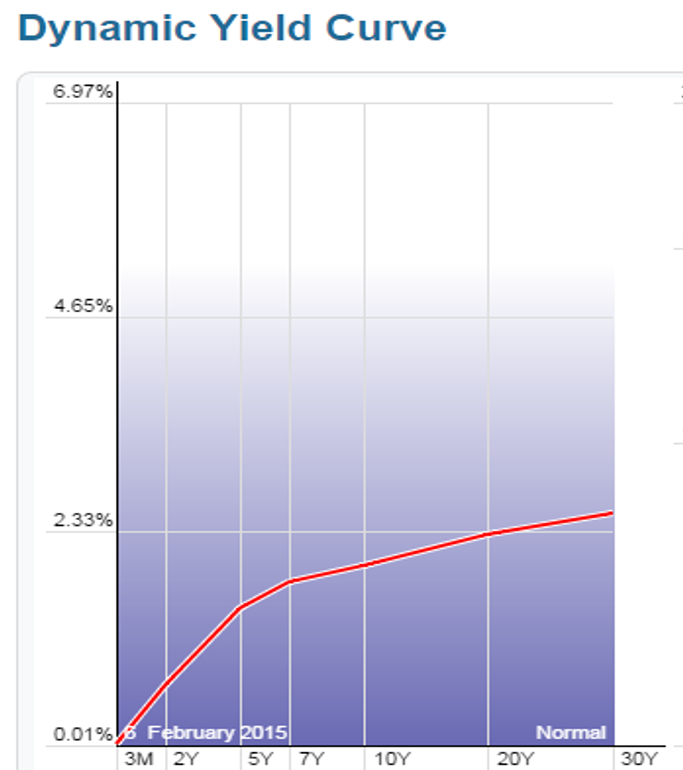
Source: StockCharts.com
As the chart above shows, the yield curve remains very sloped despite modest flattening in recent quarters.
While many skeptics are having difficulty accepting the jobs data and declining oil prices as good news because of rate hike fears, history shows us this position could be very misguided. Perhaps, once again, this time around good news may actually be good news.

Wade W. Slome, CFA, CFP®
Plan. Invest. Prosper.
DISCLOSURE: Sidoxia Capital Management (SCM) and some of its clients hold positions in certain exchange traded funds (ETFs), but at the time of publishing SCM had no direct position in any other security referenced in this article. No information accessed through the Investing Caffeine (IC) website constitutes investment, financial, legal, tax or other advice nor is to be relied on in making an investment or other decision. Please read disclosure language on IC Contact page.
Santa and the Rate-Hike Boogeyman

Boo! … Rates are about to go up. Or are they? We’re in the fourth decade of a declining interest rate environment (see Don’t be a Fool), but every time the Federal Reserve Chairman speaks or monetary policies are discussed, investors nervously look over their shoulder or under their bed for the “Rate Hike Boogeyman.” While this nail-biting mentality has resulted in lost sleep for many, this mindset has also unfortunately led to a horrible forecasting batting average for economists. Santa and many equity investors have ignored the rate noise and have been singing Ho Ho Ho as stock prices hover near record highs.
A recent Deutsche Bank report describes the prognostication challenges here:
i.) For the last 10 years, professional forecasters have consistently been wrong on their predictions of rising interest rates.
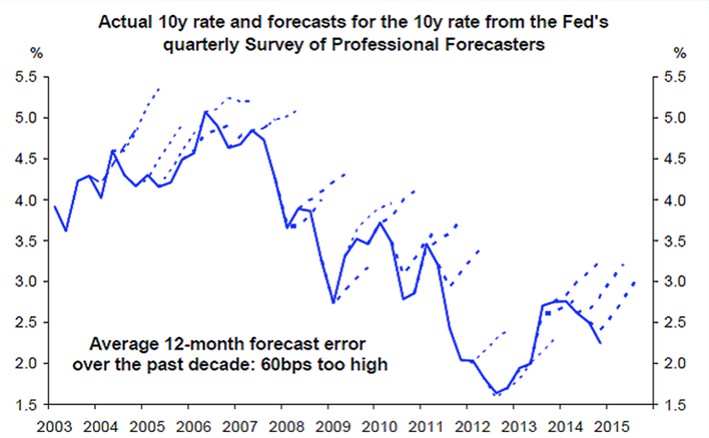
Source: Deutsche Bank via Vox
ii.) For the last five years, investors haven’t fared any better. As you can see, they too have been continually wrong about their expectations for rising interest rates.
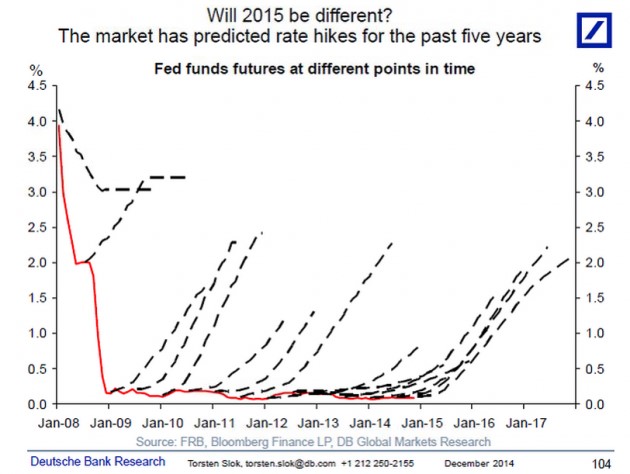
Source: Deutsche Bank via Vox
I’m the first to admit that rates have remained “lower for longer” than I guessed, but unlike many, I do not pretend to predict the exact timing of future rate increases. I strongly believe inevitable interest rate rises are not a matter of “if” but rather “when”. However, trying to forecast the timing of a rate increase can be a fool’s errand. Japan is a great case in point. If you take a look at the country’s interest rates on their long-term 10-year government bonds (see chart below), the yields have also been declining over the last quarter century. While the yield on the 10-Year U.S. Treasury Note is near all-time historic lows at 2.18%, that rate pales in comparison to the current 10-Year Japanese Bond which is yielding a minuscule 0.36%. While here in the states our long-term rates only briefly pierced below the 2% threshold, as you can see, Japanese rates have remained below 2% for a jaw-dropping duration of about 15 years.
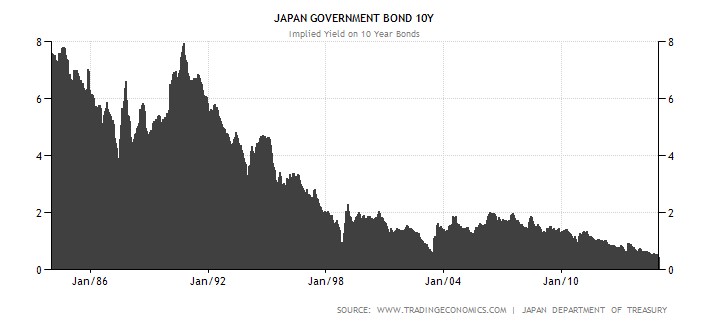
Source: TradingEconomics.com
There are plenty of reasons to explain the differences in the economic situation of the U.S. and Japan (see Japan Lost Decades), but despite the loose monetary policies of global central banks, history has proven that interest rates and inflation can remain stubbornly low for longer than expected.
The current pundit thinking has Federal Reserve Chairwoman Yellen leading the brigade towards a rate hike during mid-calendar 2015. Even if the forecasters finally get the interest rate right for once, the end-outcome is not going to be catastrophic for equity markets. One need look no further than 1994 when Federal Reserve Chairman Greenspan increased the benchmark federal funds rate by a hefty +2.5%. (see 1994 Bond Repeat?). Rather than widespread financial carnage in the equity markets, the S&P 500 finished roughly flat in 1994 and resumed the decade-long bull market run in the following year.
Currently 15 of the 17 Fed policy makers see 2015 median short-term rates settling at 1.125% from the current level of 0-0.25%. This hardly qualifies as interest rate Armageddon. With a highly transparent and dovish Janet Yellen at the helm, I feel perfectly comfortable the markets can digest the inevitable Fed rate hikes. Will (could) there be volatility around changes in Fed monetary policy during 2015? Certainly – no different than we experienced during the “taper tantrum” response to Chairman Ben Bernanke’s rate rise threats in 2013 (see Fed Fatigue).
As 2014 comes to an end, Santa has wrapped investor portfolios with a generous bow of returns in the fifth year of this historic bull market. Not everyone, however, has been on Santa’s “nice” list. Regrettably, many sideliners have received no presents because they incorrectly assessed the elimination impact of Quantitative Easing (QE). If you prefer presents over a lump of coal in your stocking, it will be in your best interest to ignore the Rate Hike Boogeyman and jump on Santa’s sleigh.
Wade W. Slome, CFA, CFP®
Plan. Invest. Prosper.
DISCLOSURE: Sidoxia Capital Management (SCM) and some of its clients own a range of positions, including certain exchange traded fund positions, but at the time of publishing SCM had no direct position in DB or any other security referenced in this article. No information accessed through the Investing Caffeine (IC) website constitutes investment, financial, legal, tax or other advice nor is to be relied on in making an investment or other decision. Please read disclosure language on IC Contact page.
Perception vs. Reality: Interest Rates & the Economy

There is a difference between perception and reality, especially as it relates to the Federal Reserve, the economy, and interest rates.
Perception: The common perception reflects a belief that Quantitative Easing (QE) – the Federal Reserve’s bond buying program – has artificially stimulated the economy and financial markets through lower interest rates. The widespread thinking follows that an end to tapering of QE will lead to a crash in the economy and financial markets.
Reality: As the chart below indicates, interest rates have risen during each round of QE (i.e., QE1/QE2/QE3) and fallen after the completion of each series of bond buying (currently at a pace of $85 billion per month in purchases). That’s right, the Federal Reserve has actually failed on its intent to lower interest rates. In fact, the yield on the 10-year Treasury Note stands at 2.94% today, while at the time QE1 started five years ago, on December 16, 2008, the 10-year rate was dramatically lower (~2.13%). Sure, the argument can be made that rates declined in anticipation of the program’s initiation, but if that is indeed the case, the recent rate spike of the 10-year Treasury Note to the 3.0% level should reverse itself once tapering begins (i.e., interest rates should decline). Wow, I can hardly wait for the stimulative effects of tapering to start!
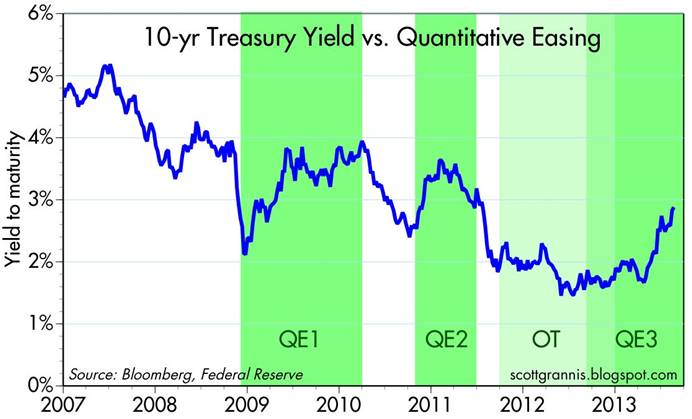
Source: Calafia Beach Pundit
Fact or Fiction? QE Helps Economy
Taken from a slightly different angle, if you consider the impact of the Federal Reserve’s actions on the actual economy, arguably there are only loose connections. More specifically, if you look at the jobs picture, there is virtually NO correlation between QE activity and job creation (see unemployment claims chart below). There have been small upward blips along the QE1/QE2/QE3 path, but since the beginning of 2009, the declining trend in unemployment claims looks like a black diamond ski slope.
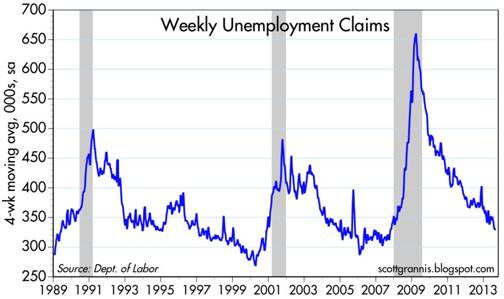
Source: Calafia Beach Pundit
Moreover, if you look at a broad spectrum of economic charts since QE1 began, including data on capital spending, bank loans, corporate profits, vehicle sales, and other key figures related to the economy, the conclusion is the same – there is no discernible connection between the economic recovery and the Federal Reserve’s quantitative easing initiatives.
I know many investors are highly skeptical of the stock market’s rebound, but is it possible that fundamental economic laws of supply and demand, in concert with efficient capital markets, could have something to do with the economic recovery? Booms and busts throughout history have come as a result of excesses and scarcities – in many cases assisted by undue amounts of fear and greed. We experienced these phenomena most recently with the tech and housing bubbles in the early and middle parts of last decade. Given the natural adjustments of supply and demand, coupled with the psychological scars and wounds from the last financial crisis, there is no clear evidence of a new bubble about to burst.
While it’s my personal view that many government initiatives, including QE, have had little impact on the economy, the Federal Reserve does have the ability to indirectly increase business and consumer confidence. Ben Bernanke clearly made this positive impact during the financial crisis through his creative implementation of unprecedented programs (TARP, TALF, QE, Twist, etc.). The imminent tapering and eventual conclusion of QE may result in a short-term hit to confidence, but the economy is standing on a much stronger economic foundation today. Making Ben Bernanke a scapegoat for rising interest rates is easy to do, but in actuality, an improving economy on stronger footing will likely have a larger bearing on the future direction of interest rates relative to any upcoming Fed actions.
Doubters remain plentiful, but the show still goes on. Not only are banks and individuals sitting on much sturdier and healthier balance sheets, but corporations are running lean operations that are reporting record profit margins while sitting on trillions of dollars in cash. In addition, with jobs on a slow but steady path to recovery, confidence at the CEO and consumer levels is also on the rise.
Despite all the negative perceptions surrounding the Fed’s pending tapering, reality dictates the impact from QE’s wind-down will likely to be more muted than anticipated. The mitigation of monetary easing is more a sign of sustainable economic strength than a sign of looming economic collapse. If this reality becomes the common perception, markets are likely to move higher.
Wade W. Slome, CFA, CFP®
Plan. Invest. Prosper.
DISCLOSURE: Sidoxia Capital Management (SCM) and some of its clients hold positions in certain exchange traded funds (ETFs), but at the time of publishing, SCM had no direct position in any other security referenced in this article. No information accessed through the Investing Caffeine (IC) website constitutes investment, financial, legal, tax or other advice nor is the information to be relied on in making an investment or other decision. Please read disclosure language on IC Contact page.
Stocks Take a Breather after Long Sprint

Like a sprinter running a long sprint, the stock market eventually needs to take a breather too, and that’s exactly what investors experienced this week as they witnessed the Dow Jones Industrial Average face its largest drop of 2013 (down -2.2%) – and also the largest weekly slump since 2012. Runners, like financial markets, sooner or later suffer fatigue, and that’s exactly what we’re seeing after a relatively unabated +27% upsurge over the last nine months. Does a -2% hit in one week feel pleasant? Certainly not, but before the next race, the markets need to catch their breath.
By now, investors should not be surprised that pitfalls and injuries are part of the investment racing game – something Olympian Mary Decker Slaney can attest to as a runner (see 1984 Olympic 3000m final against Zola Budd). As I have pointed out in previous articles (Most Hated Bull Market), the almost tripling in stock prices from the 2009 lows has not been a smooth, uninterrupted path-line, but rather investors have endured two corrections averaging -20% and two other drops approximating -10%. Instead of panicking by locking in damaging transaction costs, taxes, and losses, it is better to focus on earnings, cash flows, valuations, and the relative return available in alternative asset classes. With generationally low interest rates occurring over recent periods, the available subset of attractive investment opportunities has narrowed (see Confessions of a Bond Hater), leaving many investing racers to default to stocks.
Recent talk of potential Federal Reserve bond purchase “tapering” has led to a two-year low in bond prices and caused a mini spike in interest rates (10-year Treasury note currently yielding +2.83%). At the margin, this trend makes bonds more attractive (lower prices), but as you can see from the chart below, interest rates are still relatively close to historically low yields. For the time being, this still makes domestic equities an attractive asset class.
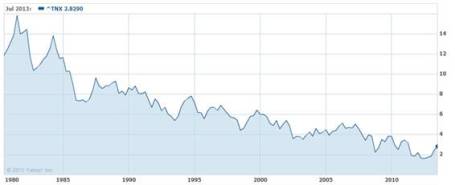
Source: Yahoo! Finance
Price Follows Earnings
The simple but true axiom that stock prices follow earnings over the long-run is just as true today as it was a century ago. Interest rates and price-earnings ratios can also impact stock prices. To illustrate my argument, let’s talk baseball. Wind, rain, and muscle (interest rates, PE ratios, political risk, etc.) are factors impacting the direction of a thrown baseball (stock prices), but gravity is the key factor influencing the ultimate destination of the baseball. Long-term earnings growth is the equivalent factor to gravity when talking about stock prices.
To buttress my point that stock prices following long-term earnings, consider the fact that S&P 500 annualized operating earnings bottomed in 2009 at $39.61. Since that point, annualized earnings through the second quarter of 2013 (~94% of companies reported results) have reached $99.30, up +151%. S&P 500 stock prices bottomed at 666 in 2009, and today the index sits at 1655, +148%. OK, so earnings are up +151% and stock prices are up +148%. Coincidence? Perhaps not.
If we take a closer look at earnings, the deceleration of earnings growth is unmistakable (see Financial Times chart below), yet the S&P 500 index is still up +16% this year, excluding dividends. In reality, predicting multiple expansion or contraction is nearly impossible. For example, earnings in the S&P 500 grew an incredible +15% in 2011, yet stock prices were anemically flat for that year, showing no price appreciation (+0.0%). Since the end of 2011, earnings have risen a meager +3%, however stock prices have catapulted +32%. Is this multiple expansion sustainable? Given stock P/E ratios remain in a reasonable 15-16x range, according to forward and trailing earnings, there is some room for expansion, but the low hanging fruit has been picked and further double-digit price appreciation will require additional earnings growth.
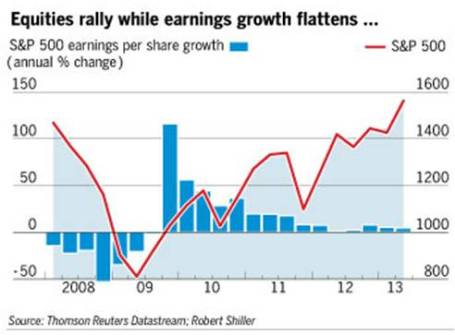
Source: Financial Times
But stocks should not be solely looked through a domestic lens…there is another 95% of the world’s population slowly embracing capitalism and democracy to fuel future dynamic earnings growth. At Sidoxia (www.Sidoxia.com), we are finding plenty of opportunities outside our U.S. borders, including alternative asset classes.
The investment race continues, and taking breathers is part of the competition, especially after long sprints. Rather than panic, enjoy the respite.
Wade W. Slome, CFA, CFP®
Plan. Invest. Prosper.
DISCLOSURE: Sidoxia Capital Management (SCM) and some of its clients hold positions in certain exchange traded funds (ETFs), but at the time of publishing, SCM had no direct position in any other security referenced in this article. No information accessed through the Investing Caffeine (IC) website constitutes investment, financial, legal, tax or other advice nor is to be relied on in making an investment or other decision. Please read disclosure language on IC Contact page.
The Rule of 20 Can Make You Plenty

There is an endless debate over whether the equity markets are overvalued or undervalued, and at some point the discussion eventually transitions to what the market’s appropriate P/E (Price-Earnings) level should be. There are several standard definitions used for P/Es, but typically a 12-month trailing earnings, 12-month forward earnings (using earnings forecasts), and multi-year average earnings (e.g., Shiller 10-year inflation adjusted P/E – see Foggy P/E Rearview Mirror) are used in the calculations. Don Hays at Hays Advisory (www.haysadvisory.com) provides an excellent 30+ year view of the historical P/E ratio on a forward basis (see chart below).

Blue Line: Forward PE - Red Line: Implied Equilibrium PE (Hays Advisory)
If you listen to Peter Lynch, investor extraordinaire, his “Rule of 20” states a market equilibrium P/E ratio should equal 20 minus the inflation rate. This rule would imply an equilibrium P/E ratio of approximately 18x times earnings when the current 2011 P/E multiple implies a value slightly above 11x times earnings. The bears may claim victory if the earnings denominator collapses, but if earnings, on the contrary, continue coming in better than expected, then the sun might break through the clouds in the form of significant price appreciation.
Just because prices have been chopped in half, doesn’t mean they can’t go lower. From 1966 – 1982 the Dow Jones Industrial index traded at around 800 and P/E multiples contracted to single digits. That rubber band eventually snapped and the index catapulted 17-fold from about 800 to almost 14,000 in 25 years. Even though equities have struggled at the start of this century, a few things have changed from the market lows of 30 years ago. For starters, we have not hit an inflation rate of 13% or a Federal Funds rate of 20% (~3.5% and 0% today, respectively), so we have some headroom before the single digit P/E apocalypse descends upon us.
Fed Model Implies Equity Throttle
Hays Advisory exhibits another key valuation measurement of the equity market (the so-called “Fed Model”), which compares the Treasury yield of the 10-year Note with the earnings yield of stocks (see chart below).

Blue Line: 10-Yr Treasury - Red Line: Forward PE (Hays Advisory)
Regardless of your perspective, the divergence will eventually take care of it in one of three ways:
1.) Bond prices collapse, and Treasury yields spike up to catch up with equity yields.
2.) Forward earnings collapse (e.g., global recession/depression), and equity yields plummet down to the low Treasury yield levels.
AND/OR
3.) Stock prices catapult higher (lower earnings yield) to converge.
At the end of the day, money goes where it is treated best, and at least today, bonds are expected to treat investors substantially worse than the unfaithful treatment of Demi Moore by Ashton Kutcher. The Super Committee may not have its act together, and Europe is a mess, but the significant earnings yield of the equity markets are factoring in a great deal of pessimism.
The holidays are rapidly approaching. If for some reason the auspice of gifts is looking scarce, then review the Fed Model and Rule of 20, these techniques may make you plenty.
Wade W. Slome, CFA, CFP®
Plan. Invest. Prosper.
DISCLOSURE: Sidoxia Capital Management (SCM) and some of its clients own certain exchange traded funds, but at the time of publishing SCM had no direct position in any other security referenced in this article. No information accessed through the Investing Caffeine (IC) website constitutes investment, financial, legal, tax or other advice nor is to be relied on in making an investment or other decision. Please read disclosure language on IC “Contact” page.
Treasury Bubble Hasn’t Burst….Yet

10-Year Treasury Chart (5-14-09)
Clusterstlock’s Joe Weisenthal’s takes a historical look on 10-year Treasury yields going back to 1962. As you can see, the yield is still below 1962 levels, despite the massive inflationary steps the Federal Reserve and Treasury have taken over the last 18 months (6-26-09 yield was 3.51%). These trends can also be put into perspective by reading Vincent Fernando’s post at http://www.researchreloaded.com. Take a peek.
Ways to take advantage of this trend include purchases of TBT (UltraShort 20+ Year Treasury ProShares) or short TLT (iShares Barclays 20+ Year Treasury Bond)*.

Reverse View of Historical 10-Year Treasury Yield
*Disclosure: Sidoxia Capital Management clients and/or Slome Sidoxia Fund may have a short position in TLT.


