Waiting for the Hundred Minute Flood

Investors have been scarred over the last decade and many retirees have seen massive setbacks to their retirement plans. We have witnessed the proverbial “100 year flood” twice in the 2000s in the shape of a bursting technology and credit bubble in 2000 and 2008, respectively. The instantaneous transmission of data around the globe, facilitated by 24/7 news cycles and non-stop internet access, has only accelerated investor panic attacks – the 100 year flood is now expected every 100 minutes.
If drowning in the 100 year flood of events surrounding Bear Stearns, Lehman Brothers, Washington Mutual, AIG, Fannie Mae, Freddie Mac, TARP bank bailouts, Bernie Madoff’s Ponzi scheme, and Eliot Spitzer’s prostitute appreciation activities were not enough in 2008, investors (and many bearish bloggers) have been left facing the challenge of reconciling an +80% move in the S&P 500 index and +100% move in the NASDAQ index with the following outcomes (through the bulk of 2009 and 2010):
- Flash crash, high frequency traders, and “dark pools”
- GM and Chrysler’s bankruptcies
- Dubai debt crisis
- Goldman Sachs – John Paulson hearings
- Tiger Woods cheating scandal
- Greece bailout
- BP oil spill
- Healthcare reform
- China real estate bubble concerns
- Congressional leadership changes
- European austerity riots
- North Korea – South Korea provocations
- Insider trading raids
- Ireland bailout
- Next: ?????
With all this dreadful news, how in the heck have the equity markets about doubled from the lows of last year? The “Zombie Bears,” as Barry Ritholtz at The Big Picture has affectionately coined, would have you believe this is merely a dead-cat bounce in a longer-term bear-market. Never mind the five consecutive quarters of GDP growth, the 10 consecutive months of private job creation, or the record 2010 projected profits, the Zombie Bears attribute this fleeting rebound to temporary stimulus, short-term inventory rebuild, and unsustainable printing press activity by Federal Reserve Chairman Ben Bernanke.
Perhaps the Zombie Bears will change their mind once the markets advance another 25-30%? Regardless of the market action, individual investors have taken the pessimism bait and continue to hide in their caves. This strategy makes sense for wealthy retirees with adequate resources, but for the vast majority of Americans, earning next to nothing on their nest egg in cash and overpriced Treasuries isn’t going to help much in achieving your retirement goals. Unless of course, you like working as a greeter at Wal-Mart in your 80s and eating mac & cheese for breakfast, lunch, and dinner.
This Time is Different
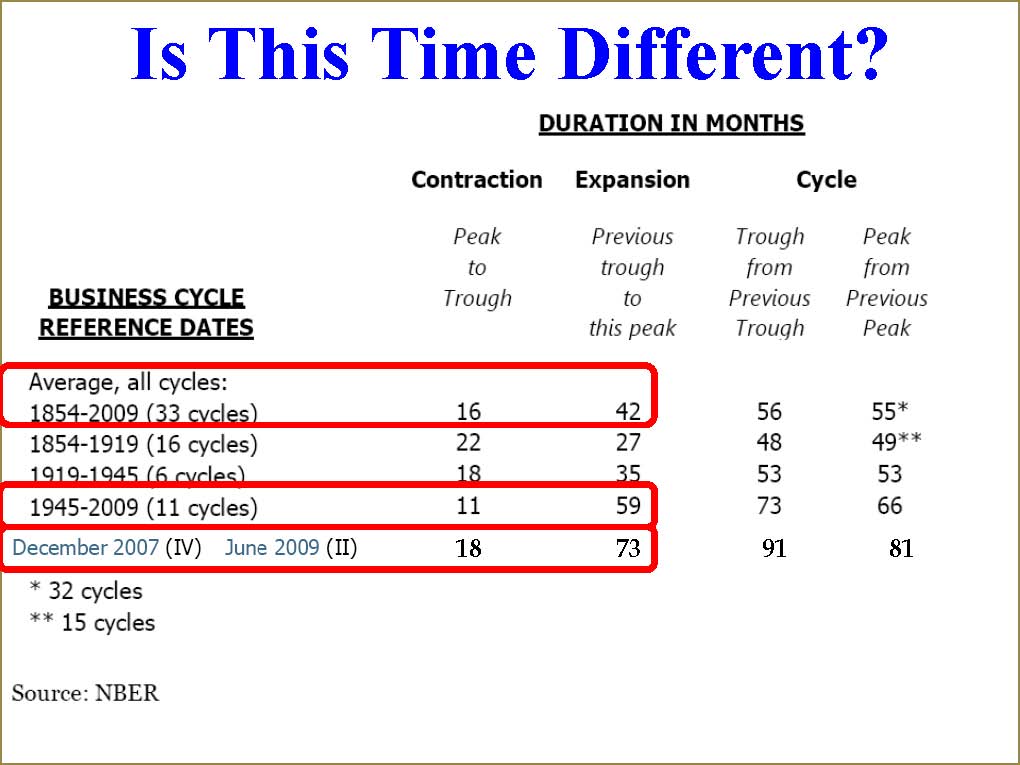
The Zombies would also have you believe this time is different, or in other words, historical economic cycles do not apply to the recent recession. I’ll stick with French novelist Alphonse Karr (1808-1890) who famously stated, “The more things change, the more things stay the same.”
As you can see from the data below, the recent recession lasted two months longer than the 16 month cycle average from 1854 – 2009. We have had 33 recessions and 33 recoveries, so I am going to go out on a limb and say this time will not be any different. Could we have a double dip recession? Sure, but odds are on our side for an average five year expansion, not the 18 month expansion experienced thus far.
The Grandma Sentiment Indicator
I love all these sentiment indicators, surveys, and various ratios that constantly get thrown around the blogosphere because it is never difficult to choose one matching a specific investment thesis. Strategists urge us to follow the actions of the “smart money” and do the opposite (like George Costanza) when looking at the “dumb money” indicators. The bears would also have you believe the world is coming to an end if you look at the current put/call data (see Smart Money Prepares for Sell Off). Instead, I choose to listen to my grandma, who has wisely reminded me that actions speak louder than words. Right now, those actions are screaming pure, unadulterated fear – a positive contrarian dynamic.
Over the last few years there has been more than $250 billion in equity outflows according to data from the Investment Company Institute (ICI). Bond funds on the other hand have taken in an unprecedented $376 billion in 2009 and about another $216 billion in 2010 through August.
As investment guru Sir John Templeton famously stated, “Bull markets are born on pessimism and they grow on skepticism, mature on optimism, and die on euphoria.” Judging by the asset outflows, I would say we haven’t quite reached the euphoria phase quite yet. I won’t complain though because the more fear out there, the more opportunity for me and my investors.
As I have consistently stated, I have no clue what equity markets are going to do over the next six to twelve months, nor does my bottom-up philosophy rely upon making market forecasts to succeed. Evaluating investor sentiment and timing economic cycles are difficult skills to master, but judging by the panicked actions and bond heavy asset inflows, investors are nervously awaiting another 100 year flood to occur in the next hundred minutes.
Wade W. Slome, CFA, CFP®
Plan. Invest. Prosper.
DISCLOSURE: Sidoxia Capital Management (SCM) and some of its clients own certain exchange traded funds, WMT, and AIG derivative security, but at the time of publishing SCM had no direct position in Bear Stearns, Lehman Brothers, JPM, Washington Mutual, Fannie Mae, Freddie Mac, GS, BP, GM, Chrysler, and any other security referenced in this article. No information accessed through the Investing Caffeine (IC) website constitutes investment, financial, legal, tax or other advice nor is to be relied on in making an investment or other decision. Please read disclosure language on IC “Contact” page.
Insider Trading Interview with Sidoxia Capital Management
I am recovering from one too many servings of turkey and pumpkin pie, so perhaps you can enjoy an interview I conducted with CNBC’s Erin Burnett on the subject of insider trading earlier this week (Minute 2:00).
Once I awake from the food-induced coma, I promise to return with a more typical article on Investing Caffeine’s site.
I hope everyone had a wonderful holiday…
Wade W. Slome, CFA, CFP®
Plan. Invest. Prosper.
DISCLOSURE: Sidoxia Capital Management (SCM) and some of its clients own certain exchange traded funds, but at the time of publishing SCM had no direct position in any other security referenced in this article. No information accessed through the Investing Caffeine (IC) website constitutes investment, financial, legal, tax or other advice nor is to be relied on in making an investment or other decision. Please read disclosure language on IC “Contact” page.
Shrewd Research or Bilking the System?

Information is power and some hedge funds, mutual funds, and investment managers will go to great lengths to obtain the lowdown.
Integrity of the financial markets is key and recently several hedge funds (Level Global Investors LP, Diamondback Capital Management LLC and Loch Capital Management LLC) have been raided by the Federal Bureau of Investigation (FBI). Other large investment players, including SAC Capital Advisors, Janus Capital Group Inc. (JNS) and Wellington Management Co. have also received inquiries as part of what some journalists are calling rampant industry insider trading activity. Even investment bank Goldman Sachs (GS) is allegedly being examined for potential unlawful leakage of merger information. Little is known about the allegations, so it is difficult to decipher whether this is the tip of the iceberg or standard investigative work?
Regardless of the scope of the investigation, there is a fine line between what scoop is considered fair versus illegal. The distinction becomes even more difficult to pinpoint with the evolution of faster and more voluminous trading (i.e., high frequency trading). The internet has accelerated the speed of information transfer faster than a politician’s promise to cut spending. Data is chewed up and spit out so quickly, meaning tradable information has a very short shelf life before it is profitably exploited by someone. In the old days of snail mail and private back-office meetings, security prices would require time for information to be completely reflected.
Expert Networks Questioned
Another ingredient introduced over the last decade is the advent of the “expert network,” which are firms that connect fund managers to industry specialists, in many cases as part of a “channel check” to gauge the health of a particular industry. About 10 years ago Regulation FD (Fair Disclosure) was introduced to prevent selective disclosure of “material non-public” information (tips that will likely cause security prices to go significantly up or down) by senior company officials and investor relation professionals to investor types. Greedy (and/or ingenious) institutional investors are Darwinian and as a result figured out a loophole around the system. Hedge funds and other investment managers figured out if the senior executives won’t cough up the good info, then why not target the junior executives and squeeze the inside story from them like informants? Expert networks (read thorough description here) serve as an informational channel to service this demand. Although I’m sure there have been a minority of cases where mid-level managers or junior executives have leaked material information (intentionally or unintentionally), I’m very confident that it is the exception more than the rule. In many instances when the beans were spilled, Regulation FD protects both the person disseminating the information and the investor receiving the information.
Rigged Game for Individuals?
OK sure…hedge funds and institutional managers may occasionally have privileged access to executive teams and can afford access to industry experts. I should know, since I managed a multi-billion fund and consistently had access to the upper rank of corporate executives. Hearing directly from the horse’s mouth and trying to interpret body language can provide insights and instill confidence in a trade, but these executives are not stupid enough to risk prison time by selectively disclosing material non-public information. This dynamic of privileged access will never change as long as CEOs and CFOs are allowed to communicate with investors. Corporate executives will naturally prioritize their limited investor communications towards the larger players.
So with the big-wig managers gaining access to the big-wig executives, has the game become rigged for the individual investors? The short answer is “no.” Over the last decade individual investors have experienced a tremendous leveling of the playing field versus institutional investors. While institutions have privileged access and have pushed to exploit HFT and expert networks, individual investors have gained access to institutional quality research (e.g., SEC filings, real-time conference calls, Wall Street reports, etc.) for free or affordable prices. With the ubiquity of technology and the internet, I only see that gap narrowing more over time.
There will always be cheaters who stretch themselves beyond legal boundaries and should be prosecuted to the full extent of the law. However, for the vast majority of institutional investors, they are using technology and other tools (i.e., expert networks) as shrewd resources to compete in a difficult game. I will reserve full judgment on the names pasted all over the press until the FBI and SEC reveal all their cards. So far there appears to be more noise than smoke coming from the barrel tip of the insider trading gun.
Wade W. Slome, CFA, CFP®
Plan. Invest. Prosper.
DISCLOSURE: Sidoxia Capital Management (SCM) and some of its clients own certain exchange traded funds, but at the time of publishing SCM had no direct position in GS, SAC Capital Advisors, Janus Capital Group Inc. (JNS), Wellington Management Co., or any other security referenced in this article. No information accessed through the Investing Caffeine (IC) website constitutes investment, financial, legal, tax or other advice nor is to be relied on in making an investment or other decision. Please read disclosure language on IC “Contact” page.
The Impoverished Global Babysitter

I don’t mind being a babysitter for the world, as long as I get paid for it. Unfortunately, not only are we paying to be the nation’s global defense babysitter, but we are also paying for the protection responsibility with unsustainable borrowings.
I don’t want to be a cold-hearted neighbor to our friends and allies, but it is all a matter of degree. Collecting a vacationing neighbor’s newspaper and mail, and watching for any potential suspicious activity is all part of being a conscientious, dependable neighbor, but where do you draw the line? As a good neighbor, should I also be responsible for paying for and installing a security system on their premises? Or how about getting my 16 year old nephew to spend the night at my neighbor’s because of some scary noises heard during the previous night?
For politicians to say we need to cut spending but defense spending is off the table is hypocritical. Bruce Bartlett, columnist at The Fiscal Time, had this to say on the subject:
“No one is saying the defense budget is the sole source of the deficit, but the fact is that it has risen from 3 percent of the gross domestic product in fiscal year 2001 to 4.7 percent this year. That additional 1.7 percent of GDP amounts to $250 billion in spending — almost 20 percent of this year’s budget deficit. And according to a recent Congressional Research Service report, the cost of wars in Iraq and Afghanistan alone accounted for 23 percent of the combined budget deficits between fiscal years 2003 and 2010.”
Even the government should have learned one of the prime lessons from the 2008-2009 financial crisis: tough times require the necessity to do more with less. Whether you are talking about a large corporation like $173 billion valued General Electric (GE), a small mom-and-pop coffee shop, or a middle-class family of four, the moral of the story is bad things eventually happen to individuals, corporations, and governments that live beyond their means. The crisis was exacerbated by excessive borrowing to achieve the higher standard of living and operations.
New Heightened Sensibility?
The initial deficit reduction proposals crafted by the bipartisan commission headed by Erskine Bowles and Alan Simpson should be lauded, regardless of how much Congress decides to dilute the $4 trillion in budget cuts over the next 10 years. The plan may not garner votes for politicians, but these types of necessary cuts will place our country on firmer ground and provide a more sustainable path to prosperity. More specifically, the plan would bring the federal budget deficit down to 2.2% of GDP (Gross Domestic Product) by 2015 and reduce the country’s debt to 60% of GDP by 2024.
Building Flying Rolls Royces
Bowles and Simpson appear to get it, but our bloated government doesn’t seem to understand. If I were running an unprofitable company with a lot of debt, would it be a good idea to develop a new flying Rolls Royce car fleet (with questionable utility) for my employees? Common fiscal sense would dictate the answer to be “NO.”
Regrettably our government has answered “yes” by building a ridiculously costly flying Rolls Royce fleet of its own under the name of Joint Strike Fighter (the F-35 program from Lockheed Martin Corp. [LMT]). This absurdly priced program – the costliest in our country’s history – is projected to cost up to $382 billion for 2,443 aircraft over the next two decades (Reuters). This translates into a whopping $156 million per aircraft. Cost overruns have already come in 40-90% higher than expected over the last nine years, and the price tag continues to rise. The state of the art jet program is touted as a Swiss army knife (flexibility to be used by all three branches of the military), but may actually turn out to be a butter knife due to the program’s questioned utility (see great PBS video here).
So like any company, individual, or government, there is something called prioritization. By cutting fat in less critical areas, a portion of those savings can be redeployed to INCREASE spending in the areas that matter. I won’t wade into the relative merits (or lack thereof) related to Afghanistan and Iraq expenditures or appropriate troop levels, but suffice it to say, I’m certain spending can be cut in many areas to make room for our country’s primary defense priorities.
I’m no defense expert but when faced to deal with a murky, inconspicuous issue of terrorism (cave dwelling insurgents and bomb-making sleeper cells), intelligence collection and international coordination make more sense than building $150 million flying Rolls Royces, which are better suited for fighting an obsolete cold war than finding terrorist needles in a global haystack.
Crotch Costs
Layer on the new TSA passenger flight costs associated with crotch fondling pat downs and the costs related to buying miniaturized shampoo and gel containers, one wonders if tax-payer money can be more efficiently spent. For what it’s worth, the FDA has approved the latest body scanning machines with no health concerns, so if an airport worker gets his/her jollies by ogling an overweight out of shape passenger like me, then so be it. The fact of the matter is that estimates show 99% of passengers choose the innocuous body scan, which displays a white, ghost-like naked computer image to the agent. For those worried about self image issues or privacy concerns, perhaps the airports can set up a meet-and-greet room option for passengers to become better acquainted with the agent before passing through the scanner.
Freeloaders Cutting Spend
Source: The Financial Times
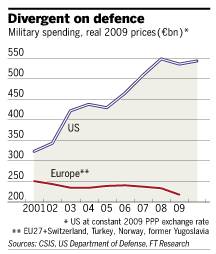
Domestic defense spending cuts become especially touchy when discussed in concert with European spending reductions. Take for example German plans to slash $10.7 billion in defense spending by 2014 and British spending cuts of 10% to 20% (around $6 – $12 billion). Europeans are labeled by Americans as socialists because of their lengthy paid vacations, maternity leaves, and generous healthcare benefits. More power to them and I desire all those things for myself and my family too, but I just don’t want my taxes to pay for others’ benefits when our country cannot afford those same wonderful benefits for ourselves.
While our Defense Secretary, Robert Gates, has been talking a good game with respect to a $100 billion in savings cuts, these cuts should be put in the context of a $567 billion budget for 2011 and a $700 billion estimated 2015 budget. As it turns out, these $100 billion in cuts are not cuts at all – Gates is also talking out of the other side of his mouth by saying he wants to continue increasing overall defense spending.
Is the size of spending appropriate? According to SIPRI, an independent international research institute, the U.S. defense budget accounts for 54% of the world’s total military spending, when our population only represents less than 5% of the world’s total. If that is not a disproportionate subsidy to the rest of the world, then I do not know what one is? The real longer term threat is not Iran or North Korea, but rather China. I’ll go out on a limb and say we can probably hold our own for a while, considering China is still only spending about 15% of what we spend on defense.
As I stated earlier, it is more important than ever to do more with less. Corporations are clearly doing that now by cutting spending, while still able to create record profits. The government has to get on board with trimming fat in all areas of our government…including defense. Coordinating intelligence and combining resources across the globe is crucial if we want to get more bang for our buck, while still devoting adequate resources to fend off the real and immediate evil threats of terrorism. Babysitting is an important duty and responsibility, but as impoverished Americans we are not capable of providing that service to the whole world free of charge.
Wade W. Slome, CFA, CFP®
Plan. Invest. Prosper.
DISCLOSURE: Sidoxia Capital Management (SCM) and some of its clients own certain exchange traded funds, but at the time of publishing SCM had no direct position in GE, LMT, Rolls Royce, or any other security referenced in this article. No information accessed through the Investing Caffeine (IC) website constitutes investment, financial, legal, tax or other advice nor is to be relied on in making an investment or other decision. Please read disclosure language on IC “Contact” page.
The Internet: The Fourth Necessity

The basic necessities for human life are food, water, shelter and most importantly…the internet. Imagine a world where you cannot: access your email; text your spouse or significant other in the same house; Twitter the contents of your lunch; or Facebook a YouTube video of a dancing meringue dog (see video). Scary thought.
Many people take the internet for granted, just like the air we breathe, but how important a role does the internet play in people’s lives? Mary Meeker, internet analyst from Morgan Stanley, takes a look at this question in a recently released presentation she completed. Earlier in the decade, Meeker was raked over the coals during the deflation of the internet bubble, but in many respects she has been redeemed in the subsequent years as hundreds of millions of people continue to plug into the internet.
According to the broad base of expert strategists, we apparently are living in an overvalued, “New Normal ” market with subdued growth for as far as the eye can see (check out New Abnormal). In the mean time Meeker shows how the top 15 global internet franchises have nearly quadrupled revenue from $33 billion in 2004 to $126 billion today. Perhaps abnormally outsized opportunities in the corporate internet universe will be the “New Normal” over the coming years?
Internet Ubiquity

Source: Morgan Stanley
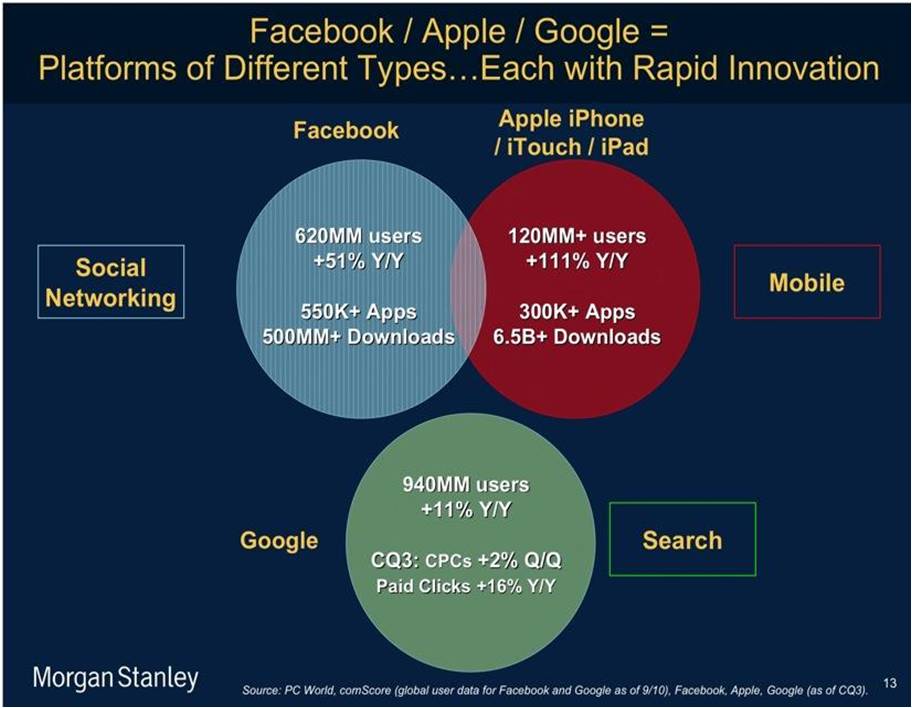
How ubiquitous is the internet becoming? Last year 1.8 billion people accessed this invisible global flattening medium we like to call the internet, and users spent 18.8 trillion minutes online, up +21% over the previous year. Many people are very familiar with the home-bred internet franchises of Facebook (620 million users), Google (940 million users), and Apple (120 million internet device users), but many investors under-appreciate the global scale of international internet franchises like Tencent (637 million users…more than Facebook by the way), Baidu ($40 billion market value), or Alibaba.com ($10 billion market value).
Source: Morgan Stanley
Mobile ubiquity is on the rise too. Connecting through a desktop or laptop is not enough these days, so internet addicts are increasingly attaching a mobile phone umbilical cord for such useful bathroom applications such as this (click here). Lugging a laptop around all over the place can be an inconvenience. So primal is the mobile instinct among internet users, Morgan Stanley expects mobile phone shipments to surpass PC and laptop shipments over the next 24 months.
What’s Next?
The party is just getting started. If you just consider eCommerce (purchases online), which only accounts for 4% of total commerce conducted in the U.S., then there is a lot of headroom for internet purchases to expand. The incredible potential rings true especially if you contemplate old traditional catalog, which peaked at more than 10% of overall commerce according to some industry executives. The rich feature functionality afforded to users through the internet, coupled with the increased convenience of mobility, augur well for future ecommerce sales growth.
The internet has been around for 15 years, but in the whole scheme of things this transformative medium is just a baby – especially if you consider the amount of time it took other revolutions like electricity, the rail network, and automobile proliferation to spread. That is why it is not too late to join the internet party. Food, water, and shelter are human necessities of life, just like exposure to the internet revolution is a necessity for your investment portfolio.
Read the Morgan Stanley Internet Presentation by Mary Meeker
Wade W. Slome, CFA, CFP®
Plan. Invest. Prosper.
DISCLOSURE: Sidoxia Capital Management (SCM) and some of its clients own certain exchange traded funds, AAPL and GOOG, but at the time of publishing SCM had no direct position in MS, BIDU, Tencent, Alibaba.com, Facebook, Twitter, or any other security referenced in this article. No information accessed through the Investing Caffeine (IC) website constitutes investment, financial, legal, tax or other advice nor is to be relied on in making an investment or other decision. Please read disclosure language on IC “Contact” page.
The Cyclical Seasons of Growth and Value

Continually the airwaves rotate through the growth and value managers du jour, and like religious zealots each one explains their philosophy with such confidence that Jersey Shore’s “The Situation” would even call them cocky. The fact of the matter is that styles go in and out of favor like the seasons of the year. What’s more, the consistency of the seasons is erratic and the duration of the style outperformance can in many instances extend for years. A major driver behind the relative outperformance of styles links back to where we stand in the economic cycle. Since these phases can last for years, meticulous precision is not required.
Case in point, take the “Go-Go” 1990s. In the back half of the decade, while the “New Economy” of technology companies propelled GDP to new heights, growth stocks witnessed historic price appreciation and P/E (Price-Earnings) multiple expansion. As members of our growth team high-fived each other on a daily basis, the “Four Horsemen” consistently jumped 2-3% like clockwork. Simultaneously, human resources had to keep sharp objects away from our value team colleagues and make sure the windows were locked shut. As you can see from the chart, growth stocks trounced value stocks during that period.

Source: INGdelivers.com
Karma can be a bi*ch however, because as the technology bubble burst in 2000, the coiled underperforming value stocks sprang to significant outperformance in the first half of the 2000s. The value managers were more than happy to hand over the straightjackets to us growth managers.
Since these style cycles can persist for long periods of time, and we managers get compensated based on performance versus peers, there is a strong incentive to cheat or style drift towards the outperforming style (see also Hail Mary Investing).
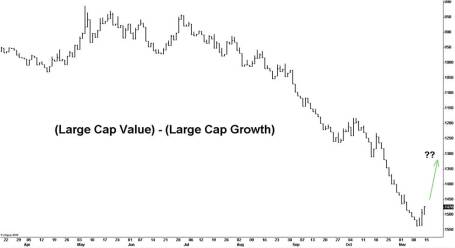
The pain threshold is increasing for value managers as the economic expansion matures and growth stocks have handily outperformed value stocks over the last five years. When value managers start piling into Apple Inc. (AAPL), maybe the value cycle will be ready to kick into gear again.

Growth consistently outperforming value (Source: Russell Investments)
- Source: Dynamic Hedge – Is value on the comeback trail?

Arbitrary Style Buckets
Understanding the dynamics of style outperformance cycles is important, but understanding how the sausage is made at the micro level is essential too. One must appreciate that style categorizations are determined by arbitrary criteria by self-anointed “bucket deciders” (i.e., S&P, Barra, Russell Investments). Like ping pong balls, individual stocks will bounce around from one style bucket to the other based largely on share price volatility and financial metrics such as Price/Book, Price/Earnings, and EPS growth. Regrettably, these metrics can become temporarily distorted and lead to irrational trading patterns for benchmark hugging managers that become myopically focused on minor deviations from the herd.
Based on the stock bucket decision criteria, some questionable head-scratching stock categorizations may occur. For examples International Business Machines (IBM) is classified as a growth stock in the Russell 1000 Growth Index despite a cheap forward 11x P/E multiple, meager 3% revenue growth, and a 2% dividend. Phillip Morris Intl (PM) is also considered a growth stock even though its revenue growth has recently been even more sluggish at 2%, and has a mouth watering value-like dividend of 4.4%.
On the flip side, stocks like Microsoft Corp. (MSFT) are thrown in the value bucket, although the software king grew revenues +25% and earnings +55% in the recent quarter. Iconic value stock Berkshire Hathaway (BRKA/B) follows many growth stocks by not paying a dividend, and the Buffett controlled entity trades at a sky-high trailing P/E multiple of 20x, and ironically expanded sales and earnings by +21% and +28%, respectively.
All this talk of style seasons and bucket hopping only highlights the boring but crucial principle of diversification. It’s important to understand these cycles and categorizations, especially at extremes, but this does not get rid of the fact that an overly concentrated portfolio concentrated in an outperforming style is setting itself up for failure (see also Riding the Wave). We’ve reviewed cycle dynamics surrounding investment styles, but these varied securities come in all shapes and sizes – we will tackle the relative performance forces of small, mid, and large capitalization stocks during another season.
Wade W. Slome, CFA, CFP®
Plan. Invest. Prosper.
DISCLOSURE: Sidoxia Capital Management (SCM) and some of its clients own certain exchange traded funds, AAPL and CSCO, but at the time of publishing SCM had no direct position in ORCL, EMC, IBM, PM, MSFT, BRKA/B, or any other security referenced in this article. No information accessed through the Investing Caffeine (IC) website constitutes investment, financial, legal, tax or other advice nor is to be relied on in making an investment or other decision. Please read disclosure language on IC “Contact” page.
Opening the Broker Departure Floodgates

Even though the equity markets have rebounded massively, investors remain in a sour mood in light of sluggish domestic economic headlines. Technology, for example High Frequency Trading (HFT – read more), along with the harsh realities of financial regulatory reform is creating profit growth challenges for the global financial gargantuans. More specifically, the floodgates have sprung open with respect to broker departures from the big four brokerage firms.
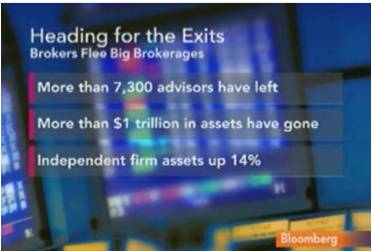
According to Bloomberg, more than 7,300 brokers have left the four largest full-service brokerage firms (Merrill Lynch [BAC], Morgan Stanley Smith Barney [MS], UBS Wealth Management [UBS], and Wells Fargo Advisors [WFC]) since the beginning of 2009. But the brokers have not floated away quietly – more than $1 trillion in assets have fled these major brokerage firms and followed the brokers to their new employers.
Several factors have led to the deluge of departures of bodies and bucks:
1) Mergers: The financial crisis triggered an all-out economic assault on the brokerage firm industry. A subsequent game of musical chairs resulted in the marriage of disparate cultures (e.g., B of A-Merrill; Morgan Stanley-Smith Barney; Wells Fargo-Wachovia). Not only did the clashing cultures rub brokers the wrong way, but the surviving executives were left with redundant and unproductive brokers to cut.
2) Heightened Recruiting: With a shrinking pie and less growth comes more fierce competition. The discount brokerage firms have realized the Darwinian challenges and reacted to them accordingly. Take TD Ameritrade (AMTD) for example. In the first seven months of 2010, the discount brokerage firm added 212 independent advisers to its network, a +44% increase over the previous year. Charles Schwab Corp. (SCHW) with its network of 6,000 independent advisers is also ratcheting up its efforts to poach brokers away from the large brokerage firms.
3) Economics: Would you like 40-50% of profits generated from new clients, or 80-100%? In many instances, the broker from the large branded institution funnels the majority of the commissions to the mother-ship. Sure, the broker receives back-office, marketing, and branding support, but some brokers are now asking themselves is the brand an asset or liability? Wall Street has gotten a large black eye and it will take time to heal their corporate images…if they ever manage to succeed at all.
4) Customer Choice: Lastly, and most importantly, customers are voting with their dollars. As I have indicated in the past, I strongly believe the current system is structurally flawed (see Financial Sharks article). Financial institutions craft incentives designed to line the pockets of brokers (salespeople) and prioritize corporate profits over client wealth creation and preservation. The existing failed industry structure is based upon smoke, mirrors, opacity, and small print. Many independent, fee-only advisors are structuring financial relationships that align with portfolio performance and make transparency a top priority. Customers appreciate these benefits and are shifting dollars away from the brokerage firms.
LPL Loving IPO Life
If you are having a difficult time processing the magnitude of this investment advice shift, then consider the $4.4 billion estimated value being placed on the planned IPO (Initial Public Offering) of LPL Financial, the independent brokerage firm of 12,000+ financial advisors. LPL serves as a conduit for legacy brokers to become independent, and still allow them to benefit from an array of ala carte support services. Growth has been strong too – over the last decade the advisor count at LPL has more than tripled and assets under their umbrella now exceed $250 billion.
The Wall Street broker floodgates have opened, so unless regulatory changes are enacted, the old flawed way of doing things will require a life support raft. If not, independent, fee-only advisors like Sidoxia Capital Management will benefit from the current sinking migration of brokers.
Wade W. Slome, CFA, CFP®
Plan. Invest. Prosper.
DISCLOSURE: Sidoxia Capital Management (SCM) and some of its clients own certain exchange traded funds, but at the time of publishing SCM had no direct position in BAC, MS, UBS, WFC, AMTD, SCHW, LPL Financial or any other security referenced in this article. No information accessed through the Investing Caffeine (IC) website constitutes investment, financial, legal, tax or other advice nor is to be relied on in making an investment or other decision. Please read disclosure language on IC “Contact” page.
Corporate Shockers: You did *#$@% to Steve Jobs?

Source: 1funny.com
Steve Jobs recruited John Sculley to run Apple Computers (AAPL) in 1983 because the board wanted someone more experienced than a snot-nosed 28 year old founder barking orders at Apple employees. Sculley was a seasoned 15 year veteran executive from Pepsi Co. (PEP) whom was persuaded by Jobs to take over the company and join him in changing the world.
Things were all nifty until Sculley went all Brutus on Jobs and decided to fire him with board assistance in 1985 when it was believed that Jobs was poaching executives from Apple to join Jobs’s successor company, Next Computers.
The verdict may not completely be out on Sculley’s effectiveness on running Apple, but he deserves a PhD in the “Obvious Arts.” When asked if the coordinated decision (between Sculley and the Board) to fire Steve Jobs more than 25 years ago was correct, this is what Sculley had to say:
“In hindsight, I think they [board] made the wrong choice. They should have chosen Steve…we should have figured out a way to work with it [Job’s talent].”
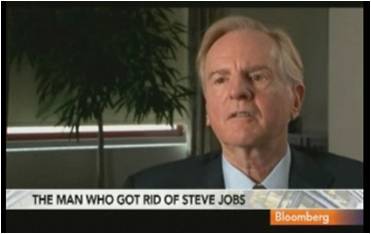
Click Here for John Sculley Bloomberg Interview
Over his term at Apple, Sculley increased sales from $800 million to $8 billion. Good performance, but apparently not good enough, because Sculley was axed in 1993 and a window was opened for Jobs to return as Apple’s puppet-master four years later. The rest is history and AAPL stock went from about $10 per share when Sculley left all the way up to $316.65 today. Not too shabby.
In another shocker, after hiring Sculley and then getting fired by Sculley, Jobs said Sculley won’t talk to him. I can’t understand why a company founder would hold a grudge toward a hand-picked former employee who spearheaded a lynching against his boss? Well, I guess karma has a way of evening things out in the long run – redemption was found with Jobs’s climbing the Silicon Valley mountain to create the $300 billion consumer technology behemoth. I’m sure you don’t have to cry a river for John Sculley, but if he can’t control his own tears, he can always use his hundred dollar bills as tissue surrogates.
What makes Jobs’s decline and subsequent triumph even more unbelievable are the hugs and kisses Steve Jobs owes Microsoft founder and billionaire Bill Gates. If not for a $150 million lifeline offered by Gates to Steve Jobs in August 1997, while Apple was on its financial deathbed, we may not have ever experienced the iPod, iPhone, iPad, or future overhyped consumer gadget (OK, I admit it, I have succumbed to the hype myself). I’m guessing if Bill were given another chance, he would have passed on that Apple investment and we would be stuck paying for $4,000 computers and $1,000 Microsoft Office upgrades.
As a result of these corporate shockers, several lessons can be learned. Number one: If you are hired by a company founder, be careful about firing that boss if put in that position – you could potentially be jeopardizing the creation of hundreds of billions of dollars in future value. Number two: If you are unable to successfully negotiate lesson number one, then just find someone to lend you $150 million. History has taught us lessons based on past events ranging from Prohibition to Watergate, and from Nazi Germany to Tiger Woods’s indiscretions. John Sculley also learned lessons from Apple’s corporate shockers, and so can you.
Wade W. Slome, CFA, CFP®
Plan. Invest. Prosper.
DISCLOSURE: Sidoxia Capital Management (SCM) and some of its clients own certain exchange traded funds and AAPL, but at the time of publishing SCM had no direct position in PEP, MSFT, or any other security referenced in this article. No information accessed through the Investing Caffeine (IC) website constitutes investment, financial, legal, tax or other advice nor is to be relied on in making an investment or other decision. Please read disclosure language on IC “Contact” page.
Sentiment Cycle of Fear and Greed
Investing can be like a cross-country emotional roller-coaster ride to retirement. There are plenty of ups and downs, and plenty of unexpected twist and turns, but as long as investors stay the course, they will eventually reach their retirement objective. If not properly kept in check, however, emotions have the potential of sabotaging and/or delaying retirement objectives.
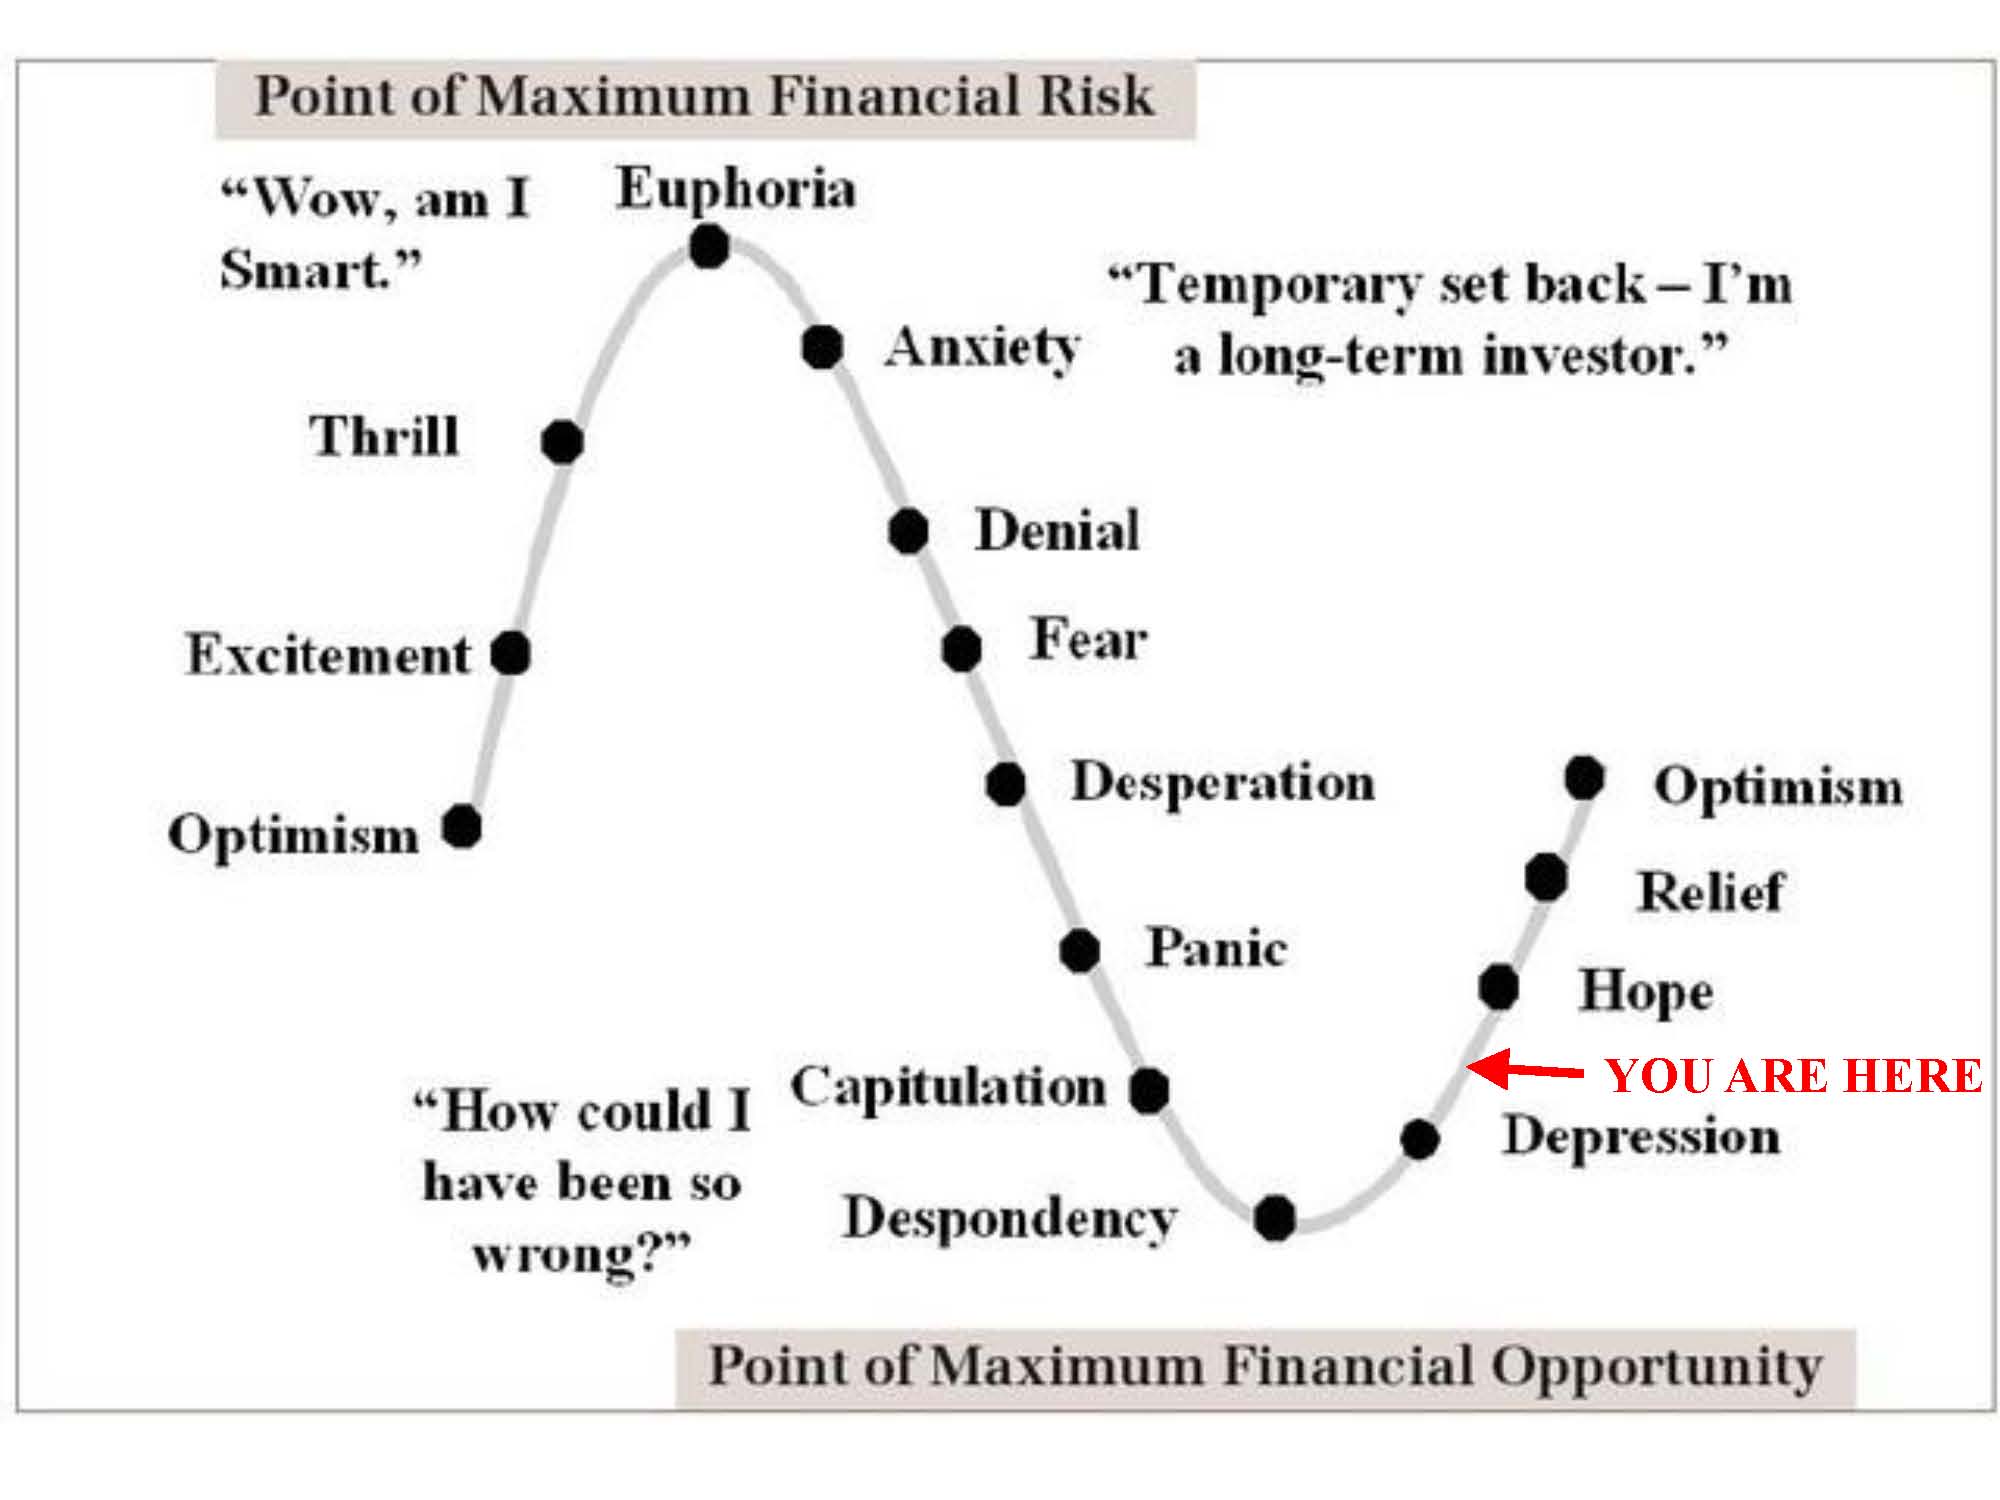
Barry Ritholtz at The Big Picture revisited the topic of sentiment cycles to hammer home the counterintuitive nature of successful investing (see also Doing the Opposite). As Ritholtz correctly points out in his chart, “euphoria” is actually the emotional “point of maximum financial risk,” and “despondency” is the “point of maximum financial opportunity.”
Source: The Big Picture with RED Sidoxia comments
In other words when the housing market was “euphoric” with demand in 2006, the financial risk was the highest, as millions of leveraged borrowers and homeowners painfully realized. Average investors suffered the reverse problem in early 2009 when “despondency” ruled the day and equity markets have marched upwards approximately +80% to +100%. Millions of investors bought real estate near the peak of the market and sold equities near the bottom of the market. Buying high and selling low is not a recipe for a retirement investment plan.
A more comedic representation of the sentiment cycle is provided below (CLICK TO ENLARGE). Laughable but spot on.

If investing was so simple, Jim Cramer would be among Forbes wealthiest top 10 and Lenny Dyskstra would have his private jet back (see story).
Where we are exactly on the sentiment cycle curve is debatable (my opinion is in RED on top chart), but if investors want to accelerate their path to financial success, they need to play the equity markets a lot more like a game of chess – anticipating future events not reacting to current ones. Too often, what appears as the obvious investment choice generates the worst long-term results. While on the investment rollercoaster, the choices that create the sweatiest palms are usually the best long-term decisions.
Read more about “Sentiment Cycles” from The Big Picture
Wade W. Slome, CFA, CFP®
Plan. Invest. Prosper.
DISCLOSURE: Sidoxia Capital Management (SCM) and some of its clients own certain exchange traded funds, but at the time of publishing SCM had no direct position in any other security referenced in this article. No information accessed through the Investing Caffeine (IC) website constitutes investment, financial, legal, tax or other advice nor is to be relied on in making an investment or other decision. Please read disclosure language on IC “Contact” page.
Will the Fiscal Donkey Fly?

Source: TopPayingIdeas.com/blog
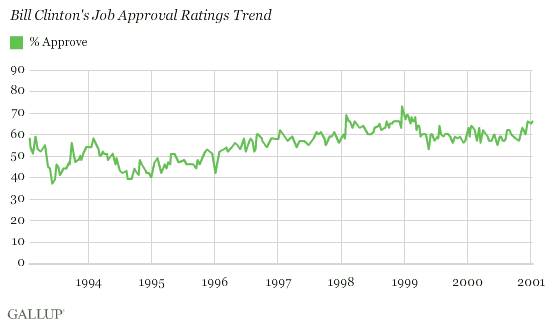
Will Barack Obama become a “one-termer” like somewhat recent Presidents, Democrat Jimmy Carter (1977-1981) and Republican George H.W. Bush #41 (1989-1993)? Or will Obama get the Democratic donkey off the ground like Bill Clinton managed to do after the 1994 mid-term election when Republican Newt Gingrich spearheaded the Contract with America, which led to a similar Republican majority in the House of Representatives. Clinton’s approval ratings were in the dumps at the time, comparable to voter’s current lackluster opinion of Obama and his spending spree (see also Profitless Healthcare).
Source: Gallup
Reagan Rebound
Similarly, Republican Ronald Reagan (1981-1989) was picking up the pieces with his lousy approval rating after the 1982 midterm election. Tax cuts, “trickle-down” supply side economics, and a tough stance on the Russian Cold War turned around the economy and his approval rating and catapulted him to reelection in a landslide victory. Reagan carried 49 states with the help of Reagan Democrats (one-quarter of registered Democrats voted for him).
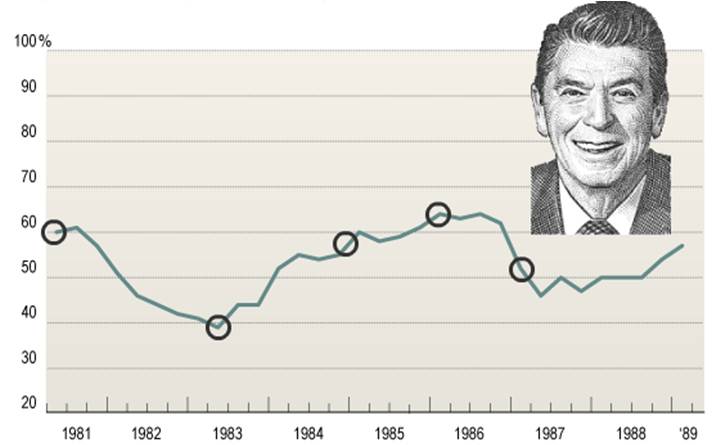
Source: The Wall Street Journal
One should be clear though, popularity is not the only factor that plays into reelection success. George H. W. Bush had the highest average approval rating in five decades (60.9% approval), only superseded by John F. Kennedy (70.1% approval). The economy, international politics, and other external factors also play a large role in the reelection process.
Flying Donkey Time?
If President Obama wants to get the Democratic donkey off the ground and raise his current approval rating of 47% and remedy his self-admitted “shellacking” by the Republicans, then he will need to shift his hard-left political agenda more towards the middle, like Clinton did in 1994. If he leads on ideology alone, then the next two years will likely be a long tough slog for him and his Democratic colleagues.
In order to shift toward the center and gain more Independent voters, Obama will need to find common ground with Republicans and Tea-Partiers. Obama has already conceded in principle to extend the Bush tax cuts, but if he wants to gain more political capital, he will have to gain some ground in the area of fiscal responsibility. With the help of a strong economy, Clinton managed to run surpluses, but front and center today is a $1.3 trillion deficit and over $13 trillion in debt. The first step in building any credibility on the issue will come on December 1st when the president’s bi-partisan commission for deficit reduction will release its report.
It will be interesting which party will show leadership in making unpopular spending cuts, just as the 2012 re-election cycle just begins. The elephants in the room are the entitlements (Medicare and Social Security), and although less talked about, efficient cuts to defense spending should be put on the table. Sure, pork barrel spending, inefficient subsidies, tax loopholes, are gaps that need to be filled, but they alone are rounding errors given our country’s unsustainable current circumstances. Whether or not politicians (red or blue) will point out the unpopular elephants in the room will be interesting to watch.
Financial irresponsibility at the consumer and corporate level were major drivers behind the 2008-2009 financial crisis, and both individuals and businesses are responsibly adjusting their expense structures and balance sheets. Our government has to wake up to reality and adjust its expense structure and balance sheet too. Although foreign countries have reacted (i.e., European austerity), egotistical American politicians on both sides of the aisle haven’t quite woken up and smelled the coffee yet. Thank goodness for the democracy that we live in because citizens are pointing to the elephants in the room and demanding reckless spending and debt levels to come under control. If President Barack Obama doesn’t want to become another one-termer, he’ll have to move more to the center and get the finances of our country under control. If the stubborn donkey refuses to deal with reality and remains flightless, hopefully an elephant or ship-full of tea partiers can get this grass roots call for fiscal sanity off the ground.
Wade W. Slome, CFA, CFP®
Plan. Invest. Prosper.
DISCLOSURE: Sidoxia Capital Management (SCM) and some of its clients own certain exchange traded funds, but at the time of publishing SCM had no direct position in any other security referenced in this article. No information accessed through the Investing Caffeine (IC) website constitutes investment, financial, legal, tax or other advice nor is to be relied on in making an investment or other decision. Please read disclosure language on IC “Contact” page.