Jobs and the DMV Economy

If you have ever gone to get your driver’s license at the Department of Motor Vehicles (DMV)…you may still be waiting in line? It’s a painful but often a mandatory process, and in many ways the experience feels a lot like the economic recovery we currently have been living through over the last four years. Steady progress is being made, but in general, people hardly notice the economy moving forward.
My geographic neighbor and blogger here in Orange County, California (Bill McBride – Calculated Risk) has some excellent visuals that compare our sluggish DMV economy with previous economic cycles dating back to 1948:
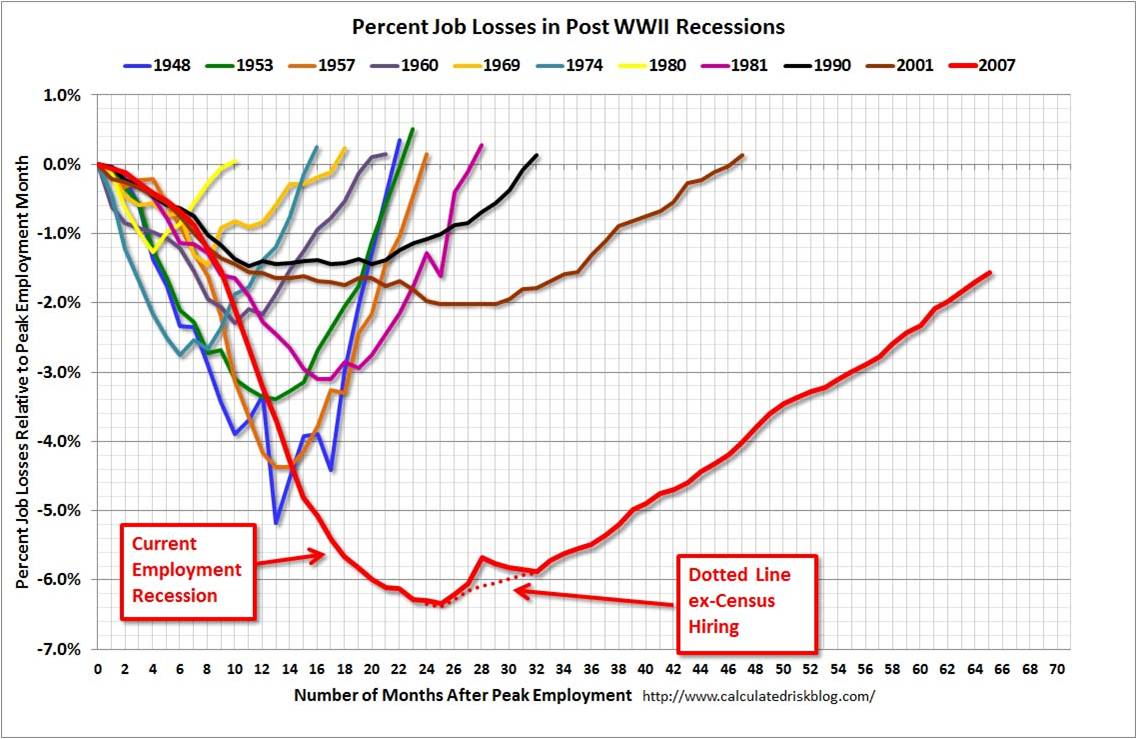
Source: Calculated Risk
As you can see from the chart above, the current economic recovery (red-line), as measured by job losses, is the slowest comeback in more than a half-century. Basically, over a two year period, the U.S. lost about nine million jobs, and during the following three years the economy regained approximately seven million of those jobs – still digging out of the hole. Last Friday’s June jobs report was welcomed, as it showed net jobs of +195,000 were added during the month, and importantly the previous two months were revised higher by another +70,000 jobs. These data points combined with last month’s Fed’s QE3 tapering comments by Ben Bernanke help explain why the continued rout in 10 year Treasury rates has continued in recent weeks, propelling the benchmark rate to 2.71% – almost double the 1.39% rate hit last year amidst continued European financial market concerns.
As with most recessions or crashes, the bursting of the bubble (i.e., damage) occurs much faster than the inflation (i.e., recovery), and McBride’s time series clearly shows this fact:

Source: Calculated Risk
While pessimists point to the anemic pace of the current recovery, the glass half-full people (myself included) appreciate that the sluggish rebound is likely to last longer than prior recoveries. There are two other key dynamics underlying the reported employment figures:
- Continued Contraction in Government Workers: Excessive government debt and deficits have led to continued job losses – state and local job losses appear to be stabilizing but federal cuts are ongoing.
- Decline in the Labor Force Participation Rate: Discouraged workers and aging Baby Boomer demographics have artificially lowered the short-term unemployment figures because fewer people are looking for work. If economic expansion accelerates, the participation contraction trend is likely to reverse.
Skepticism Reigns Supreme
Regardless of the jobs picture and multi-year expansion, investors and business managers alike remain skeptical about the sustainability of the economic recovery. Anecdotally I encounter this sentiment every day, but there are other data points that bolster my assertion. Despite the stock market more than doubling in value from the lows of 2009, CNBC viewer ratings are the weakest in about 20 years (see Value Walk) and investments in the stock market are the lowest in 15 years (see Gallup poll chart below):

Source: Gallup
Why such skepticism? Academic research in behavioral finance highlights innate flaws in human decision-making processes. For example, humans on average weigh losses twice as much as gains as economist and Nobel prizewinner Daniel Kahneman explains in his book Thinking Fast and Slow (see Investing Caffeine article: Decision Making on Freeways and in Parking Lots). Stated differently, the losses from 2008-2009 are still too fresh in the minds of Americans. Until the losses are forgotten, and/or the regret of missing gains becomes too strong, many investors and managers will fearfully remain on the sideline.
The speed of our economic recovery is as excruciatingly agonizing, and so is waiting in line at the DMV. The act of waiting can be horrific, but obtaining a driver’s license is required for driving and investing is necessary for retirement. If you don’t want to go to investing jail, then you better get in the investing line now before job growth accelerates, because you don’t want to be sent to the back of the line where you will have to wait longer.
Wade W. Slome, CFA, CFP®
Plan. Invest. Prosper.
DISCLOSURE: Sidoxia Capital Management (SCM) and some of its clients hold positions in certain exchange traded funds (ETFs), but at the time of publishing, SCM had no direct position in any other security referenced in this article. No information accessed through the Investing Caffeine (IC) website constitutes investment, financial, legal, tax or other advice nor is to be relied on in making an investment or other decision. Please read disclosure language on IC Contact page.
Hammering Heads with Circular Conversations

This article is an excerpt from a previously released Sidoxia Capital Management complementary newsletter (July 1, 2013). Subscribe on the right side of the page for a complete monthly update.
Deciphering what is driving the markets on a day-to-day, week-to-week, or month-to-month basis can feel like repeatedly hammering your head. In order to grasp the reasons why financial markets go up and down, one must have a conversation with your brain explaining that good news can be bad for asset prices, and bad news can be good for asset prices. Huh…how can that be? These circular conversations are what keep newspapers, magazines, media commentators, and bloggers in business… and what baffle many investors.
For example, headlines often reflect sentiments such as these:
- “Unemployment Figures Disappoint…Dow Jones Rallies +200 Points on QE3 Continuation Hopes”
- “Unemployment Figures Delight…Dow Jones Tanks -200 Points on QE3 Discontinuation Fears”
- “Economic Figures Revised Lower by -0.2%…Dow Jones Skyrockets +200 Points as Lower Interest Rates Propel Stock Prices.”
- “Economic Figures Revised Higher by +0.2%…Dow Jones Plummets -200 Points as Higher Interest Rates Deflate Stock Prices.”
On rare occasions these headlines make sense, but often online media outlets are frantically changing the headlines as the markets whip back and forth from positive to negative. News-producing editors are continually forced to create ludicrous and absurd explanations that usually make no sense to informed long-term investors.
It’s important to recognize that if the financial markets made common sense, then investing for retirement would be simple and everyone would be billionaires. Unfortunately, financial markets frequently make no sense in the short-run. Stocks are volatile (often times for no rational reason), which is why stocks offer higher returns over the long-run relative to more stable asset classes.
Explaining the latest spike in stock/bond price volatility has been exacerbated in recent weeks as a result of the nation’s banker (the Federal Reserve) and its boss, Ben Bernanke, attempting to explain their future monetary policy plans. In theory, bringing light to a traditionally mysterious, closed-door Washington process should be a good thing…right?
Well, ever since a few weeks ago when Ben Bernanke and the FOMC (Federal Open Market Committee) disclosed that the stimulative bond buying program (QE3) could be slowed in 2013 and halted in 2014, financial markets globally experienced a sharp jolt of volatility – stock prices dropped and interest rates spiked. Counter-intuitively, Bernanke’s belief that the economy is on a sustained recovery path (expected GDP growth of +3.25% in both 2014 & 2015) spooked investors. More specifically, in the month of June, the S&P 500 index declined -1.5% in June; Dow Jones Industrial Index -1.4%; and the 10-year Treasury note’s yield jumped +0.3% to 2.5%. Greedy investors, however, should not forget that the stock market just posted its 2nd best quarter since 2009 – the S&P 500 climbed +2.4%. What’s more, the S&P 500 is up +13% and the Dow up +14% in the first half of 2013.
Bernanke Threatening to Take Away Investor Lollipops
Another way of looking at the recent volatility is by equating investors to kids and stimulative QE bond buying programs (Quantitative Easing) to lollipops. If the economy continues on this improvement trajectory (i.e., unemployment falls to 7% by next year) and inflation remains benign (below 2.5%), then Bernanke said he will take away investors’ QE lollipops. But like a pushover dad being pressured by kids at the candy store, Bernanke acknowledged that he could continue supplying investors QE lollipops, if the economic data doesn’t improve at the forecasted pace. At face value, receiving a specific timeline given by the Fed should be appreciated and normally people are happy to hear the Chairman speak rosily about the economy’s future. However, the mere thought of QE lollipops being taken away next year was enough to push investors into a “taper tantrum” (see also Investing Caffeine – Fed Fatigue article).
With scary headlines constantly circulating, a large proportion of investors are sitting on their hands (and cash) while staring like deer in headlights at these developments. Rather than a distracted driver texting, investors should be watching the road and mapping out their future investment destinations – not paying attention to irrelevant diversions. Astute investors realize that uncertainty surrounding Greece, Cyprus, fiscal cliff, sequestration, presidential elections, Iran, N. Korea, Syria, Turkey, taxes, QE3, etc., etc., etc., have been a constant. Regrettably the fear mongers paying attention to these useless headlines have witnessed their cash, gold, and Treasuries get trounced by equity returns since early 2009 (the S&P 500 index is up about +150%, including dividends). Optimists and realists, on the other hand, have seen their investment plans thrive. While the aforementioned list of concerns has dangled in front of our noses over the last year, we will have a complete new list of concerns to decipher over the coming weeks, months, and years. That’s the price a long-term investor pays if they want to earn higher returns in the volatile equity markets.
As strategist Don Hays points out, “Nothing is certain. Good investors love uncertainty.” Rather than getting consumed by fear with the endless number of changing uncertainties, the real risk for investors is outliving your savings. Paychecks are being stretched by inflationary pressures across all categories (e.g., healthcare, gasoline, utilities, food, movies, travel, etc.) and entitlements like Social Security and Medicare will likely not mean the same thing to us as it did for our parents. Unless investors plan on working into their 80s as greeters at Wal-Mart, and/or enjoy clipping Top Ramen coupons in a crammed apartment, then they should do themselves a favor by taking a deep breath and turning off the television, so they can be insulated from the constant doom and gloom.
So as intimidating, circular conversations about good news being bad news, and bad news being good news continue to swirl around, focus instead on building a diversified investment plan that can adjust and adapt to the never-ending list of uncertainties. Your head will feel a lot better than it would after repetitive hammer strikes.
Wade W. Slome, CFA, CFP®
Plan. Invest. Prosper.
DISCLOSURE: Sidoxia Capital Management (SCM) and some of its clients hold positions in certain exchange traded funds (ETFs) and WMT, but at the time of publishing, SCM had no direct position in any other security referenced in this article. No information accessed through the Investing Caffeine (IC) website constitutes investment, financial, legal, tax or other advice nor is to be relied on in making an investment or other decision. Please read disclosure language on IC Contact page.
Fed Fatigue Setting In

Uncle…uncle! There you have it – I have finally cried “uncle” because I cannot take it anymore. I don’t think I can listen to another panel or read another story debating about the timing of Fed “tapering”, or heaven forbid the Fed actually “tighten” the Federal Funds rate (i.e., increasing the targeted rate for inter-bank lending). Type in the words “Bernanke” and “tapering” into Google and you will get back more than 41,000,000 results. The build up to the 600-word FOMC (Federal Open Market Committee) statement was almost deafening, so much so that live coverage of Federal Reserve Chairman Ben Bernanke was available at your fingertips:

Source: Yahoo! Finance
Like a toddler (or a California-based, investment blog writer) going to the doctor’s office to receive an inoculation, the anxiety and mental anguish caused in anticipation of the event is often more painful than the actual injection. As I highlighted in a previous Investing Caffeine article, the 1994 interest rate cycle wasn’t Armageddon for equity markets, and the same can be said for the rate hikes from 1.0% to 5.25% in the 2004-20006 period (see chart below). Even if QE3 ends in mid-2014 and the new Federal Reserve Chairman (thank you President Obama) raises rates in 2015, this scenario would not be the first (or last) time the Federal Reserve has tightened monetary policy.
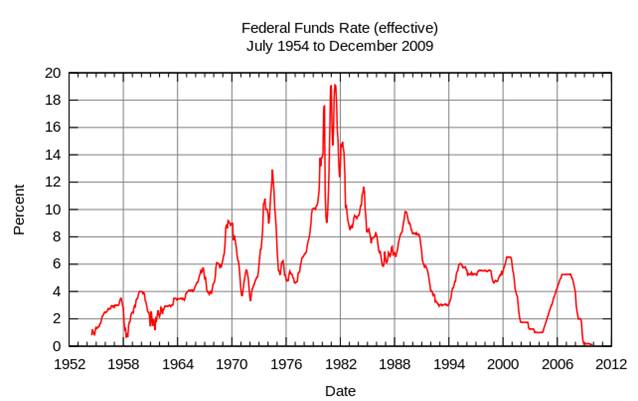
Source: Wikipedia
Short Memories – What Have You Done for Me Lately?
People are quick to point out the one-day -350 Dow point loss earlier this week, but many of them forget about the +3,000 point moon shot in the Dow Jones Industrial index that occurred in six short months (November 2012 – May 2013). The same foggy recollection principle applies to interest rates. The recent rout in 10-year Treasury prices is easily recalled as rates have jumped from 1.5% to 2.5% over the last year, however amnesia often sets in for others if you ask them where rates were a few years ago. It’s easy to forget that 30-year fixed rate mortgages exceeded 5% and the 10-year reached 4% just three short years ago.
Bernanke: The Center of the Universe?
Does Ben Bernanke deserve credit for implementing extraordinary measures during extraordinary times during the 2008-09 financial crisis? Absolutely. But should every man, women, and child wait with bated breath to see if a word change or tonal adjustment is made in the eight annual FOMC meetings?
Like the public judging Ben Bernanke, my Sidoxia clients probably give me too much credit when things go well and too much blame when things don’t. I love how Bernanke gets blamed/credited for the generational low interest rates caused by his money printing ways and QE punch bowl tactics. Last I checked, the interest rate downtrend has been firmly in place over the last three decades, well before Bernanke came into the Fed and worked his monetary magic. How much credit/blame are we forgetting to give former Federal Reserve Chairmen Paul Volcker, Alan Greenspan, and other government policy-makers? Regardless of what happens economically for the remainder of 2013, Bernanke will do whatever he can to solidify his legacy in the waning sunset months of his term.
Another forgotten fact I like to point out: There is more than one central banker living on this planet. If you haven’t been asleep over the last few decades, our financial markets have increasingly become globally interconnected with the assistance of technology. I know our 10-year Treasury rates are hovering around 2.50%, and our egotistical patriotism leads us to hail Bernanke as a monetary god, but don’t any other central bankers or government officials around the world deserve any recognition for achieving yields even lower than ours? Here’s a partial list (June 22, 2013 – Financial Times):
- Japan – 0.86%
- Germany – 1.67%
- Canada – 2.33%
- U.K. – 2.31%
- France – 2.27%
- Sweden – 2.15%
- Austria – 2.09%
- Switzerland – 0.92%
- Netherlands – 2.07%
Although it may be fun to look at Ben Bernanke as our country’s financial Superman who is there to save the day, there are a lot more important factors to consider than the 47 words added and 19 subtracted from the latest FOMC statement. If investing was as easy as following central bank monetary policy, everyone would be continually jet setting to their private islands. Rather than wasting your time listening to speculative blathering about direction of Fed monetary policy, why not focus on finding solid investment ideas and putting a long-term investment plan in place. Now please excuse me – Fed fatigue has set in and I need to take a nap.
Wade W. Slome, CFA, CFP®
Plan. Invest. Prosper.
DISCLOSURE: Sidoxia Capital Management (SCM) and some of its clients hold positions in certain exchange traded funds (ETFs) and GOOG, but at the time of publishing, SCM had no direct position in any other security referenced in this article. No information accessed through the Investing Caffeine (IC) website constitutes investment, financial, legal, tax or other advice nor is to be relied on in making an investment or other decision. Please read disclosure language on IC Contact page.
U.S. Small-Caps Become Global Big Dog

With the emerging market currencies and financial markets under attack; Japan’s Nikkei index collapsing in the last three weeks; and the Federal Reserve hinting about its disciplinarian tapering of $85 billion in monthly QE3 bond purchases, one would expect higher beta small cap stocks to get hammered in this type of environment.
Before benchmarking results in the U.S., let’s take a closer look at some of the international carnage occurring from this year’s index value highs:
- Japan: -19% (Nikkei 225 index)
- Brazil: -22% (IBOVESPA index)
- Hong Kong: -12% (Hang Seng index)
- Russia: -19% (MICEX/RTS indexes)
Not a pretty picture. Given this international turmoil and the approximately -60% disintegration in U.S. small-cap stock prices during the 2007-2009 financial crisis, surely these economically sensitive stocks must be getting pummeled in this environment? Well…not necessarily.
Putting the previously mentioned scary aspects aside, let’s not forget the higher taxes, Sequestration, and ObamaCare, which some are screaming will push us off a ledge into recession. Despite these headwinds, U.S. small-caps have become the top dog in global equity markets. Since the March 2009 lows, the S&P 600 SmallCap index has more than tripled in value ( about +204%, excluding dividends), handily beating the S&P 500 index, which has advanced a respectable +144% over a similar timeframe. Even during the recent micro three-week pullback/digestion phase, small cap stocks have retreated -2.8% from all-time record highs (S&P 600 index). Presumably higher dividend, stable, globally-diversified, large-cap stocks would hold up better than their miniature small-cap brethren, but that simply has not been the case. The S&P 500 index has underperformed the S&P 600 by about -80 basis points during this limited period.
How can this be the case when currencies and markets around the world are under assault? Attempting to explain short-term moves in any market environment is a hazardous endeavor, but that has never slowed me down in trying. I believe these are some of the contributing factors:
1) No Recession. There is no imminent recession coming to the U.S. As the saying goes, we hear about 10 separate recessions before actually experiencing an actual recession. The employment picture continues to slowly improve, and the housing market is providing a slight tailwind to offset some the previously mentioned negatives. If you want to fill that half-full glass higher, you could even read the small-cap price action as a leading indicator for a pending acceleration in a U.S. cyclical recovery.
2) Less International. The United States is a better house in a shaky global neighborhood (see previous Investing Caffeine article), and although small cap companies are expanding abroad, their exposure to international markets is less than their large-cap relatives. Global investors are looking for a haven, and U.S. small cap companies are providing that service now.
3) Inflation Fears. Anxiety over inflation never seems to die, and with the recent +60 basis point rise in 10-year Treasury yields, these fears appear to have only intensified. Small-cap stocks cycle in and out of favor just like any other investment category, so if you dig into your memory banks, or pull out a history book, you will realize that small-cap stocks significantly outperformed large-caps during the inflationary period of the 1970s – while the major indexes effectively went nowhere over that decade. Small-cap outperformance may simply be a function of investors getting in front of this potential inflationary trend.
Following the major indexes like the Dow Jones Industrials index and reading the lead news headlines are entertaining activities. However, if you want to become a big dog in the investing world and not get dog-piled upon, then digging into the underlying trends and market leadership dynamics of the market indexes is an important exercise.
Wade W. Slome, CFA, CFP®
Plan. Invest. Prosper.
DISCLOSURE: Sidoxia Capital Management (SCM) and some of its clients hold positions in certain exchange traded funds (ETFs) including emerging market ETFs, IJR, and EWZ, but at the time of publishing, SCM had no direct position in Hong Kong ETFs, Japanese ETFs, Russian ETFs, or any other security referenced in this article. No information accessed through the Investing Caffeine (IC) website constitutes investment, financial, legal, tax or other advice nor is to be relied on in making an investment or other decision. Please read disclosure language on IC Contact page.
1994 Bond Repeat or 2013 Stock Defeat?

Interest rates are moving higher, bond prices are collapsing, and fear regarding a stock market plunge is palpable. Sound like a recent news headline or is this a description of a 1994 financial market story? For those with a foggy, double-decade-old memory, here is a summary of the 1994 economic environment:
- The economy registered its 34th month of expansion and the stock market was on a record 40-month advance
- The Federal Reserve embarked on its multi-hike, rate-tightening monetary policy
- The 10-year Treasury note exhibited an almost 2.5% jump in yields
- Inflation was low with a threat of rising inflation lurking in the background
- An upward sloping yield curve encouraged speculative bond carry-trade activity (borrow short, invest long)
- Globalization and technology sped up the pace of price volatility
Many of these listed items resemble factors experienced today, but bond losses in 1994 were much larger than the losses of 2013 – at least so far. At the time, Fortune magazine called the 1994 bond collapse the worst bond market loss in history, with losses estimated at upwards of $1.5 trillion. The rout started with what might have appeared as a harmless 0.25% increase in the Federal Funds rate (the rate that banks lend to each other) from 3% to 3.25% in February 1994. By the time 1994 came to a close, acting Federal Reserve Chairman Alan Greenspan had jacked up this main monetary tool by 2.5%.
Rising rates may have acted as the flame for bond losses, but extensive use of derivatives and leverage acted as the gasoline. For example, over-extended Eurobond positions bought on margin by famed hedge fund manager Michael Steinhardt of Steinhardt Partners lead to losses of about-30% (or approximately $1.5 billion). Renowned partner of Omega Partners, Leon Cooperman, took a similar beating. Cooperman’s $3 billion fund cratered -24% during the first half of 1994. Insurance company bond portfolios were hit hard too, as collective losses for the industry exceeded $20 billion, or more than the claims paid for Hurricane Andrew’s damage. Let’s not forget the largest casualty of this era – the public collapse of Orange County, California. Poor derivatives trades led to $1.7 billion in losses and ultimately forced the county into bankruptcy.
There are plenty of other examples, but suffice it to say, the pain felt by other bond investors was widespread as a massive number of margin calls caused a snowball of bond liquidations. The speed of the decline was intensified as bond holders began selling short and using derivatives to hedge their portfolios, accelerating price declines.
Just as the accommodative interest rate punch bowl was eventually removed by Greenspan, so too is Ben Bernanke (current Fed Chairman) threatening to do today. Even if Bernanke unleashes a cold-turkey tapering of the $85 billion per month in bond-purchases, massive losses in bond values won’t necessarily mean catastrophe for stock values. For evidence, one needs to look no further than this 1994-1995 chart of the stock market:
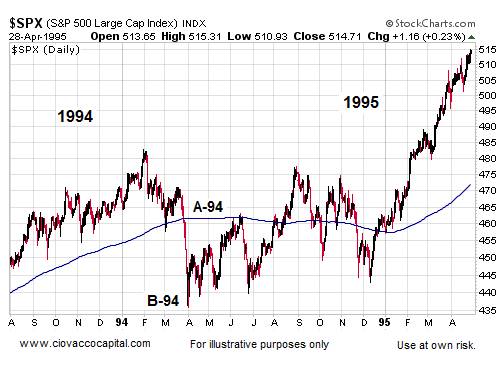
Source: Ciovaccocapital.com
Volatility for stocks definitely increased in 1994 with the S&P 500 index correcting about -10% early in the year. But as you can see, by the end of the year the market was off to the races, tripling in value over the next five years. Volatility has been the norm for the current bull market rally as well. Despite the more than doubling in stock prices since early 2009, we have experienced two -20% corrections and one -10% pullback.
What’s more, the onset of potential tapering is completely consistent with core economic principles. Capitalism is built on free trading markets, not artificial intervention. Extraordinary times required extraordinary measures, but the probabilities of a massive financial Armageddon have been severely diminished. As a result, the unprecedented scale of quantitative easing (QE) will eventually become more harmful than beneficial. The moral of the story is that volatility is always a normal occurrence in the equity markets, therefore any significant stock pullback associated with potential bond tapering (or fed fund rate hikes) shouldn’t be viewed as the end of the world, nor should a temporary weakening in stock prices be viewed as the end to the bull market in stocks.
Why have stocks historically provided higher returns than bonds? The short answer is that stocks are riskier than bonds. The price for these higher long-term returns is volatility, and if investors can’t handle volatility, then they shouldn’t be investing in stocks.
If you are an investor that thinks they can time the market, you wouldn’t be wasting your time reading this article. Rather, you’d be spending time on your personal island while drinking coconut drinks with umbrellas (see Market Timing Treadmill).
Although there are some distinct similarities between the economic backdrop of 1994 and 2013, there are quite a few differences also. For starters, the economy was growing at a much healthier clip then (+4.1% GDP growth), which stoked inflationary fears in the mind of Greenspan. Moreover, unemployment was quite low (5.5% by year-end vs. 7.6% today) and the Fed did not communicate forward looking Fed policy back then.
It’s unclear if the recent 50 basis point ascent in 10-year Treasury rates was just an appetizer for what’s to come, but simple mathematics indicate there is really only one direction left for interest rates to go…higher. If history repeats itself, it will likely be bond investors choking on higher rates (not stock investors). For the sake of optimistic bond speculators, I hope Ben Bernanke knows the Heimlich maneuver. Studying history may help bond bulls avoid indigestion.
Wade W. Slome, CFA, CFP®
Plan. Invest. Prosper.
DISCLOSURE: Sidoxia Capital Management (SCM) and some of its clients hold positions in certain exchange traded funds (ETFs), but at the time of publishing SCM had no direct position in any other security referenced in this article. No information accessed through the Investing Caffeine (IC) website constitutes investment, financial, legal, tax or other advice nor is to be relied on in making an investment or other decision. Please read disclosure language on IC Contact page.
What’s Going on with This Crazy Market?!

The massive rally of the stock market since March 2009 has been perplexing for many, but the state of confusion has reached new heights as the stock market has surged another +2.0% in May, surpassing the Dow 15,000 index milestone and hovering near all-time record highs. Over the last few weeks, the volume of questions and tone of disbelief emanating from my social circles has become deafening. Here are some of the questions and comments I’ve received lately:
“Wade, why in the heck is the market up so much?”; “This market makes absolutely no sense!”; “Why should I buy at the peak when I can buy at the bottom?”; “With all this bad news, when is the stock market going to go down?”; “You must be shorting (betting against) this market, right?”
If all the concerns about the Benghazi tragedy, IRS conservative targeting, and Federal Reserve bond “tapering” are warranted, then it begs the question, “How can the Dow Jones and other indexes be setting new all-time highs?” In short, here are a few reasons:
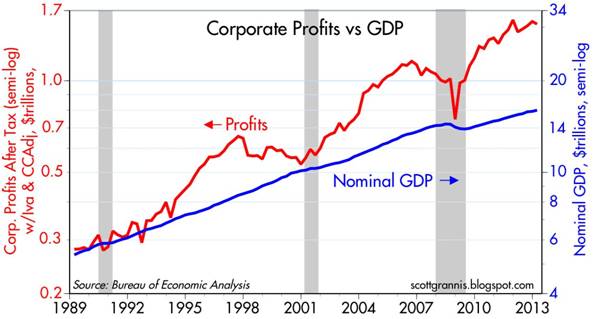
You hear a lot of noise on TV and read a lot of blathering in newspapers/blogs, but what you don’t hear much about is how corporate profits have about tripled since the year 2000 (see red line in chart above), and how the profit recovery from the recent recession has been the strongest in 55 years (Scott Grannis). The profit collapse during the Great Recession was closely chronicled in nail-biting detail, but a boring profit recovery story sells a lot less media advertising, and therefore gets swept under the rug.
II.) Reasonable Prices (Comparing Apples & Oranges):
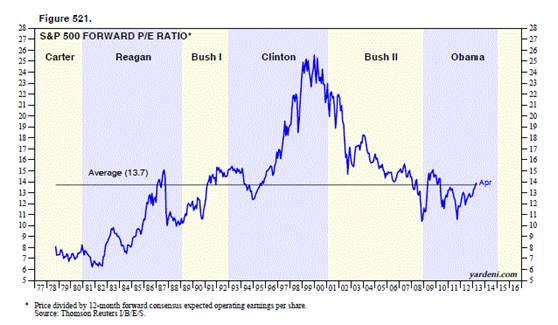
Source: Dr. Ed’s Blog
The Price-Earnings ratio (P/E) is a general barometer of stock price levels, and as you can see from the chart above (Ed Yardeni), current stock price levels are near the historical average of 13.7x – not at frothy levels experienced during the late-1990s and early 2000s.
Comparing Apples & Oranges:

At the most basic level of analysis, investors are like farmers who choose between apples (stocks) and oranges (bonds). On the investment farm, growers are generally going to pick the fruit that generates the largest harvest and provide the best return. Stocks (apples) have historically offered the best prices and yielded the best harvests over longer periods of time, but unfortunately stocks (apples) also have wild swings in annual production compared to the historically steady crop of bonds (oranges). The disastrous apple crop of 2008-2009 led a massive group of farmers to flood into buying a stable supply of oranges (bonds). Unfortunately the price of growing oranges (i.e., buying bonds) has grown to the highest levels in a generation, with crop yields (interest rates) also at a generational low. Even though I strongly believe apples (stocks) currently offer a better long-term profit potential, I continue to remind every farmer (investor) that their own personal situation is unique, and therefore they should not be overly concentrated in either apples (stocks) or oranges (bonds).
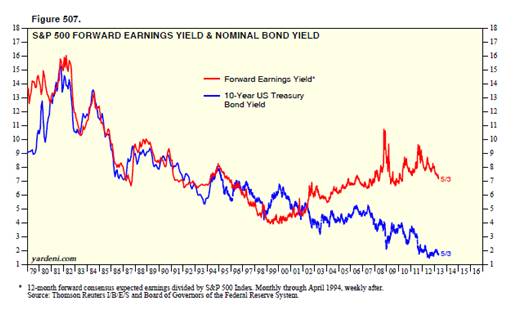
Source: Dr. Ed’s Blog
Regardless, you can see from the chart above (Dr. Ed’s Blog), the red line (stocks) is yielding substantially more than the blue line (bonds) – around 7% vs. 2%. The key for every investor is to discover an optimal balance of apples (stocks) and oranges (bonds) that meets personal objectives and constraints.
III.) Skepticism (Market Climbs a Wall of Worry):

Source: Calafia Beach Pundit
Although corporate profits are strong, and equity prices are reasonably priced, investors have been withdrawing hundreds of billions of dollars from equity funds (negative blue lines in chart above – Calafia Beach Pundit). While the panic of 2008-2009 has been extinguished from average investors’ psyches, the Recession in Europe, slowing growth in China, Washington gridlock, and the fresh memories of the U.S. financial crisis have created a palpable, nervous skepticism. Most recently, investors were bombarded with the mantra of “Selling in May, and Going Away” – so far that advice hasn’t worked so well. To buttress my point about this underlying skepticism, one need not look any further than a recent CNBC segment titled, “The Most Confusing Market Ever” (see video below):
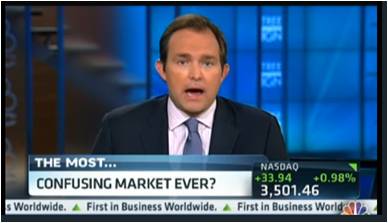
Source: CNBC
It’s clear that investors remain skittish, but as legendary investor Sir John Templeton so aptly stated, “Bull markets are born on pessimism, grow on skepticism, mature on optimism and die on euphoria.” The sentiment pendulum has been swinging in the right direction (see previous Investing Caffeine article), but when money flows sustainably into equities and optimism/euphoria rules the day, then I will become much more fearful.
Being a successful investor or a farmer is a tough job. I’ll stop growing apples when my overly optimistic customers beg for more apples, and yields on oranges also improve. In the meantime, investors need to remember that no matter how confusing the market is, don’t put all your oranges (bonds) or apples (stocks) in one basket (portfolio) because the financial markets do not need to get any crazier than they are already.
Wade W. Slome, CFA, CFP®
Plan. Invest. Prosper.
DISCLOSURE: Sidoxia Capital Management (SCM) and some of its clients hold positions in certain exchange traded funds (ETFs), but at the time of publishing SCM had no direct position in any other security referenced in this article. No information accessed through the Investing Caffeine (IC) website constitutes investment, financial, legal, tax or other advice nor is to be relied on in making an investment or other decision. Please read disclosure language on IC Contact page.
Construction Complete on New & Improved Sidoxia.com Website

After five years in business, Sidoxia decided it was time to give its website a digital facelift. As part of the home page remodel, a number of new features and fresh content have been added to streamline the site.

Overall, we are proud of our newly constructed website because we strongly believe it accurately reflects our values (i.e., Philosophy & Investment Approach) and clarifies the differentiated servicesSidoxia brings to the marketplace.
Here are a few additional highlights:
![]() Videos Page: Through a collection of four videos, President & Founder Wade Slome provides an overview of the firm, and also speaks to Sidoxia’s investing process and philosophy.
Videos Page: Through a collection of four videos, President & Founder Wade Slome provides an overview of the firm, and also speaks to Sidoxia’s investing process and philosophy.
 Books Page: Besides investing money and providing financial planning services for clients, Mr. Slome shares financial experiences and views through two different books available for purchase on Amazon.com.
 Blog (Investing Caffeine): Keeping in-tune with the ebbs and flows of the financial markets is critical in order to provide our clients with leading-edge service. Since 2009, Investing Caffeine has provided thousands of monthly viewers with insightful and educational financial material.
Take a look around the site and let us know what you think!
Sidoxia.com
Plan. Invest. Prosper.
DISCLOSURE: Sidoxia Capital Management (SCM) and some of its clients hold positions in certain exchange traded funds (ETFs), but at the time of publishing SCM had no direct position in any other security referenced in this article. No information accessed through the Investing Caffeine (IC) website constitutes investment, financial, legal, tax or other advice nor is to be relied on in making an investment or other decision. Please read disclosure language on IC Contact page.
Women & Bosoms on Wall Street According to Jones

Billionaire hedge fund manager of Tudor Investment Corporation, Paul Tudor Jones, recently suffered from a case of foot-in-mouth disease when he addressed a sensitive subject – the lack of female traders and investors on Wall Street. Rather than provide a diplomatic response to the mixed audience at a recent University of Virginia symposium, Tudor Jones went on an unambiguous rant. Here’s an excerpt:
“You will never see as many great women investors or traders as men. Period, end of story….As soon as that baby’s lips touch that girl’s bosom, forget it. Every single investment idea, every desire to understand what’s going to make this go up or gonna go down is going to be overwhelmed by the most beautiful experience, which a man will never share of that emotive connection between that mother and baby.”
A more complete review of his unfiltered response can be found in this video:
Clearly there is a massive minority of females on Wall Street, but why such an under-representation in this field relative to other female-heavy professional industries such as advertising, nursing, and teaching? I addressed this controversial subject in an earlier article (see Females in Finance)
If there are 155.8 million females in the United States and 151.8 million males (Census Bureau: October 2009), then how come only 6% of hedge fund managers (BusinessWeek), 8% of venture capitalists, and 15% of investment bankers are female (Harvard Magazine)? Is the finance field just an ol’ boys network of chauvinist pig-headed males who only hire their own? Maybe cultural factors such as upbringing and education are other factors that make math-related jobs more appealing to men? Or do the severe time-demands of the field force females to opt-out of the industry due to family priorities?
Although I’m sure family choices and quality of life are factors that play into the decision of entering the demanding finance industry, from my experience I would argue women are notoriously underrepresented even at younger ages. For example, anecdotal evidence coming from my investment management firm (Sidoxia Capital Management – www.Sidoxia.com) clearly shows a preponderance of internship applications coming from males, even though it is premature for these students to fully contemplate family considerations at this young age.
If under-representation in the finance field is not caused by female choice, then perhaps the male dominated industry is merely a function of more men opting into the field (i.e., men are better suited for the industry)? More specifically, perhaps male brains are just wired differently? Some make the argument that all the testosterone permeating through male bodies leads them to positions involving more risk. If you look at other risk related fields like gambling, women too are dramatic minorities, making up about 1/3 of total compulsive gamblers.
Women Better than Men?
The funny part about the under-representation of females in finance is that one study actually shows female hedge fund managers outperforming their male counterparts. Here’s what a BusinessWeek article had to say about female hedge fund managers:
A new study by Hedge Fund Research found that, from January 2000 through May 31, 2009, hedge funds run by women delivered nearly double the investment performance of those managed by men. Female managers produced average annual returns of 9%, versus 5.82% for men and, in 2008, when financial markets were cratering, funds run by women were down 9.6%, compared with a 19% decline for men.
The article goes onto to theorize that women may not be afraid of risk, but actually are better able to manage risk. A UC Davis study found that male managers traded 45% more than female managers, thereby reducing returns by -2.65% (about 1% more than females).
Regardless of the theories or studies used to explain gender risk appetite, the relative under-representation of females in finance is a fact. Many theories exist but further thought and research need to be conducted on the subject.
However, before Paul Tudor Jones is completely demonized or sent to the guillotine, let’s not forget Tudor Jones is obviously not your ordinary, heartless, cold-blooded Wall Street type, as evidenced by his recent philanthropic profile on 60 Minutes. Thanks to his generous efforts, Tudor Jones and his Robin Hood Foundation charity have raised more than $400 million for worthy causes since 1988.
While Paul Tudor Jones may not have harbored any malicious intent with regards to his comments, it may make sense for Tudor Jones to take a course on gender sensitivity. Bosoms and women may be an interesting subject for many, however he might consider filtering his commentary the next time he speaks to a large symposium recorded on the internet.
Wade W. Slome, CFA, CFP®
Plan. Invest. Prosper.
See also:
BusinessWeek article on female fund managers
DISCLOSURE: Sidoxia Capital Management (SCM) and some of its clients hold positions in certain exchange traded funds (ETFs), but at the time of publishing SCM had no direct position in any other security referenced in this article. No information accessed through the Investing Caffeine (IC) website constitutes investment, financial, legal, tax or other advice nor is to be relied on in making an investment or other decision. Please read disclosure language on IC Contact page.
No Free Lunch, No Free Sushi

Everybody loves a free lunch, myself included, and many in Japan would like free sushi too. Despite the short term boost in Japanese exports and Nikkei stock prices, there are no long-term free lunches (or free sushi) when it comes to global financial markets. Following in the footsteps of the U.S. Federal Reserve, the Bank of Japan (BOJ) has embarked on an ambitious plan of doubling its monetary base in two years and increasing inflation to a 2% annual rate – a feat that has not been achieved in more than two decades. By the BOJ’s estimate, it will take a $1.4 trillion injection into economy to achieve this goal by the end of 2014.
Lunch is tasty right now, as evidenced by a tasty appetizer of +3.5 % Japanese first quarter GDP and this year’s +46% spike in the value of the Nikkei. Japan is hopeful that its mix of monetary, fiscal, and structural policies will spur demand and increase the appetite for Japanese exports, however, we know fresh sushi can turn stale quickly.
Quantitative easing (QE) and monetary stimulus from central banks around the globe have been hailed as a panacea for sluggish global growth – most recently in Japan. Commentators often oversimplify the benefits of money printing without acknowledging the pitfalls. Basic economics and the laws of supply & demand eventually prevail no matter the fiscal or monetary policy implemented. Nonetheless, there can be temporary disconnects between current equity prices and exchange rates, before underlying fundamentals ultimately drive true intrinsic values.
Impassioned critics of the Federal Reserve and its Chairman Ben Bernanke would have you believe the money supply is exploding, and hyperinflation is just around the corner. It’s difficult to quarrel with the trillions of dollars created by the Fed’s printing presses via QE1/QE2/QE3, but the fact remains that money supply growth has continued at a steady growth rate – not exploding (see Calafia Beach Pundit chart below).
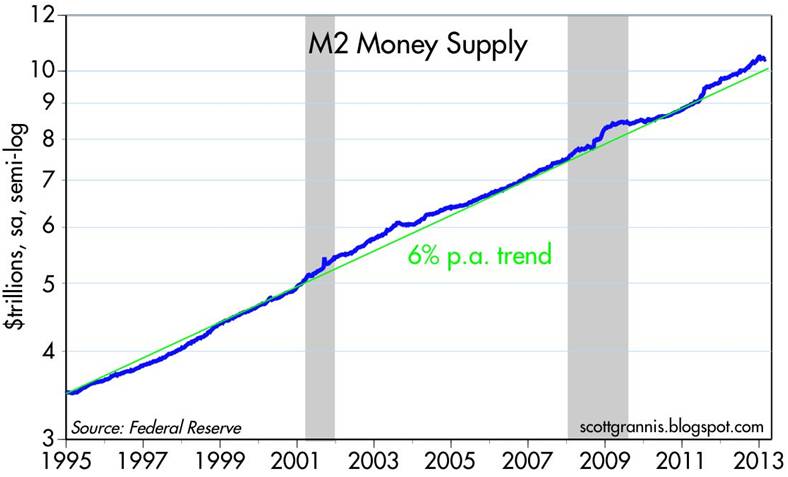
Source: Calafia Beach Pundit
Why no explosion in the money supply? Simply, the trillions of dollars printed by the Fed have sat idly in bank vaults as reserves. Once nervous consumers stop hoarding trillions in cash held in savings deposit accounts (see chart below) and banks begin lending at a healthier clip, then money supply growth will accelerate. By definition, money supply growth in excess of demand for goods and services (i.e., GDP) is the main cause of inflation.
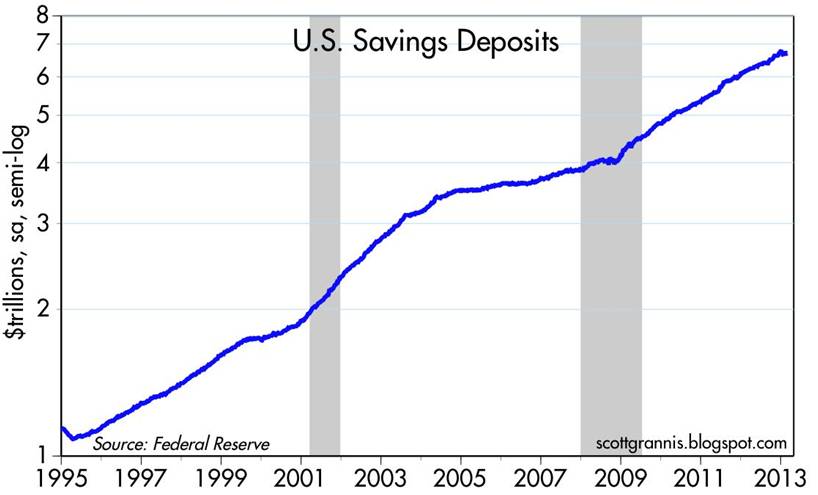
Source: Calafia Beach Pundit
Although inflationary pressure has not reared its ugly head yet, there are plenty of precursors indicating inflation may be on its way. The unemployment rate continues to tick downwards (7.5% in Aril) and the much anticipating housing recovery is gaining steam. Inflationary fear has manifested itself in part through the heightened number of conversations surrounding the Fed “tapering” its $85 billion per month bond purchasing program.
We’ve enjoyed a sustained period of low price level growth, however the Goldilocks period of little-to-no inflation cannot last forever. The differences between current prices and true value can exist for years, and as a result there are many different strategies attempted to capture profits. Like the gambling masses frequenting casinos, speculators can beat the odds in the short-run, but the house always wins in the long-run – hence the ever-increasing size and number of casinos. While a small number of professionals understand how to shift the unbalanced odds into their favor, most lose their shirt. On Wall Street, that is certainly the case. Studies show speculating day traders persistently lose about 80% of the time. Long-term investors are uniquely positioned to exploit these value disparities, if they have a disciplined process with the ability to patiently value assets.
Even though the Japanese economy and stock market have rebounded handsomely in the short-run, there is never a free lunch over the long-term. Unchecked policies of money printing, deficits, and debt expansion won’t lead to boundless prosperity. Eventually a spate of irresponsible actions will result in inflation, defaults, recessions, and/or higher unemployment rates. Unsustainable monetary and fiscal stimulus may lead to a tasty free lunch now, but if investors overstay their welcome, the sushi may turn bad and the speculators will be left paying the hefty tab.
Wade W. Slome, CFA, CFP®
Plan. Invest. Prosper.
DISCLOSURE: Sidoxia Capital Management (SCM) and some of its clients hold positions in certain exchange traded funds (ETFs), but at the time of publishing SCM had no direct position in any other security referenced in this article. No information accessed through the Investing Caffeine (IC) website constitutes investment, financial, legal, tax or other advice nor is to be relied on in making an investment or other decision. Please read disclosure language on IC Contact page.
The Challenge of Defining Growth vs. Value

“A challenge only becomes an obstacle when you bow to it.”
― Ray Davis (Famous General in the Marines)
In the investing world, one major challenge is defining the differences between “growth” vs. “value”. Warren Buffett said it best when he described growth and value as two separate sides of the same coin. In general, low or declining growth will be valued less than a comparable company with faster growth. Often, most companies go through a life cycle just like a human would (see Equity Life Cycle). In other words, companies frequently start small, grow larger, mature, and then die. Of course, some companies never grow, or because of lack of funding or outsized losses, end up suffering an early death. It’s tough to generalize with companies, because some businesses are more cat-like than human. For example, Apple Inc. (AAPL) may not have had nine lives, but the stock has been left for dead several times during its lifespan, before managing to resurrect itself from value status to growth darling (with a little assistance from Steve Jobs). Whether Tim Cook can lead Apple back to the Promised Land of growth remains to be seen, but many investors still see value.
Fluctuating price and earnings trends over a company’s life cycle frequently create confusion surrounding the proper categorization of a stock as growth or value. The other frustrating aspect to this debate is the absence of a universally accepted definition of growth and value. A few specialty companies have chosen to address this challenge. Russell Investments in Seattle, Washington is a leader in the benchmark/index creation field. Russell tackles the definitional issue by creating quantitatively based definitions, tediously explained in a thrilling 44-page paper titled, “Construction and Methodology.” Here is an exhilarating excerpt:
“Russell Investments uses a ‘non-linear probability’ method to assign stocks to the growth and value style valuation indexes. Russell uses three variables in the determination of growth and value. On the value side, book-to-price is used, while on the growth side, the I/B/E/S long-term growth variable was replaced by two variables- I/B/E/S forecast medium-term growth (2 yr) and sales per share historical growth (5 yr).”
As I bite my tongue in sarcasm, I like to point out that these methodologies constantly change – Russell most recently changed their methodology in 2011. What’s more, there are numerous other indexing companies that define growth and value quite differently (e.g., Standard & Poor’s, Lipper, MSCI, etc.).
Like religious beliefs that are viewed quite differently and are prone to passionate arguments, so too can be the debates over growth vs. value categorization. I’ve been brainwashed by numerous great investors (see Investor Hall Fame), and underpinning my philosophy is the belief that price follows earnings (see It’s the Earnings Stupid). As a result, I am constantly on the lookout for attractively priced stocks that have strong growth prospects. If Russell or S&P looked under the hood of my client portfolios, I’m certain they would find a healthy mix of growth and value stocks, as they define it. If they looked in Warren Buffett’s portfolio, arguably similar conclusions could be made. Most observers call Buffett a value investor, but over Buffett’s career, he has owned some of the greatest growth stocks of all-time (e.g., Coca Cola (KO), American Express Co (AXP), and Procter & Gamble (PG)).
At the end of the day, expectations embedded in the value of share prices determine future appreciation or depreciation, depending on how actual results register relative to those expectations. If stock prices are too high (as measured by the P/E, Price/Free-Cash-Flow, or other valuation metrics), slowing growth can lead to sharp and painful price declines. On the flip side, cheap or reasonably priced stocks can experience significant price appreciation if earnings and cash flows sustainably improve or accelerate.
In my view, the greatest stock pickers think about investing like sports handicapping (see What Happens in Vegas, Stays in Las Vegas). The key isn’t buying fast growth (high P/E) or slow growth (low P/E) companies, but rather discovering which stocks are mispriced. Finding heavily shorted stocks that are poised for growth, or discovering unloved stocks with underappreciated potential are both ways to make money.
While defining growth vs. value is certainly difficult, the more important challenge is calibrating a company’s future growth expectations and determining the fair price to pay for a stock based on those prospects. Investing entails many difficulties, but categorizing investors or stocks as growth or value is a less important challenge than honing forecasting and valuation skills. Investing is challenging enough without worrying about superfluous growth vs. value definitions.
Wade W. Slome, CFA, CFP®
Plan. Invest. Prosper.
DISCLOSURE: Sidoxia Capital Management (SCM) and some of its clients hold positions in certain exchange traded funds (ETFs), and AAPL, but at the time of publishing SCM had no direct position in KO, AXP, PG, MHP, or any other security referenced in this article. No information accessed through the Investing Caffeine (IC) website constitutes investment, financial, legal, tax or other advice nor is to be relied on in making an investment or other decision. Please read disclosure language on IC Contact page.


