Searching for the Market Boogeyman

With the stock market reaching all-time record highs (S&P 500: 1900), you would think there would be a lot of cheers, high-fiving, and back slapping. Instead, investors are ignoring the sunny, blue skies and taking off their rose-colored glasses. Rather than securely sleeping like a baby (or relaxing during a three-day weekend) with their investment accounts, people are biting their fingernails with clenched teeth, while searching for a market boogeyman in their closets or under their beds.
If you don’t believe me, all you have to do is pick up the paper, turn on the TV, or walk over to the office water cooler. An avalanche of scary headlines that are spooking investors include geopolitical concerns in Ukraine & Thailand, slowing housing statistics, bearish hedge fund managers (i.e., Tepper Einhorn, Cooperman), declining interest rates, and collapsing internet stocks. In other words, investors are looking for things to worry about, despite record corporate profits and stock prices. Peter Lynch, the manager of the Magellan Fund that posted +2,700% in gains from 1977-1990, put short-term stock price volatility into perspective:
“You shouldn’t worry about it. You should worry what are stocks going to be 10 years from now, 20 years from now, 30 years from now.”
Rather than focusing on immediate stock market volatility and other factors out of your control, why not prioritize your time on things you can control. What investors can control is their asset allocation and spending levels (budget), subject to their personal time horizons and risk tolerances. Circumstances always change, but if people spent half the time on investing that they devoted to planning holiday vacations, purchasing a car, or choosing a school for their child, then retirement would be a lot less stressful. After realizing 99% of all the short-term news is nonsensical noise, the next important realization is stocks are volatile securities, which frequently go down -10 to -20%. As much as amateurs and professionals say or think they can profitably predict these corrections, they very rarely can. If your stomach can’t handle the roller-coaster swings, then you shouldn’t be investing in the stock market.
Bear-markets generally coincide with recessions, and since World War II, Americans experience about two economic contractions every decade. And as I pointed out earlier in A Series of Unfortunate Events, even during the current massive bull market, a recession has not been required to suffer significant short-term losses (e.g., Flash Crash, Greece, Arab Spring, Obamacare, Cyprus, etc.). Seasoned veterans understand these volatile periods provide incredible investment opportunities. As Warren Buffett states, “Be fearful when others are greedy, and be greedy when others are fearful.” Fear and panic may be behind us, but skepticism is still firmly in place. Buying during current skepticism is still not a bad thing, as long as greed hasn’t permeated the masses, which remains the case today.
Overly emotional people that make investment decisions with their gut do more damage to their savings accounts than conservative, emotional investors who understand their emotional shortcomings. On the other hand, the problem with investing too conservatively, for those that have longer-term time horizons (10+ years), is multi-pronged. For starters, overly conservative investments made while interest rate levels hover near historical lows lead to inflationary pressures gobbling up savings accounts. Secondly, the low total returns associated with excessively conservative investments will result in a later retirement (e.g., part-time Wal-Mart greeter in your 80s), or lower quality standard of living (e.g., macaroni & cheese dinners vs. filet mignon).
Most people say they understand the trade-offs of risk and return. Over the long-run, low-risk investments result in lower returns than high risk investments (i.e., bonds vs. stocks). If you look at the following chart and ask anyone what their preferred path would be over the long-run, almost everyone would select the steep, upward-sloping equity return line.
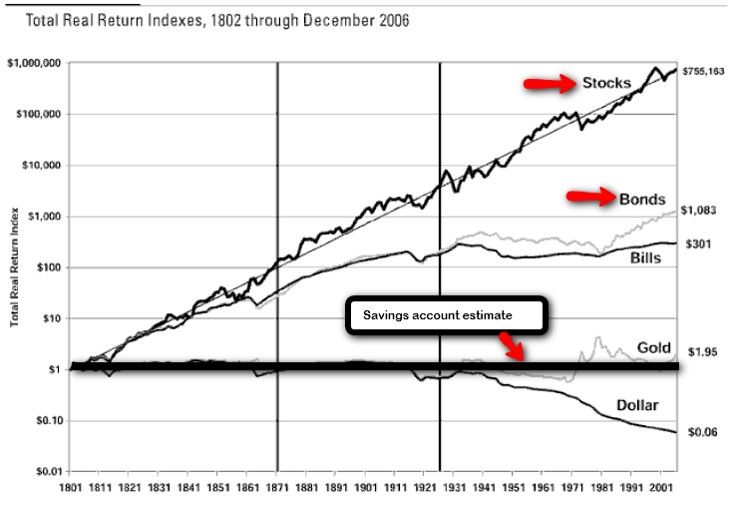
Source: Betterment.com / Stocks for the Long Run
Yet, stock ownership and attitudes towards stocks remain at relatively low and skeptical levels (see Gallup survey in Markets Soar and Investors Snore). It’s true that attitudes are changing at a glacial pace and bond outflows accelerated in 2013, but more recently stock inflows remain sporadic and scared money is returning to bonds. Even though it has been over five years, the emotional scars from 2008-2009 apparently still need some time to heal.
Investing in stocks can be very scary and hazardous to your health. For those millions of investors who realize they do not hold the emotional fortitude to withstand the ups and downs, leave the worrying responsibilities to the experienced advisors and investment managers like me. That way you can focus on your job and retirement, while the pros can remain responsible for hunting and slaying the boogeyman.
Wade W. Slome, CFA, CFP®
Plan. Invest. Prosper.
DISCLOSURE: Sidoxia Capital Management (SCM) and some of its clients hold long positions in certain exchange traded funds and WMT, but at the time of publishing SCM had no direct position in any other security referenced in this article. No information accessed through the Investing Caffeine (IC) website constitutes investment, financial, legal, tax or other advice nor is to be relied on in making an investment or other decision. Please read disclosure language on IC Contact page.
Rise of the Robo-Advisors: Paying to Do-It-Yourself

Robots and computers are taking over our lives. We see it in areas of our daily living, including the use of digitally driven cars, cell phones, automated vacuums, and electronic self-serve kiosks at the grocery store. And now robots have come into our investing and financial lives in the form of robo-advisors. With a few clicks of a computer mouse or taps on a smartphone, investors are hoping to find their way to financial nirvana.
What sites am I talking about? Here is a brief, albeit rapidly growing, list of popular robo-advisor sites:
Not all of these robo-sites invest individuals’ money, but nevertheless, there are several factors contributing to the upsurge in in these financial advice websites. For starters, there is a whole new, younger demographic pool of savers who have grown up with their iPhone and shop exclusively online for their goods and services. Many of these financial sites are trying to fill a void for this tech-savvy group looking for a new app to bring wealth and riches.
Another factor contributing to the rise of the robo-advisors is a function of the 2008-2009 financial crisis and the explosive growth of the multi-trillion dollar exchange traded fund (ETF) industry. Many baby boomers who were planning to retire were hit brutally hard by the financial crisis and subsequently asked themselves why they were paying such high fees to their advisors for losing money. With the stock market now increasing for five consecutive years, some investors are gaining confidence in pursuing other lower-cost solutions to their investments outside of the traditional human advisor channel.
Too Good to Be True? The Shortcomings
On the surface, the proposition of clicking a few buttons to create financial prosperity seems quite appealing, but if you look a little more closely under the hood, what you quickly realize is that most of these robo-advisor sites are glorifying the practice of doing-it-yourself (DIY). After conducting some due diligence on the various investment bells-and-whistles of these robo-sites, one quickly realizes individuals can replicate most of the kindergartener-esque ETF portfolios by merely calling 1-800-VANGUARD – without having to pay robo-advisor fees ranging from 0.15% – 0.95%. More specifically, Wealthfront and Betterment use 6-12 ETF security portfolios, integrating many Vanguard funds and other ETFs that can be purchased with a click of a mouse or phone call (without having to pay the robo-advisor middleman). A cynic may also point out these robo-investment sites are nothing more than expensive life-cycle funds that could be replicated at a fraction of the cost.
Despite the sites’ transparency preaching, filtering through robo fee and performance disclosure can be frustratingly tedious too – good luck to the novices. For example, Betterment claims to have created a superior performance track record, despite a hidden disclosure stating the results are manufactured from a computer back-test. The transparency pitch seems a little disingenuous, and I wonder how many of the new robo-site users are also aware of the extra underlying ETF fees? But when marketing a new high-cost start-up, I guess you need to fabricate a fancy chart and track record when you don’t have one. Underlying the robo investment sites is a disparate, hodge-podge of studies anointing Modern Portfolio Theory as the holy grail, but readers of this blog know there are many failings to pure quantitative strategies implemented by academics (see LTCM in Black Swans & Butter in Bangladesh).
The concept of DIY is nothing new. One can look no further than the impact Home Depot (HD) has had on the home improvement industry. In addition, there are plenty of individuals who choose to do their own income taxes with the help of software technology (i.e., Intuit), or those who forego hiring an estate planning attorney by using off-the-shelf legal documents (i.e., Legal Zoom). Many industries in our economy inherently have penny pinching DIY-ers, but despite current and future inroads made by the robo-advisors, there will always be individuals who do not have the capacity, patience, or interest to search out a DIY investment solution.
After watching the stock market rise for five consecutive years, taming investment portfolios may seem like a simple problem for internet software to solve, but experienced investors (not academics) understand successful long-term investing is never easy…with or without technology. The reality of the situation is that when volatility eventually spikes and we hit an inevitable bear market, these robo-sites will fail miserably in supplying the necessary human element to facilitate more prudent investment decisions.
While the rising robo-advisors may have many investment advisory shortcomings, I will acknowledge some appealing aggregating features that provide a helpful holistic view of an individual’s finances (see Mint). Also, these sites are forcing investors to ask their advisors the important and appropriate tough questions regarding fees, compensation, and conflicts of interest. However, in spite of the short-term, blossoming success of the robo-sites, investing has never been more difficult. Investors continue to get overwhelmed with the 24-7, 365 news cycles that proliferates an endless avalanche of global crises via TV, radio, Twitter, Facebook, and the blogosphere.
While a younger, less-affluent DIY demographic may flock to some of these robo-advisors, the millions of aging and retiring baby boomers ensures there will be plenty of demand for traditional advisors. Experienced independent RIA advisors and financial planners, like Sidoxia, who integrate low-cost ETFs into their investment management practices stand to benefit handsomely. Those advisors/sites offering simplistic, commoditized ETF offerings with no wealth planning services will be challenged. While I may not lose sleep over the rise of the robo-advisors, I will continue to dream of a robot that will lower my taxes and win me the lottery.
Wade W. Slome, CFA, CFP®
Plan. Invest. Prosper.
DISCLOSURE: Sidoxia Capital Management (SCM) and some of its clients hold long positions in certain exchange traded funds (including Vanguard ETFs), AAPL, but at the time of publishing SCM had no direct position in HD, TWTR, FB, Legal Zoom, or any other security referenced in this article. No information accessed through the Investing Caffeine (IC) website constitutes investment, financial, legal, tax or other advice nor is to be relied on in making an investment or other decision. Please read disclosure language on IC Contact page.
Hunting for Tennis Balls and Dead Cats

When it comes to gravity, people understand what goes up, must come down. But the reverse is not always true for stocks. What goes down, does not necessarily need to come back up. Since the 2008-09 financial crisis there have been a large group of multi-billion dollar behemoth stocks that have defied gravity, but over the last few months, many of these highfliers have come back to earth. Despite the pause in some of these major technology, consumer, and internet stocks, the overall stock market appears relatively calm. In fact, the Dow Jones Industrials index is currently sitting at all-time record highs and the S&P 500 index is hovering around -1% from its peak. But below the surface, there is a large undercurrent resulting in an enormous rotation out of pricier momentum and growth stocks into more defensive and yield-heavy sectors of the market, like utilities and real estate.
To expose this concealed trend I have highlighted a group of 20 stocks below, valued at close to half a trillion dollars. Over the last 12 months, this selective group of technology, consumer, and internet stocks have lost over -$200,000,000,000 from their peak values. Here’s a look at the highlighted stocks:
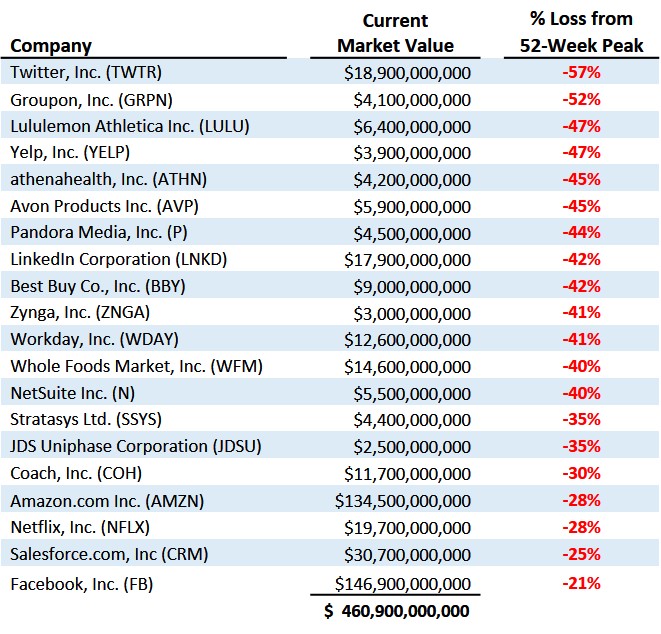
With respect to all the punished stocks, the dilemma for investors amidst this depreciating price carnage is how to profitably hunt for the bouncing tennis balls while avoiding the dead cat bounces. By hunting bouncing tennis balls, I am referring to the identification of those companies that have crashed from indiscriminate selling, even though the companies’ positive business fundamentals remain fully intact. The so-called dead cats reflect those overpriced companies that lack the earnings power or trajectory to support a rebounding stock price. Like a cat falling from a high-rise building, there may exist a possibility of a small rebound, but for many severely broken momentum stocks, minor bounces are often short-lived.
For long-term investors, much of the recent rotation is healthy. Some of the froth I’ve been writing about in the biotech, internet, and technology has been mitigated. As a result, in many instances, outrageous or rich stock valuations have now become fairly priced or attractive.
Profiting from Collapses
Many investors do not realize that some of the greatest stocks of all-time have suffered multiple -50% drops before subsequently doubling, tripling, quadrupling or better. History provides many rebounding tennis ball examples, but let’s take a brief look at the Apple Inc. (AAPL) chart from 1980 – 2005 to drive home the point:
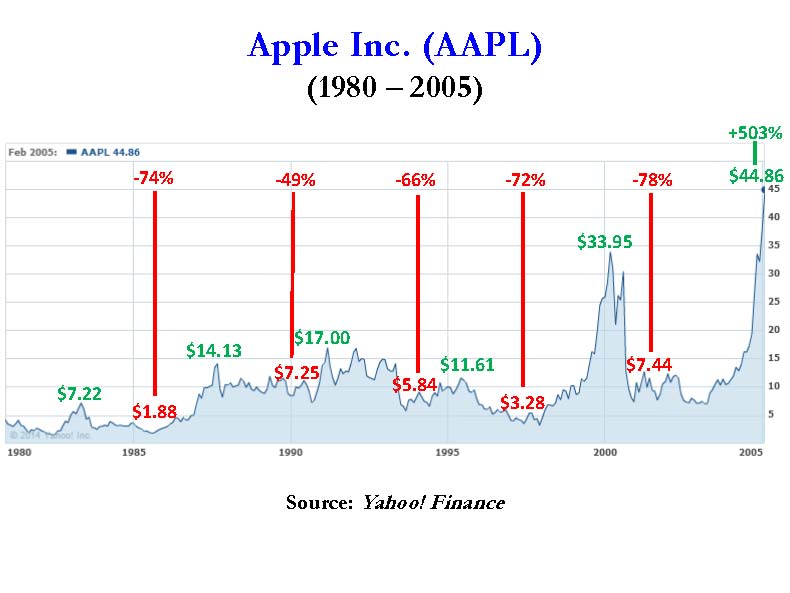
As you can see, there were at least five occasions when the stock got chopped in half (or worse) over the selected timeframe and another five occasions when the stock doubled (or better), including a +935% explosion in the 1997–2000 period, and a +503% advance from 2002–2005 when shares reached $45. The numbers get kookier when you consider Apple’s share price eventually reached $700 and closed early last week above $600.
These feast and famine patterns can be discovered for virtually all of the greatest all-time stocks. The massive volatility explains why it’s so difficult to stick with theses long-term winners. A more recent example of a tennis ball bounce would be Facebook Inc (FB). The -58% % plummet from its $42 IPO peak has been well-documented, and despite the more recent -21% pullback, the stock is still up +223% from its $18 lows.
On the flip side, an example of a dead cat bounce would include Cisco Systems Inc (CSCO). After the bursting of the 2000 technology bubble, Cisco has never fully recovered from its $82 peak value. There have been many fits and starts, including some periods of 50% declines and 100% gains, but due to excessive valuations in the late 1990s and changing competitive trends, Cisco still sits at $23 today (see chart below).
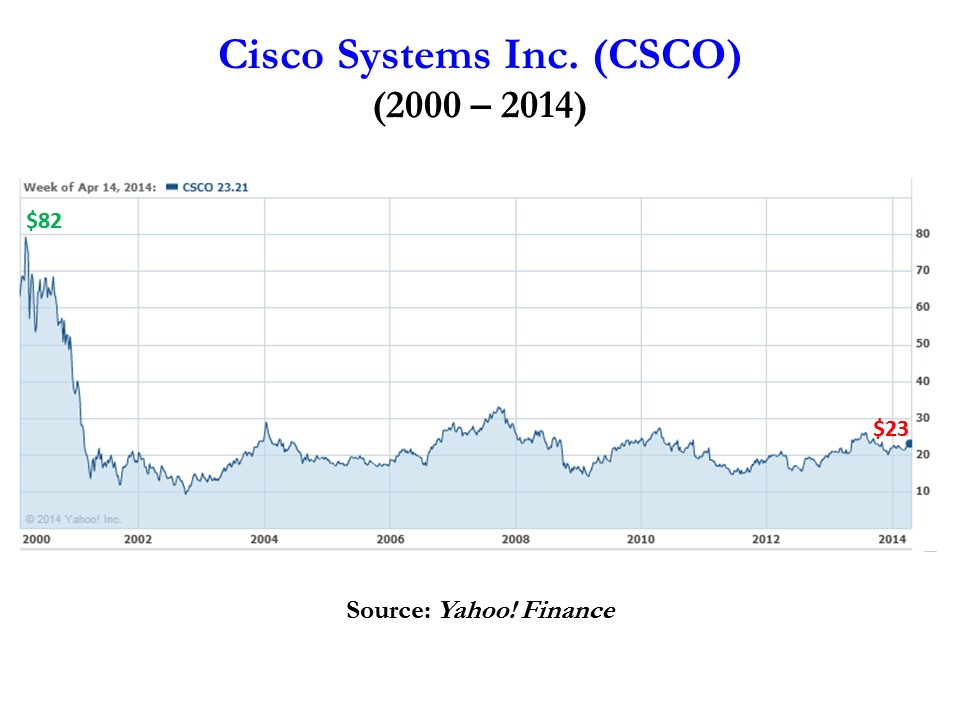
It is important to remember that just because a stock goes down -50% in value doesn’t mean that it’s going to double or triple in value in the future. Price momentum can drive a stock in the short run, but in the long run, the important variables to track closely are cash flows and earnings (see It’s the Earnings, Stupid) . The level and direction of these factors ultimately correlate best with the ultimate fair value of stock prices. Therefore, if you are fishing in the growth or momentum stock pond, make sure to do your homework after a stock price collapses. It’s imperative that you carefully hunt down rebounding tennis balls and avoid the dead cat bounces.
Wade W. Slome, CFA, CFP®
Plan. Invest. Prosper.
DISCLOSURE: Sidoxia Capital Management (SCM) and some of its clients hold long positions in certain exchange traded funds (ETFs), AMZN, long NFLX bond, short NFLX stock, short LULU, and long CSCO (in a non-discretionary account), but at the time of publishing SCM had no direct position in TWTR, GRPN, YELP, ATHN, AVP, P, LNKD, BBY, ZNGA, WDAY, WFM, N, SSYS, JDSU, COH, CRM, FB or any other security referenced in this article. No information accessed through the Investing Caffeine (IC) website constitutes investment, financial, legal, tax or other advice nor is to be relied on in making an investment or other decision. Please read disclosure language on IC Contact page.
Buy in May and Tap Dance Away

This article is an excerpt from a previously released Sidoxia Capital Management complementary newsletter (May 1, 2014). Subscribe on the right side of the page for the complete text.
The proverbial Wall Street adage that urges investors to “Sell in May, and go away” in order to avoid a seasonally volatile period from May to October has driven speculative trading strategies for generations. The basic premise behind the plan revolves around the idea that people have better things to do during the spring and summer months, so they sell stocks. Once the weather cools off, the thought process reverses as investors renew their interest in stocks during November. If investing was as easy as selling stocks on May 1 st and then buying them back on November 1st, then we could all caravan in yachts to our private islands while drinking from umbrella-filled coconut drinks. Regrettably, successful investing is not that simple and following naïve strategies like these generally don’t work over the long-run.
Even if you believe in market timing and seasonal investing (see Getting Off the Market Timing Treadmill ), the prohibitive transaction costs and tax implications often strip away any potential statistical advantage.
Unfortunately for the bears, who often react to this type of voodoo investing, betting against the stock market from May – October during the last two years has been a money-losing strategy. Rather than going away, investors have been better served to “Buy in May, and tap dance away.” More specifically, the S&P 500 index has increased in each of the last two years, including a +10% surge during the May-October period last year.
Nervous? Why Invest Now?
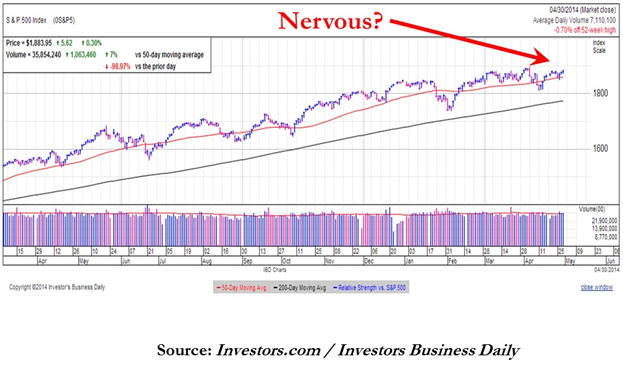
With the weak recent economic GDP figures and stock prices off by less than 1% from their all-time record highs, why in the world would investors consider investing now? Well, for starters, one must ask themselves, “What options do I have for my savings…cash?” Cash has been and will continue to be a poor place to hoard funds, especially when interest rates are near historic lows and inflation is eating away the value of your nest-egg like a hungry sumo wrestler. Anyone who has completed their income taxes last month knows how pathetic bank rates have been, and if you have pumped gas recently, you can appreciate the gnawing impact of escalating gasoline prices.
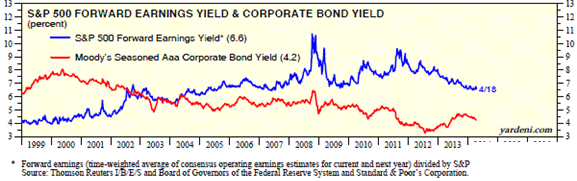
While there are selective opportunities to garner attractive yields in the bond market, as exploited in Sidoxia Fusion strategies, strategist and economist Dr. Ed Yardeni points out that equities have approximately +50% higher yields than corporate bonds. As you can see from the chart below, stocks (blue line) are yielding profits of about +6.6% vs +4.2% for corporate bonds (red line). In other words, for every $100 invested in stocks, companies are earning $6.60 in profits on average, which are then either paid out to investors as growing dividends and/or reinvested back into their companies for future growth.
Source: Dr. Ed’s Blog
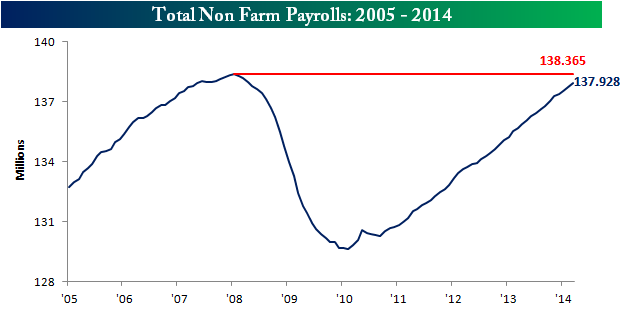
Hefty profit streams have resulted in healthy corporate balance sheets, which have served as ammunition for the improving jobs picture. At best, the economic recovery has moved from a snail’s pace to a tortoise’s pace, but nevertheless, the unemployment rate has returned to a more respectable 6.7% rate. The mended economy has virtually recovered all of the approximately 9 million private jobs lost during the financial crisis (see chart below) and expectations for Friday’s jobs report is for another +220,000 jobs added during the month of April.
Source: Bespoke
Wondrous Wing Woman
Investing can be scary for some individuals, but having an accommodative Fed Chair like Janet Yellen on your side makes the challenge more manageable. As I’ve pointed out in the past (with the help of Scott Grannis), the Fed’s stimulative ‘Quantitative Easing’ program counter intuitively raised interest rates during its implementation. What’s more, Yellen’s spearheading of the unprecedented $40 billion bond buying reduction program (a.k.a., ‘Taper’) has unexpectedly led to declining interest rates in recent months. If all goes well, Yellen will have completed the $85 billion monthly tapering by the end of this year, assuming the economy continues to expand.
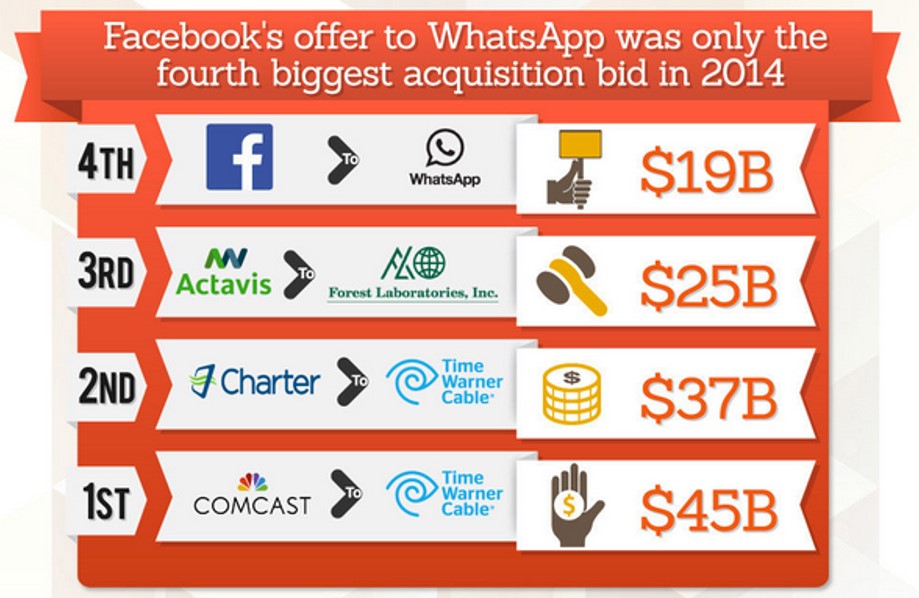
In the meantime, investors and the broader financial markets have begun to digest the unwinding of the largest, most unprecedented monetary intervention in financial history. How can we tell this is the case? CEO confidence has improved to the point that $1 trillion of deals have been announced this year, including offers by Pfizer Inc. – PFE ($100 billion), Facebook Inc. – FB ($19 billion), and Comcast Corp. – CMCSA ($45 billion).
Source: Entrepreneur
Banks are feeling more confident too, and this is evident by the acceleration seen in bank loans. After the financial crisis, gun-shy bank CEOs fortified their balance sheets, but with five years of economic expansion under their belts, the banks are beginning to loosen their loan purse strings further (see chart below).
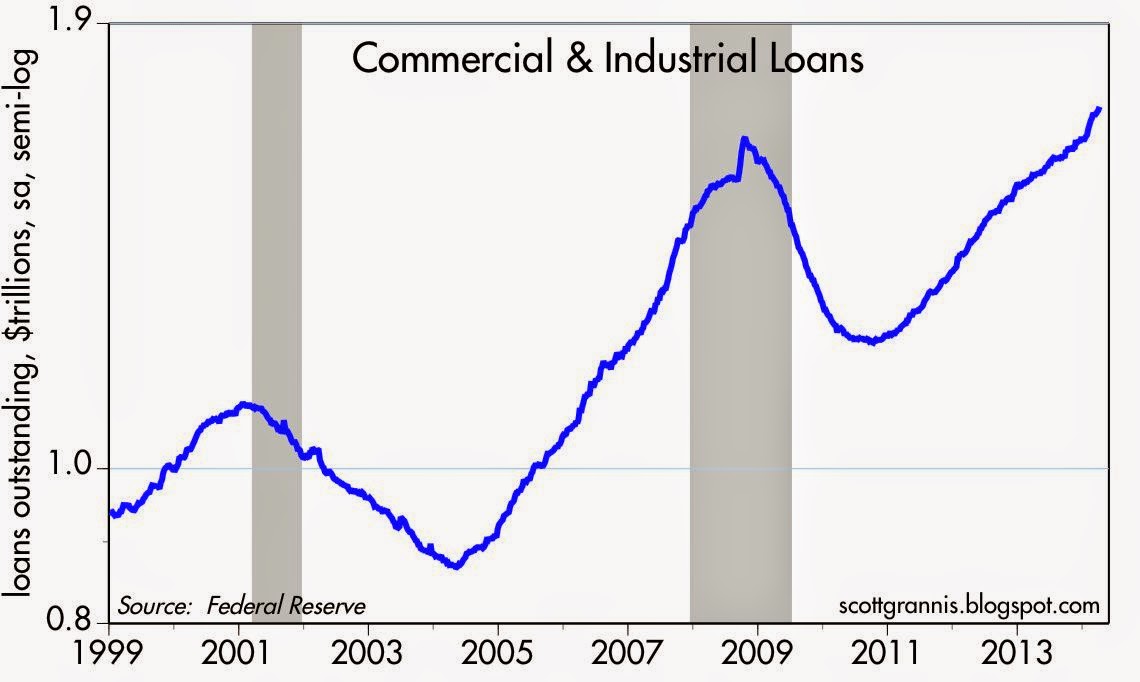
The coast is never completely clear. As always, there are plenty of things to worry about. If it’s not Ukraine, it can be slowing growth in China, mid-term elections in the fall, and/or rising tensions in the Middle East. However, for the vast majority of investors, relying on calendar adages (i.e., selling in May) is a complete waste of time. You will be much better off investing in attractively priced, long-term opportunities, and then tap dance your way to financial prosperity.
Wade W. Slome, CFA, CFP®
Plan. Invest. Prosper.
DISCLOSURE: Sidoxia Capital Management (SCM) and some of its clients hold positions in PFE, CMCSA, and certain exchange traded funds (ETFs), but at the time of publishing SCM had no direct position in FB or any other security referenced in this article. No information accessed through the Investing Caffeine (IC) website constitutes investment, financial, legal, tax or other advice nor is to be relied on in making an investment or other decision. Please read disclosure language on IC Contact page.
You Can’t Kiss Every Pretty Girl (…or Handsome Boy)

There are a lot of pretty girls in the world, and there are a lot of sexy stocks in the stock market, but not even the most eligible bachelor (or bachelorettes) are able to kiss all the beautiful people in the world. The same principle applies to the stock market. The most successful investors have a disciplined process of waiting for the perfect mate to cross their path, rather than chasing every tempting mistress.
Happily married to my current portfolio, I continually bump into attractive candidates that try to seduce me into buying. For me, these sexy equities typically come in the shape of high P/E ratios (Price/Earnings) and rapid sales growth rates. It’s fun to date (or rent) these sexy stocks, but the novelty often wears off quickly and the euphoric sensation can disappear rapidly – just like real-world dating. Case in point is the reality dating shows, the Bachelor and Bachelorette. Over 27 combined seasons, of which I sheepishly admit seeing a few, only five of the couples remain together today. While it may be enjoyable to vicariously watch bevies of beautiful people hook-up, the harsh reality is that the success rate is abysmal, similar to the results in chasing darling stocks (see also Riding the Wave).
Well-known strategist and investor Barton Biggs once said, “A bull market is like sex. It feels best just before it ends.” The same goes with chasing pricey momentum stocks – what looks pretty in the short-run can turn ugly in a blink of the eye. For example, if you purchased the following basket of top 10 performing stocks of 2012 (+118% average return excluding dividends), you would have underperformed the market by -16% if you owned until today.

Warren Buffett understands hunting for short-term relationships may be thrilling, but this strategy often leads to tears and heartbreak. Buffett summarized the importance of selectivity here:
“I could improve your ultimate financial welfare by giving you a ticket with only twenty slots in it so that you had twenty punches – representing all the investments that you got to make in a lifetime. And once you’d punched through the card, you couldn’t make any more investments at all. Under those rules, you’d really think carefully about what you did, and you’d be forced to load up on what you’d really thought about. So you’d do so much better.”
Rather than hungering for the spiciest stocks, it’s best to find a beauty before she becomes Miss America, because at that point, everybody wants to date her and the price is usually way too expensive. If you stay selective and patient while realizing you can’t kiss every pretty girl, then you can prevent the stock market from breaking your heart.
Wade W. Slome, CFA, CFP®
Plan. Invest. Prosper.
DISCLOSURE: Sidoxia Capital Management (SCM) and some of its clients hold long positions in certain exchange traded funds (ETFs), but at the time of publishing SCM had no direct position in PHM, MHO, CVI, EXPE, HFS, DDS, LEN, MPC. TSO, GPS, BRKA/B, or any other security referenced in this article. No information accessed through the Investing Caffeine (IC) website constitutes investment, financial, legal, tax or other advice nor is to be relied on in making an investment or other decision. Please read disclosure language on IC Contact page.
The EPS House of Cards: Tricks of the Trade

As we enter the quarterly ritual of the tsunami of earnings reports, investors will be combing through the financial reports. Due to the flood of information, and increasingly shorter and shorter investment time horizons, much of investors’ focus will center on a few quarterly report metrics – primarily earnings per share (EPS), revenues, and forecasts/guidance (if provided).
Many lessons have been learned from the financial crisis over the last few years, and one of the major ones is to do your homework thoroughly. Relying on a AAA ratings from Moody’s (MCO) and S&P (when ratings should have been more appropriately graded D or F) or blindly following a “Buy” rating from a conflicted investment banking firm just does not make sense.
FINANCIAL SECTOR COLLAPSE
Given the severity of the losses, investors need to be more demanding and comprehensive in their earnings analysis. In many instances the reported earnings numbers resemble a deceptive house of cards on a weak foundation, merely overlooked by distracted investors. Case in point is the Financial sector, which before the financial collapse saw distorted multi-year growth, propelled by phantom earnings due to artificial asset inflation and excessive leverage. One need look no further than the weighting of Financial stocks, which ballooned from 5% of the total S&P 500 Index market capitalization in 1980 to a peak of 23% in 2007. Once the credit and real estate bubble burst, the sector subsequently imploded to around 9% of the index value around the March 2009 lows. Let’s be honest, and ask ourselves how much faith can we put in the Financial sector earnings figures that moved from +$22.79 in 2007 to a loss of -$21.24 in 2008? Since that time regulation and reform has put the sector on a more solid footing. Luckily, the opacity and black box nature of many of these Financials largely kept me out of the 2009 sector implosion.
WHAT TO WATCH FOR
But the Financial sector is not the only fuzzy areas of accounting manipulation. Thanks to our friends at the FASB (Financial Accounting Standards Board), company management teams have discretion in how they apply different GAAP (Generally Accepted Accounting Principles) rules. Saj Karsan, a contributing writer at Morningstar.com, also writes about the “Fallacy of Earnings Per Share.”
“EPS can fluctuate wildly from year to year. Writedowns, abnormal business conditions, asset sale gains/losses and other unusual factors find their way into EPS quite often. Investors are urged to average EPS over a business cycle, as stressed in Security Analysis Chapter 37, in order to get a true picture of a company’s earnings power.”
These gray areas of interpretation can lead to a range of distorted EPS outcomes. Here are a few ways companies can manipulate their EPS:
Distorted Expenses: If a $10 million manufacturing plant is expected to last 10 years, then the depreciation expense should be $1 million per year. If for some reason the Chief Financial Officer (CFO) suddenly decided the building would last 40 years rather than 10 years, then the expense would only be $250,000 per year. Voila, an instant $750,000 annual gain was created out of thin air due to management’s change in estimates.
Magical Revenues: Some companies have been known to do what’s called “stuffing the channel.” Or in other words, companies sometimes will ship product to a distributor or customer even if there is no immediate demand for that product. This practice can potentially increase the revenue of the reporting company, while providing the customer with more inventory on-hand. The major problem with the strategy is cash collection, which can be pushed way off in the future or become uncollectible.
Accounting Shifts: Under certain circumstances, specific expenses can be converted to an asset on the balance sheet, leading to inflated EPS numbers. A common example of this phenomenon occurs in the software industry, where software engineering expenses on the income statement get converted to capitalized software assets on the balance sheet. Again, like other schemes, this practice delays the negative expense effects on reported earnings.
Artificial Income: Not only did many of the trouble banks make imprudent loans to borrowers that were unlikely to repay, but the loans were made based on assumptions that asset prices would go up indefinitely and credit costs would remain freakishly low. Based on the overly optimistic repayment and loss assumptions, banks recognized massive amounts of gains which propelled even more imprudent loans. Needless to say, investors are now more tightly questioning these assumptions. That said, recent relaxation of mark-to-market accounting makes it even more difficult to estimate the true values of assets on the bank’s balance sheets.
Like dieting, there are no easy solutions. Tearing through the financial statements is tough work and requires a lot of diligence. My process of identifying winning stocks is heavily cash flow based (see my article on cash flow investing) analysis, which although lumpier and more volatile than basic EPS analysis, provides a deeper understanding of a company’s value-creating capabilities and true cash generation powers.
As earnings season kicks into full gear, do yourself a favor and not only take a more critical” eye towards company earnings, but follow the cash to a firmer conviction in your stock picks. Otherwise, those shaky EPS numbers may lead to a tumbling house of cards.
Read Saj Karsan’s Full Article
Wade W. Slome, CFA, CFP®
Plan. Invest. Prosper.
DISCLOSURE: Sidoxia Capital Management has no direct position in MCO or MHP at the time this article was originally posted. No information accessed through the Investing Caffeine (IC) website constitutes investment, financial, legal, tax or other advice nor is to be relied on in making an investment or other decision. Please read disclosure language on IC “Contact” page.
Lewis Sells Flash Boys Snake Oil

I know what you’re saying, “Please, not another article on Michael Lewis’s Flash Boys book and high frequency trading (HFT),” but I can’t resist putting in my two cents after the well-known author emphatically proclaimed the stock market as “rigged.” Lewis is not alone with his outrageous claims… Clark Stanley (“The Rattlesnake King”) made equally outlandish claims in the early 1900s when he sold lucrative Snake Oil Liniment to heal the ailments of the masses. Ultimately Stanley’s assets were seized by the government and the healing assertions of his snake oil were proven fraudulent. Like Stanley, Lewis’s over-the-top comments about HFT traders are now being scrutinized under a microscope by more thoughtful critics than Steve Kroft from 60 Minutes (see television profile). For a more detailed counterpoint, see the Reuters interview with Manoj Narang (Tradeworx) and Haim Bodek (Decimus Capital Markets).
While Lewis may not be selling snake oil, the cash register is still ringing with book sales until the real truth is disseminated. In the meantime, Lewis continues to laugh to the bank as he makes misleading and deceptive claims, just like his snake oil selling predecessors.
The Inside Perspective
Regardless of what side of the fence you fall on, the debate created by Lewis’s book has created deafening controversy. Joining the jihad against HFT is industry veteran Charles Schwab, who distributed a press release calling HFT a “growing cancer” and stating the following:
“High-frequency trading has run amok and is corrupting our capital market system by creating an unleveled playing field for individual investors and driving the wrong incentives for our commodity and equities exchanges.”
What Charles Schwab doesn’t admit is that their firm is receiving about $100 million in annual revenues to direct Schwab client orders to the same HFT traders at exchanges in so called “payment-for-order-flow” contracts. Another term to describe this practice would be “kick-backs”.
While Michael Lewis screams bloody murder over investors getting fraudulently skimmed, some other industry legends, including the godfather of index funds, Vanguard founder Jack Bogle, argue that Lewis’s views are too extreme. Bogle reasons, “Main Street is the great beneficiary…We are better off with high-frequency trading than we are without it.”
Like Jack Bogle, other investors who should be pointing the finger at HFT traders are instead patting them on the back. Cliff Asness, managing and founding principal of AQR Capital Management, an institutional investment firm managing about $100 billion in assets, had this to say about HFT in his Wall Street Journal Op-Ed:
“How do we feel about high-frequency trading? We think it helps us. It seems to have reduced our costs and may enable us to manage more investment dollars… on the whole high-frequency traders have lowered costs.”
Is HFT Good for Main Street?
Many investors today have already forgotten, or were too young to remember, that stocks used to be priced in fractions before technology narrowed spreads to decimal points in the 1990s. Who has benefited from all this technology? You guessed it…everyone.
Lewis makes the case that the case that all investors are negatively impacted by HFT, including Main Street (individual) investors. Asness maintains costs have been significantly lowered for individual investors:
“For the first time in history, Main Street might have it rigged against Wall Street.”
In Flash Boys, Lewis claims HFT traders unscrupulously scalp pennies per share from retail investor pockets by using privileged information to jump in front of ordinary investors (“front-run”). The reality, even if you believe Lewis’s contentions are true, is that technology has turned any perceived detrimental penny-sized skimming scheme into beneficial bucks for ordinary investors. For example, trades that used to cost $40, $50, $100, or more per transaction at the large wirehouse brokerage firms can today be purchased at discount brokerage firms for $7 or less. What’s more, the spread (i.e., the profits available for middlemen) used to be measured in increments of 1/8, 1/4, and 1/2 , when today the spreads are measured in pennies or fractions of pennies. Without any rational explanation, Lewis also dismisses the fact that HFT traders add valuable liquidity to the market. His argument of adding “volume and not liquidity” would make sense if HFT traders only transacted solely with other HFT traders, but that is obviously not the case.
Regardless, as you can see from the chart below, the trend in spreads over the last decade or so has been on a steady, downward, investor-friendly slope.

Source: Business Insider
How Did We Get Here? And What’s Wrong with HFT?
Similarly to our country’s 73,954 page I.R.S. tax code, the complexity of our financial market trading structure rivals that of our government’s money collection system. The painting of all HFT traders as villains by Lewis is no truer than painting all taxpayers as crooks. Just as there are plenty of crooked and deceitful individuals that push the boundaries of our income tax system, so too are there traders that try to take advantage of an inefficient, Byzantine exchange system. The mere presence of some tax dodgers doesn’t mean that all taxpayers should go to jail, nor should all HFT traders be crucified by the SEC (Securities and Exchange Commission) police.
The heightened convoluted nature to our country’s exchange-based financial system can be traced back to the establishment of Regulation NMS, which was passed by the SEC in 2005 and implemented in 2007. The aim of this regulatory structure was designed to level the playing field through fairer trade execution and the creation of equal access to transparent price quotations. However, rather than leveling the playing field, the government destroyed the playing field and fragmented it into many convoluted pieces (i.e., exchanges) – see Wall Street Journal article and chart below.

Source: Wall Street Journal
The new Reg NMS competition came in the form of exchanges like BATS and Direct Edge (now merging), but the new multi-faceted structures introduced fresh loopholes for HFT traders to exploit – for both themselves and investors. More specifically, HFT traders used expensive, lightning-fast fiber optic cables; privileged access to data centers physically located adjacent to trading exchanges; and then they integrated algorithmic software code to efficiently route orders for best execution.
Are many of these HFT traders and software programs attempting to anticipate market direction? Certainly. As the WSJ excerpt below explains, these traders are shrewdly putting their capitalist genes to the profit-making test:
Computerized firms called high-frequency traders try to pick up clues about what the big players are doing through techniques such as repeatedly placing and instantly canceling thousands of stock orders to detect demand. If such a firm’s algorithm detects that a mutual fund is loading up on a certain stock, the firm’s computers may decide the stock is worth more and can rush to buy it first. That process can make the purchase costlier for the mutual fund.
Like any highly profitable business, success eventually attracts competition, and that is exactly what has happened with high frequency trading. To appreciate this fact, all one need to do is look at Goldman Sachs’s actions, which is to leave the NYSE (New York Stock Exchange), shutter its HFT dark pool trading platform (Sigma X), and join IEX, the dark pool created by Brad Katsuyama, the hero placed on a pedestal by Lewis in Flash Boys. Goldman is putting on their “we’re doing what’s best for investors” face on, but more experienced veterans understand that Goldman and all the other HFT traders are mostly just greedy S.O.B.s looking out for their best interests. The calculus is straightforward: As costs of implementing HFT have plummeted, the profit potential has dried up, and the remaining competitors have been left to fend for their Darwinian survival. The TABB Group, a financial markets’ research and consulting firm, estimates that US equity HFT revenues have declined from approximately $7.2 billion in 2009 to about $1.3 billion in 2014. As costs for co-locating HFT hardware next to an exchange have plummeted from millions of dollars to as low as $1,000 per month, the HFT market has opened their doors to anyone with a checkbook, programmer, and a pulse. That wasn’t the case a handful of years ago.
The Fixes
Admittedly, not everything is hearts and flowers in HFT land. The Flash Crash of 2010 highlighted how fragmented, convoluted, and opaque our market system has become since Reg NMS was implemented. And although “circuit breaker” remedies have helped prevent a replicated occurrence, there is still room for improvement.
What are some of the solutions? Here are a few ideas:
- Reform complicated Reg NMS rules – competition is good, complexity is not.
- Overhaul disclosure around “payment-for-order-flow” contracts (rebates), so potential conflicts of interest can be exposed.
- Stop inefficient wasteful “quote stuffing” practices by HFT traders.
- Speed up and improve the quality of the SIP (Security Information Processor), so the gaps between SIP and the direct feed data from exchanges are minimized.
- Improve tracking and transparency, which can weed out shady players and lower probabilities of another Flash Crash-like event.
These shortcomings of HFT trading do not mean the market is “rigged”, but like our overwhelmingly complex tax system, there is plenty of room for improvement. Another pet peeve of mine is Lewis’s infatuation with stocks. If he really thinks the stock market is rigged, then he should write his next book on the less efficient markets of bonds, futures, and other over-the-counter derivatives. This is much more fertile ground for corruption.
As a former manager of a $20 billion fund, I understand the complications firsthand faced by large institutional investors. In an ever-changing game of cat and mouse, investors of all sizes will continue looking to execute trades at the best prices (lowest possible purchase and highest possible sales price), while middlemen traders will persist with their ambition to exploit the spread (generate profits between the bid and ask prices). Improvements in technology will always afford a temporary advantage for a few, but in the long-run the benefits for all investors have been undeniable. The same undeniable benefits can’t be said for reading Michael Lewis’s Flash Boys. Like Clark Stanley and other snake oil salesmen before him, it will only take time for the real truth to come out about Lewis’s “rigged” stock market claims.
Wade W. Slome, CFA, CFP®
Plan. Invest. Prosper.
DISCLOSURE: Sidoxia Capital Management (SCM) and some of its clients hold long positions in certain exchange traded funds (ETFs), but at the time of publishing SCM had no direct position in GS, SCHW, ICE, or any other security referenced in this article. No information accessed through the Investing Caffeine (IC) website constitutes investment, financial, legal, tax or other advice nor is to be relied on in making an investment or other decision. Please read disclosure language on IC Contact page.
The Treadmill Market – Jogging in Place

This article is an excerpt from a previously released Sidoxia Capital Management complementary newsletter (April 1, 2014). Subscribe on the right side of the page for the complete text.
After the stock market raced ahead to about a +30% gain last year, it became clear this meteoric trend was not sustainable into perpetuity. Correct investing should be treated more like a marathon than a sprint. After dashing ahead by more than +100% over the last handful of years, 2014 stock prices took a breather by spending the first quarter jogging in place. Like a runner on the treadmill, year-to-date returns equated to a -0.7% for the Dow Jones Industrial Average index, and +1.3% for the S&P index. Digesting the large gains from previous years, despite making no discernable forward progress this quarter, is a healthy exercise that builds long-term portfolio endurance. As far as I’m concerned, nothing in life worthwhile comes easy, and the first three months of the year have demonstrated this principle.
As I’ve written in the past (see Series of Unfortunate Events), there is never a shortage of issues to worry about. The first few months of 2014 have been no exception. Vladimir Putin’s strong armed military backed takeover of Crimea, coupled with the Federal Reserve’s unwinding $30 billion of the $85 billion of its “Quantitative Easing” bond buying program (i.e. tapering) have contributed to investors’ nervousness. When the “Fairy Godmother of the Bull Market,” Federal Reserve Chair Janet Yellen, hinted at potentially raising interest rates in about 12 months, the mood soured further.
The unseasonably cold winter back east (a.k.a., Polar Vortex) has caused some additional jitters due to the dampening effects on economic conditions. More specifically, economic growth as measured by GDP (Gross Domestic Product) is expected to come in around a meager +2.0% rate during the first quarter of 2014, before picking up later in the year.
And if that isn’t enough, best-selling author Michael Lewis, whose books include Money Ball, The Blind Side, and Liar’s Poker, just came out on national television and sparked a debate with his controversial statement that the “stock market is rigged.” (read and listen more here)
Runners High
But as always, not everything is gloom and doom. Offsetting the temporary price fatigue, resilient record corporate profits have supported the surprising market stamina. Like a runner’s high, corporations are feeling elated about historically elevated profit margins. As you can see from the chart below, the reason it’s prudent for most to have some U.S. equity exposure is due to the clear, upward multi-decade trend of U.S. corporate earnings.
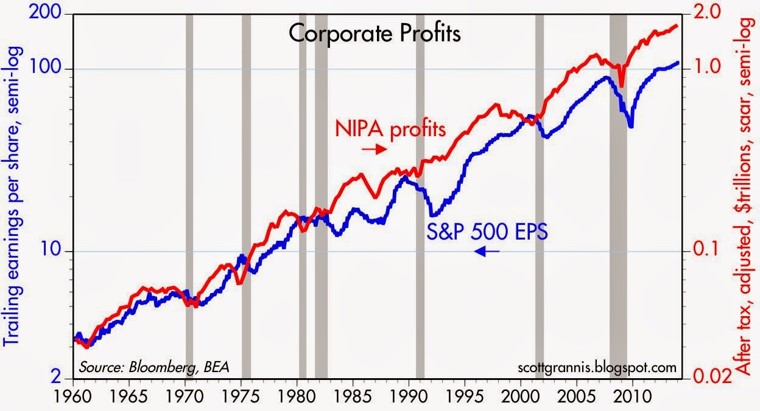
Source: Calafia Beach Plundit (gray areas are recessions)
While the skeptics wait for these game-ending dynamics to take root, core economic fundamentals in areas like these remain strong:I didn’t invent the idea of profits impacting the stock market, but the concept is simple: stock prices generally follow earnings over long periods of time (see It’s the Earnings, Stupid). In other words, as profits accelerate, so do stock prices – and the opposite holds true (decelerating earnings leads to price declines). This direct relationship normally holds over the long-run as long as the following conditions are not in place: 1) valuations are stretched; 2) a recession is imminent; and/or 3) interest rates are spiking. Fortunately for long-term investors, there is no compelling evidence of these factors currently in place.
Employment Adrenaline
The employment outlook received a boost of adrenaline last month. Despite the slight upward nudge in the unemployment rate to 6.7%, total nonfarm payroll jobs increased by +175,000 in February versus a +129,000 gain in January and an +84,000 gain in December. Not only was last month’s increase better than expectations, but the net figures calculated over the previous two months were also revised higher by +25,000 jobs. As you can see below, the improvement since 2009 has been fairly steady, but as the current rate flirts with the Fed’s 6.5% target, Chair Yellen has decided to remove the quantitative objective. The rising number of discouraged workers (i.e., voluntarily opt-out of job searching) and part-timers has distorted the numbers, rendering arbitrary numeric targets less useful.
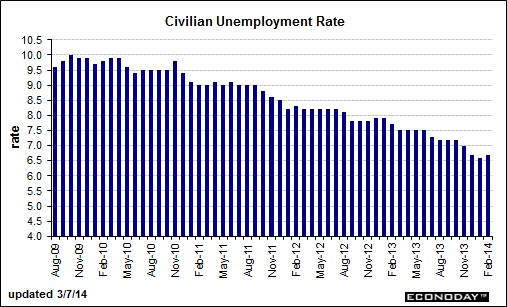
Source: Barron’s Online
Housing Holding Strong
In the face of the severe winter weather, the feisty housing market remains near multi-year highs as shown in the 5-month moving average housing start figure below. With the spring selling season upon us, we should be able to better gauge the impact of cold weather and higher mortgage rates on the housing market.
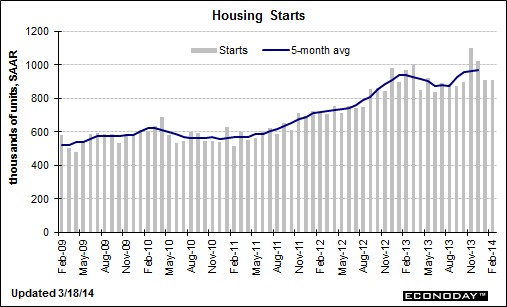
Source: Barron’s Online
Even though stock market investors found themselves jogging in place during the first quarter of the year, long-term investors are building up endurance as corporate profits and the economy continue to consistently grow in the background. Successful investors must realize stock prices cannot sustainably sprint for long periods of time without eventually hitting a wall and collapsing. Those who recognize investing as a marathon sport, rather than a mad dash, will be able to jump off the treadmill and ultimately reach their financial finish line.
Wade W. Slome, CFA, CFP®
Plan. Invest. Prosper.
DISCLOSURE: Sidoxia Capital Management (SCM) and some of its clients hold long positions in certain exchange traded funds (ETFs), but at the time of publishing SCM had no direct position in any other security referenced in this article. No information accessed through the Investing Caffeine (IC) website constitutes investment, financial, legal, tax or other advice nor is to be relied on in making an investment or other decision. Please read disclosure language on IC Contact page.
Passive vs. Active Investing: Darts, Monkeys & Pros

Bob Turner is founder of Turner Investments and a manager of several funds at the investment company. In a recent article he reintroduces the all-important, longstanding debate of active management (“hands-on”) versus passive management (“hands off”) approaches to investing. Mr. Turner makes some good arguments for the active management camp, however some feel differently – take for example Burton Malkiel. The Princeton professor theorizes in his book A Random Walk Down Wall Street that “a blindfolded monkey throwing darts at a newspaper’s stock page could select a portfolio that would do just as well as one carefully selected by experts.” In fact, The Wall Street Journal manages an Investment Dartboard contest that stacks up amateur investors’ picks against the pros’ and random stock picks selected by randomly thrown darts. In many instances, the dartboard picks outperform the professionals. Given the controversy, who’s right…the darts, monkeys, or pros? Distinguishing between the different categorizations can be difficult, but we will take a stab nevertheless.
Arguments for Active Management
Turner contends, active management outperforms in periods of high volatility and he believes the industry will be entering such a phase:
“Active managers historically have tended to perform best in a market in which the performance of individual stocks varies widely.”
He also acknowledges that not all active managers outperform and admits there are periods where passive management will do better:
“The reason why most active investors fail to outperform is because they in fact constitute most of the market. Even in the best of times, not all active managers can hope to outperform…The business of picking stocks is to some degree a zero-sum game; the results achieved by the best managers will be offset at least somewhat by the subpar performance of other managers.”
Buttressing his argument for active management, Turner references data from Advisor Perspectives showing an inconclusive percentage (40.5%-67.8%) of the actively managed funds trailing the passively managed indexes from 2000 to 2008.
The Case for Passive Management
Turner cites one specific study to support his active management cause. However, my experience gleaned from the vast amounts of academic and industry data point to approximately 75% of active managers underperforming their passively managed indexes, over longer periods of time. Notably, a recent study conducted by Standard & Poor’s SPIVA division (S&P Indices Versus Active Funds) discovered the following conclusions over the five year market cycle from 2004 to 2008:
- S&P 500 outperformed 71.9% of actively managed large cap funds;
- S&P MidCap 400 outperformed 79.1% of mid cap funds;
- S&P SmallCap 600 outperformed 85.5% of small cap funds.
Read more about the dirty secrets shrinking your portfolio. According to the Vanguard Group and the Investment Company Institute, about 25% of institutional assets and about 12% of individual investors’ assets are currently indexed (passive strategies). If you doubt the popularity of passive investment strategies, then look no further than the growth of Exchange Traded Funds (ETFs – see chart), index funds, or Vanguard Groups more than $1 trillion dollars in assets under management.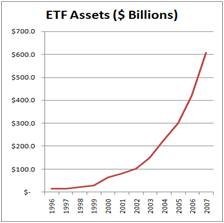
Although I am a firm believer in passive investing, one of its shortcomings is mean reversion. This is the idea that upward or downward moving trends tend to revert back to an average or normal level over time. Active investing can take advantage of mean reversion, conversely passive investing cannot. Indexes can get very top-heavy in weightings of outperforming sectors or industries, meaning theoretically you could be buying larger and larger shares of an index in overpriced glamour stocks on the verge of collapse. We experienced these lopsided index weightings through the technology bubbles in the late 1990s and financials in 2008. Some strategies may be better than other over the long run, but every strategy, even passive investing, has its own unique set of deficiencies and risks.
Professional Sports and Investing
As I discuss in my book, there are similarities that can be drawn between professional sports and investing with respect to active vs. passive management. Like the scarce number of .300 hitters in baseball, I believe there are a select few investment managers who can consistently outperform the market. In 2007, AssociatedContent.com did a study that showed there were only 22 active career .300 hitters in Major League Baseball. I recognize in the investing world there can be a larger role for “luck,” which is difficult, if not impossible, to measure (luck won’t help me much in hitting a 100 mile per hour fastball thrown by Nolan Ryan). Nonetheless, in the professional sports arena, there are some Hall of Famers (prospects) that have proved they could (can) consistently outperform their peers for extended durations of time. Experience is another distinction I would highlight in comparing sports and investing. Unlike sports, in the investment world I believe there is a positive correlation between age and ability. The more experience an investor gains, generally the better long-term return achieved. Like many professions, the more experience you gain, the more valuable you become. Unfortunately, in many sports, ability deteriorates and muscles atrophy over time.
Size Matters
Experience alone will not make you a better investor. Some investors are born with an innate gift or intellect that propels them ahead of the pack. However, most great investors eventually get cursed by their own success thanks to accumulating assets. Warren Buffet knows the consequences of managing large amounts of dollars, “gravity always wins.” Having managed a $20 billion fund, I fully appreciate the challenges of investing larger sums of money. Managing a smaller fund is similar to navigating a speed boat – not too difficult to maneuver and fairly easy to dodge obstacles. Managing heftier pools of money can be like captaining a supertanker, but unfortunately the same rapid u-turn expectations of the speedboat remain. Managing large amounts of capital can be crippling, and that’s why captaining a supertanker requires the proper foresight and experience.
Room for All
As I’ve stated before, I believe the market is efficient in the long run, but can be terribly inefficient in the short-run, especially when the behavioral aspects of emotion (fear and greed) take over. The “wait for me, I want to play too” greed from the late 1990s technology craze and the credit-based economic collapse of 2008-2009 are further examples of inefficient situations that can be exploited by active managers. However, due to multiple fees, transaction costs, taxes, not to mention the short-term performance/compensation pressures to perform, I believe the odds are stacked against the active managers. For those experienced managers that have played the game for a long period and have a track record of success, I feel active management can play a role. At Sidoxia Capital Management, I choose to create investment portfolios that blend a mixture of passive and active investment strategies. Although my hedge fund has outperformed the S&P 500 in 4 of the last 5 years, that fact does not necessarily mean it’s the appropriate sole approach for all clients. As Warren Buffet states, investors should stick to their “circle of competence” so they can confidently invest in what they know. That’s why I generally stick to the areas of my expertise when I’m actively investing in stocks, and fill in the remainder of client portfolios with transparent, low-cost, tax-efficient equity and fixed income products (i.e., Exchange Traded Funds). Even though the actively managed Turner Funds appear to have a mixed-bag of performance numbers relative to passively managed strategies, I appreciate Bob Turner’s article for addressing this important issue. I’m sure the debate will never fully be resolved. In the meantime, my client portfolios will aim to mix the best of both worlds within active and passive management strategies in the eternal quest of outwitting the darts, monkeys, and other pros.
Read the full Bob Turner article on Morningstar.com
Wade W. Slome, CFA, CFP®
Plan. Invest. Prosper.
DISCLOSURE: Sidoxia Capital Management (SCM) and some of its clients own certain exchange traded funds but had no direct position in stocks mentioned in this article. No information accessed through the Investing Caffeine (IC) website constitutes investment, financial, legal, tax or other advice nor is to be relied on in making an investment or other decision. Please read disclosure language on IC “Contact” page.
The Buyback Bonanza Boost

With the S&P 500 off -1% from its all-time record high, many bears have continued to wait for and talk about a looming crash. For the naysayers, the main focus has been on the distorted monetary policies instituted by the Federal Reserve, but as I pointed out in Fed Fatigue is Setting In, QE and tapering talk are not the end-all, be-all of global financial markets. One need not look further than the dozen or so countries listed in the FT that have bond yields below the abnormally low yields we are experiencing in the U.S. (10-Year Treasury +2.75%).
Although there are many who believe a freefall is coming, much like a trampoline, a naturally occurring financial mechanism has provided a relentless bid to boost stock prices higher…a buyback bonanza! How significant have corporate stock repurchases been to spring prices higher? Jason Zweig, in his Intelligent Investor column, wrote the following:
In the Russell 3000, a broad U.S. stock index, repurchased $567.6 billion worth of their own shares—a 21% increase over 2012, calculates Rob Leiphart, an analyst at Birinyi Associates, a research firm in Westport, Conn. That brings total buybacks since the beginning of 2005 to $4.21 trillion—or nearly one-fifth of the total value of all U.S. stocks today.
To further put this gargantuan buyback bonanza into perspective, a recent Fox Business article described it this way:
Companies spent an estimated $477 billion on share buybacks last year. That’s enough to buy every NFL team 12 times over, run the federal government for 50 days or host the next nine Olympic Games with several billion left to spare. This year, companies are expected to ramp up buybacks by 35%, according to Goldman Sachs.
The bears continue to scream, while purple in the face, that the Fed’s QE and zero interest rate program (ZIRP) shenanigans are artificially propping up stock prices. The narrative then states the tapering and inevitable Fed Funds rate reversal will cause the market to come crashing down. While there is some truth behind this commentary, history reminds us that not all rate rising cycles end in bloodshed (see 1994 Bond Repeat or Stock Defeat?). Even if you believe in Armageddon, this rate reversal scenario is unlikely to happen until mid-2015 or beyond.
And for those worshipping the actions of Ms. Yellen at the Fed altar, believe it or not, there are other factors besides monetary policy that cause stock prices to go up or down. In addition to stock buybacks, there are dynamics such as record corporate profits, rising dividends, expanding earnings, reasonable valuations, improving international economies, and other factors that have contributed to this robust bull market.
At the end of the day, as I have continued to argue for some time, money goes where it is treated best – and generally that is not in savings accounts earning 0.003%. There is no reason to be a perma-bull, and I have freely acknowledged the expansion of froth in areas such as social media, biotech, Bitcoin and other areas. Regardless, there is, and will always be areas of speculation, in bull and bear markets (e.g., gold in the 2008-2009 period).
Magical Math
Investing involves a mixture of art and science, but with a few exceptions (i.e., fraud), numbers do not lie, and using math when investing is a good place to start. A simple but powerful mathematical formula instituted at Sidoxia Capital Management is the “Free Cash Flow Yield”, which is a metric we integrate into our proprietary SHGR (a.k.a.,“Sugar”) quantitative model (see Investing Holy Grail).
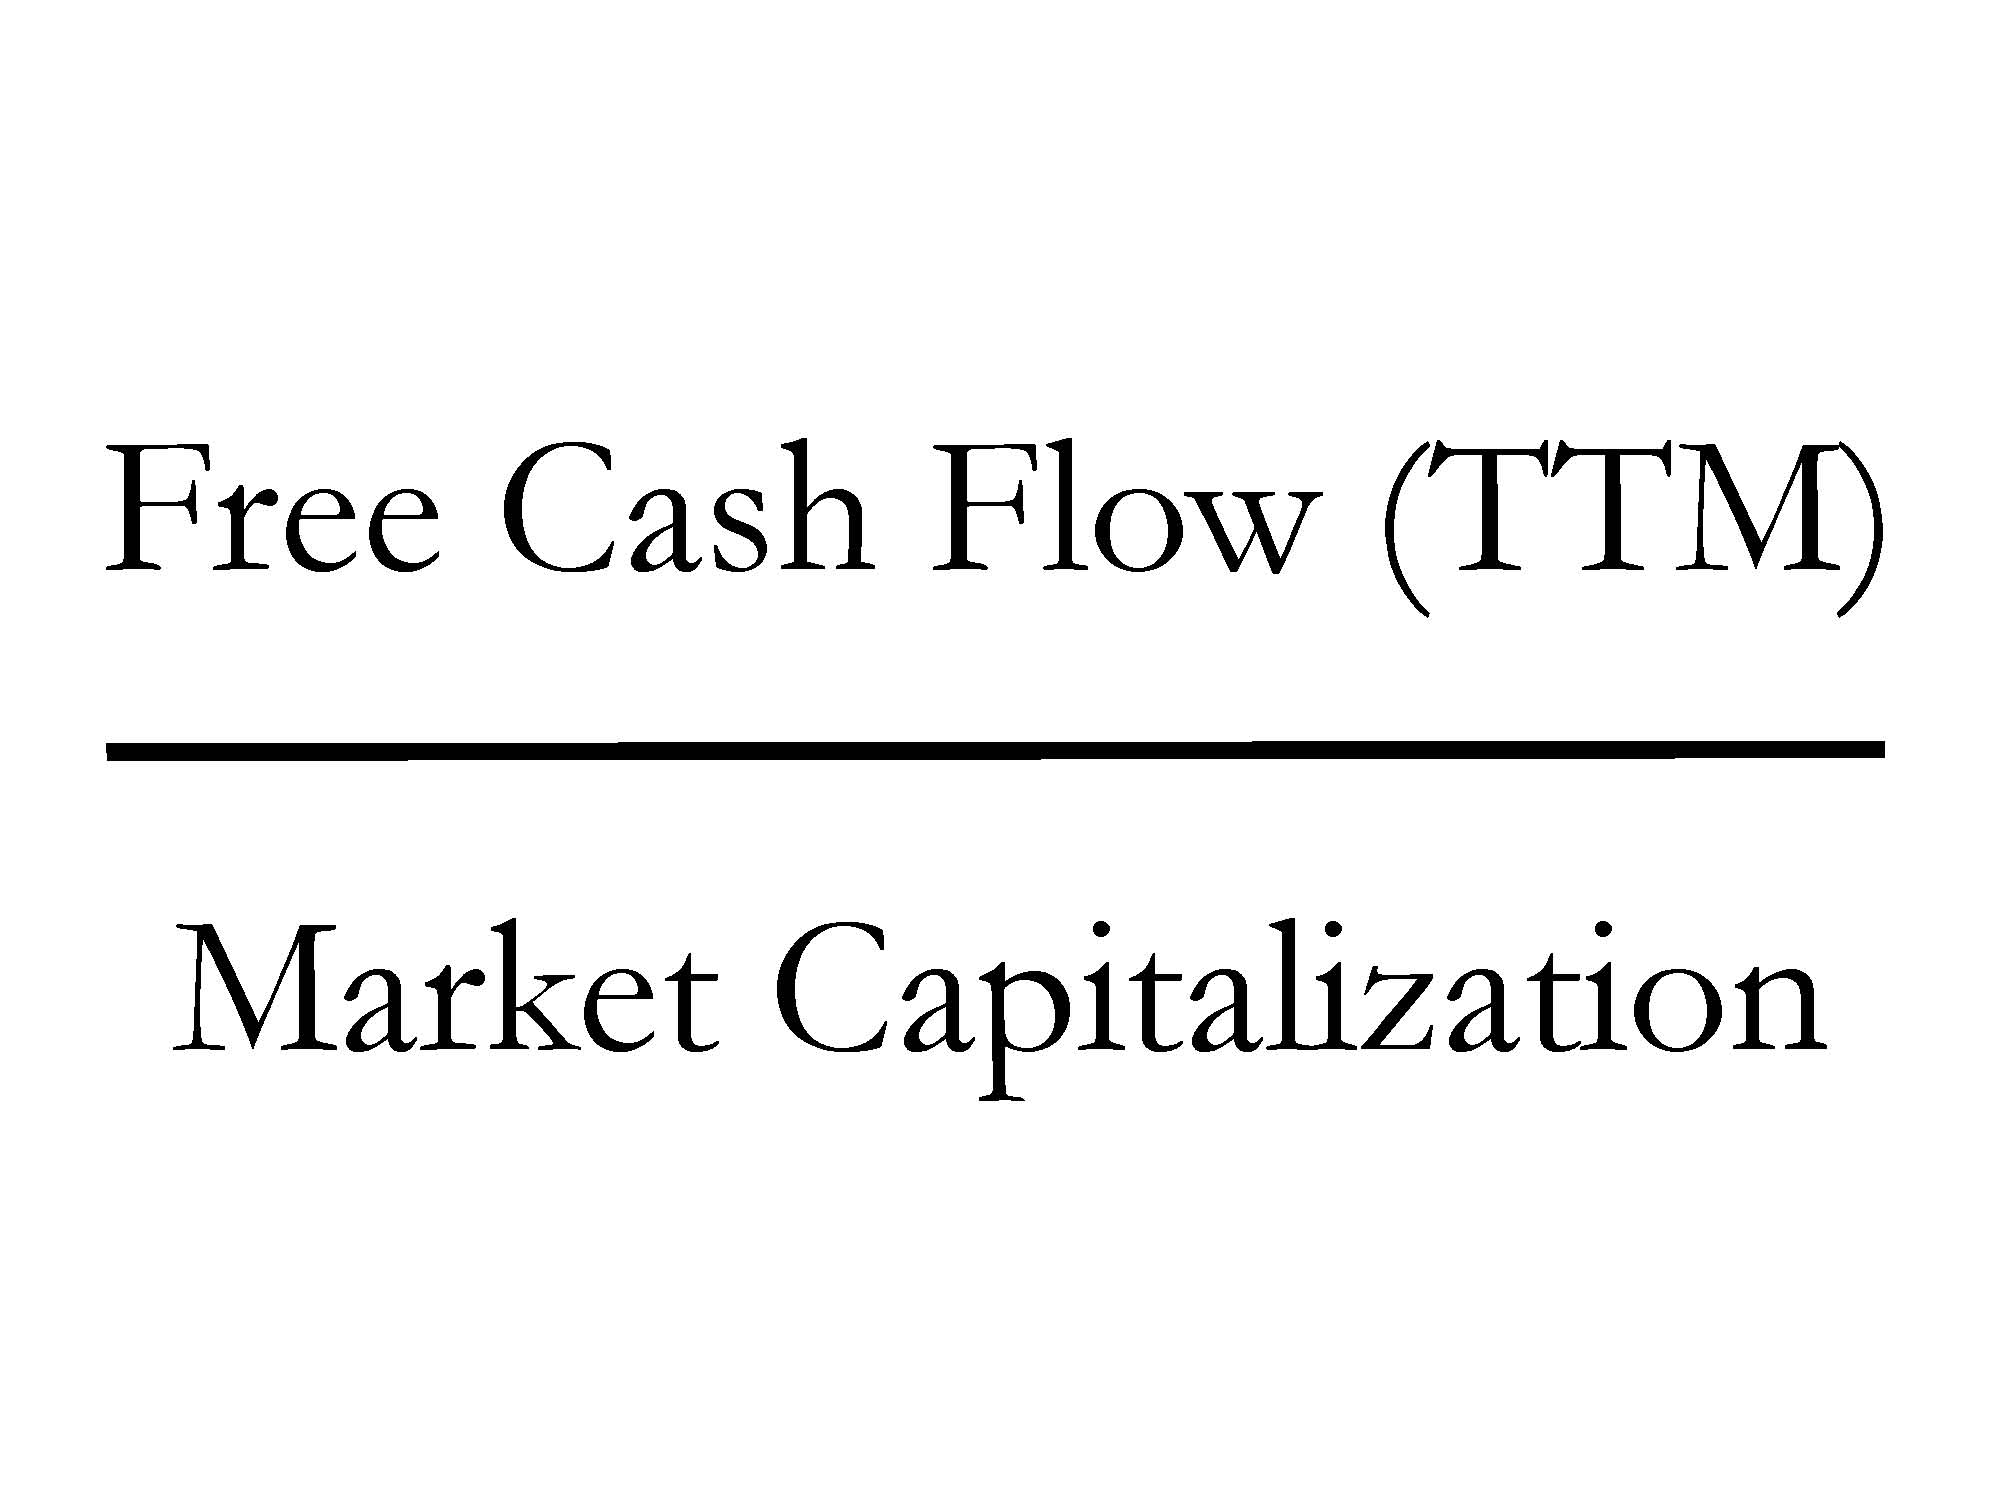
Quite simply, Free Cash Flow (FCF) is computed by taking the excess cash generated by a company after ALL expenses/expenditures (marketing, payroll, R&D, CAPEX, etc.) over a trailing twelve month period (TTM), then dividing that figure by the total equity value of a company (Market Capitalization). Mechanically, FCF is calculated by taking “Cash Flow from Operations” and subtracting “Capital Expenditures” – both figures can be found on the Cash Flow Statement. The Free Cash Flow ratio may sound complicated, but straightforwardly this is the leftover cash generated by a business that can be used for share buybacks, dividends, acquisitions, investments, debt pay-down, and/or placed in a banking account to pile up.
The great thing about FCF yields is that this ratio (%) can be compared across asset classes. For example, I can compare the FCF yield of Apple Inc – AAPL (+9.5%) versus a 10-Year Treasury (+2.75%), 1-year CD (+0.85%), Tesla Motors – TSLA (0.0%), Netflix, Inc – NFLX (-0.001%), or Twitter, Inc – TWTR (-0.003%). For growth and capital intensive companies, I can make adjustments to this calculation. However, what you quickly realize is that even if you assume massive growth in the coming years (i.e., $100s of millions in FCF), the prices for many of these momentum stocks are still astronomical.
An important insight about the current corporate buyback bonanza is that much of this price boost is being fueled by the colossal free cash flow generation of corporate America. Sure, some companies are borrowing through the debt markets to buy back stock, but if you were the Apple CFO sitting on $159,000,000,000 in cash earning 1%, it doesn’t make a lot of sense to sit on the cash earning nothing. It also doesn’t take a genius (or Carl Icahn) to figure out borrowing at record low rates (2.75% 10-year) while earning +10% on a stock buyback will increase shareholder value and earnings per share (EPS). More specifically, when Apple borrowed $17 billion at interest rates ranging from 0.5% – 3.9%, a shrewd, rational human being would borrow to the max all day long at those rates, if you could earn +10% on that investment. It is true that Apple’s profitability could drop and the numerator in our FCF ratio could decrease, but with $45 billion smackers coming in every year on top of $142 billion in net cash on the balance sheet, Apple has a healthy margin of safety to make the math work.
Where the math doesn’t compute is in insanely priced deals. For example, the recent merger in which Facebook Inc (FB) paid $19 billion (1,000 x’s the estimated 2013 annual revenues) for a 50-person, money-losing company (WhatsApp) that is offering a free service, makes zero financial sense to me. Suffice it to say, the FCF yield on WhatsApp could cause Warren Buffett to have a coronary event. Yes, diamond covered countertops would be nice to have in my kitchen, but I probably wouldn’t get much of a return on that investment.
Share buybacks are not a magical elixir to endless prosperity (see Share Buybacks & Bathroom Violators), but given the record profits and record low interest rates, basic math shows that even if stock prices correct (as should be expected), the trampolining effect of this buyback bonanza will provide support to the market.
Wade W. Slome, CFA, CFP®
Plan. Invest. Prosper.
DISCLOSURE: Sidoxia Capital Management (SCM) and some of its clients hold long positions in certain exchange traded funds (ETFs), AAPL and a short position in NFLX, but at the time of publishing SCM had no direct position in TSLA, TWTR, FB, Bitcoin, or any other security referenced in this article. No information accessed through the Investing Caffeine (IC) website constitutes investment, financial, legal, tax or other advice nor is to be relied on in making an investment or other decision. Please read disclosure language on IC Contact page.