Posts filed under ‘Trading’
A Tale of Two Cities

In 1859, Charles Dickens published his timeless historical novel, A Tale of Two Cities, set in London and Paris before and during the French Revolution (1775 – 1789). He opens the book with one of the most famous passages in literary history:
“It was the best of times, it was the worst of times, it was the age of wisdom, it was the age of foolishness, it was the epoch of belief, it was the epoch of incredulity, it was the season of Light, it was the season of Darkness, it was the spring of hope, it was the winter of despair.”
Nearly 170 years later, Dickens’ words could easily describe today’s stock market.
On one hand, the S&P 500 has climbed +9.6% this year and recently reached another all-time high – the “best of times.” On the other hand, many investors believe the artificial intelligence boom has become dangerously speculative and bears an uncomfortable resemblance to the technology bubble that burst in 2000 – the “worst of times.”
That divergence in sentiment was reflected in last month’s market performance:
- Dow Jones Industrial Average: +2.5%
- S&P 500: -1.1%
- NASDAQ: -2.8%
THE BEST OF TIMES
There are plenty of reasons why this multi-year bull market continues to march higher. Here are three of the most compelling.
AI Boom – Micron
As I discussed in last month’s article, The Multi-Trillion AI Tsunami, trillions of dollars are being invested across the artificial intelligence ecosystem.
Among the biggest beneficiaries are semiconductor memory companies such as Micron Technology, Inc. (MU), whose High-Bandwidth Memory (HBM) chips have become critical components powering next-generation AI data centers.
Micron recently reported extraordinary financial results as demand continues to outstrip supply. In its most recent quarterly report, Micron’s revenues more than quadrupled to $41.5 billion from $9.3 billion (+346%), a year ago. Profits for the three-month period skyrocketed even more by 15-fold to $28.2 billion from $1.9 billion (+1,398%).
Behind this remarkable growth is a structural supply shortage. Unlike software, semiconductor manufacturing capacity cannot be expanded overnight. Building a state-of-the-art memory fabrication facility requires billions of dollars of investment and typically takes three to four years to complete.
That lengthy construction timeline suggests favorable pricing and elevated profitability may persist well beyond the current earnings cycle, which explains Micron’s +837% spike in its stock price over the last year.
Earnings Are Rising Faster Than Stock Prices
Many investors assume record highs automatically mean expensive valuations. Not necessarily. Valuation depends on both price and earnings. When corporate earnings grow faster than stock prices, the market actually becomes less expensive despite reaching new highs.
Think back to elementary school fractions. If the denominator (earnings) grows faster than the numerator (price), the overall ratio becomes smaller. The same principle applies to the market’s Price-to-Earnings (P/E) ratio.
That is exactly what has occurred this year. Projected corporate profits are expected to surge +31%, causing the S&P 500’s valuation multiple to decline even as the index has reached record levels. One of my favorite long-term charts (below) illustrates this relationship perfectly. While stock prices can deviate from fundamentals over shorter periods, they ultimately follow the direction of corporate earnings.
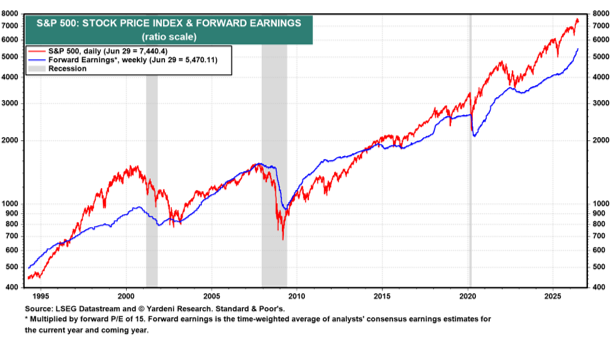
Source: Yardeni Research
Economic Momentum Is Improving
Another encouraging development is the improving economic backdrop. The ISM Manufacturing Index remains one of the most reliable gauges of economic activity. Readings above 50 signal expansion, while readings below 50 indicate contraction. Recent data show both the United States and the Eurozone moving back into expansionary territory, suggesting manufacturing activity and economic momentum are strengthening after an extended slowdown.
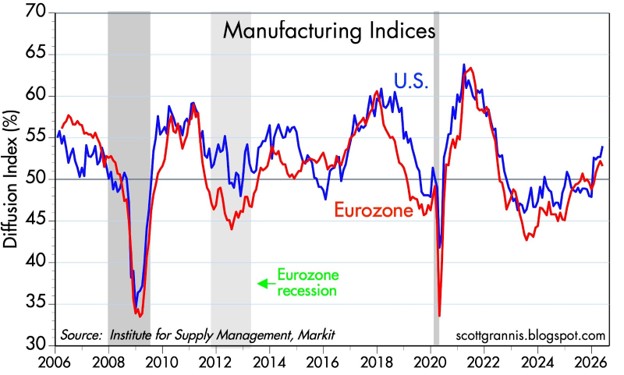
Source: Calafia Beach Pundit
THE WORST OF TIMES
As I discussed in my earlier article, The SaaSpocalypse Has Arrived?, the AI revolution is creating a palpable anxiety attack as broad swaths of Americans worry about AI agents stealing their $180,000 managerial positions for a $200/month subscription fee.
There are many reasons to remain optimistic about AI’s long-term benefits, but investors should also recognize several risks that could quickly shift today’s “best of times” into the “worst of times.”
Speculative Valuations
Although the overall market appears far more reasonably valued than during the peak of the Dot-Com Bubble, speculation has clearly returned to select areas of the market.
The recent public debut of Elon Musk’s SpaceX serves as a prime example. Despite generating billions in operating losses and burning -$9 billion in cash in its recent quarter, investors have assigned the company a valuation exceeding $2 trillion. Based on trailing revenues of approximately $19 billion, investors are effectively paying more than 100 times annual sales. Such valuations require extraordinary execution over many years to ultimately justify today’s prices.
Nor is the enthusiasm limited to SpaceX. Reports indicate AI leaders Anthropic and OpenAI are preparing their own public offerings, with expected valuations approaching $1 trillion despite annual revenues that remain a fraction of those levels. History teaches us that transformative technologies often create enormous long-term winners — but periods of genuine innovation can also produce speculative excess.
Geopolitical Risks
Although a tentative ceasefire currently exists between the United States and Iran, geopolitical conditions remain fluid. Markets have largely looked through the recent conflict, but history reminds us that geopolitical events can change quickly and unexpectedly. A deterioration in the Middle East could rapidly reverse investor sentiment.
AI-Driven Layoffs
The labor market remains relatively healthy, with unemployment near 4.3%. However, beneath the surface, signs of workforce restructuring continue to emerge as companies invest aggressively in automation and artificial intelligence.
Technology companies have announced approximately 125,000 layoffs this year—roughly 66% more than during the same period last year. Oracle recently announced plans to eliminate an estimated 21,000 positions. Robinhood is reducing its workforce by approximately 10%, while Cisco revealed it is slashing its workforce by 5% (4,000 jobs). Although today’s labor market remains resilient, investors should monitor whether AI-driven productivity gains ultimately translate into broader employment weakness.
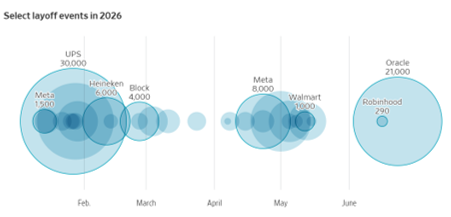
Source: Wall Street Journal
Final Thoughts
Last month’s mixed market performance reflects an investment landscape filled with both optimism and uncertainty.
If Charles Dickens were writing today, his Tale of Two Cities might instead be titled A Tale of Two Markets. The speculative excesses we experience in every technological revolution could lead to the “worst of times” but for now, the “best of times” is currently prevailing as investor optimism over AI’s productivity benefits remains front and center.
Wade W. Slome, CFA, CFP®
Plan. Invest. Prosper.
Disclosure: Sidoxia Capital Management (SCM) and some of its clients hold positions in certain exchange traded funds (ETFs), but at the time of publishing had no direct position in MU or any other security referenced in this article. No information accessed through the Investing Caffeine (IC) website constitutes investment, financial, legal, tax or other advice nor is to be relied on in making an investment or other decision. Each investor’s situation is unique so please work with a professional financial adviser, tax accountant or legal representative, as applicable, to develop an individualized plan or address any questions you may have. Investing involves risk including the possibility of loss of one’s investment.
The Multi-Trillion AI Tsunami Sweeping the Market
Not only has Artificial Intelligence (AI) dominated headlines, but a multi-trillion-dollar investment tsunami is creating a rising tide that has lifted many AI-related stocks to market leadership. Since the seismic launch of OpenAI’s ChatGPT in November 2022, investors have rushed to participate in what may be one of the largest technology investment cycles in history.
At my firm, Sidoxia Capital Management, we have been positioned in the AI rush for several years—well before ChatGPT became a household name. Close followers of my work know I have been tracking the AI revolution for years (see my previous analysis on my Investing Caffeine blog.
Goldman Sachs recently published an in-depth report highlighting the various AI scenarios and assumptions underlying an estimated $4 trillion to $8 trillion spending boom on compute (AI chips), data center infrastructure, and power investments over the next five years. As shown in the chart below, Goldman’s baseline capital expenditures scenario models a staggering $7.6 trillion in spending from 2026 to 2031. While variables like the lifespan of NVIDIA GPUs can shift annual AI spending estimates by hundreds of billions of dollars, the numbers remain enormous under virtually any scenario.
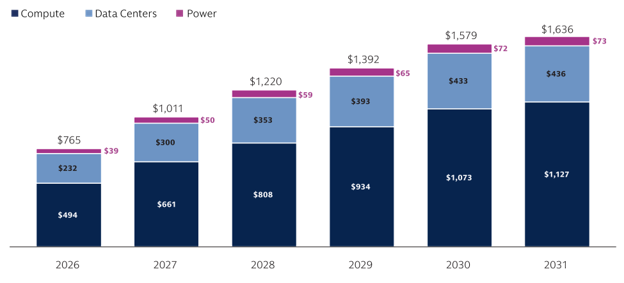
Source: Goldman Sachs
Market Momentum: Another Record-Breaking Month
For the month, the major indexes once-again vaulted to new record highs, driven by the AI capital expenditure cycle and a record level of profits:
· S&P 500: +5.2% (+10.7% year-to-date)
· NASDAQ: +8.4% (+16.1% year-to-date)
· Dow Jones Industrial Average: +2.8% (+6.2% year-to-date)
As I highlighted in last month’s post, it isn’t just speculative spending driving stock prices higher; it is an active AI productivity revolution that is causing corporate earnings to roar. This is especially true within the large-cap technology sector, which serves as the primary engine behind the S&P 500’s record-breaking performance.
It may seem counter-intuitive, but even as stock prices have reached record heights, valuations have actually become cheaper (sitting at a 20.9 forward P/E) compared to the peak price-to-earnings ratios seen in 2025. How is this possible? Quite simply, the denominator of the P/E ratio (earnings) has been growing at a faster clip than the numerator (stock prices), compressing the overall valuation multiple – see chart below.
Source: Yardeni.com
The Quest for Efficiency
Ultimately, the objective of every publicly traded company is straightforward: increase profits and cash flow. For most businesses, labor remains the largest operating expense. One of the most effective ways to reduce labor costs and improve efficiency is through technology investment. The chart below highlights the growing role technology plays within the economy as companies increasingly invest in automation, software, cloud computing, and AI. These investments often improve productivity, expand margins, and enhance long-term profitability.
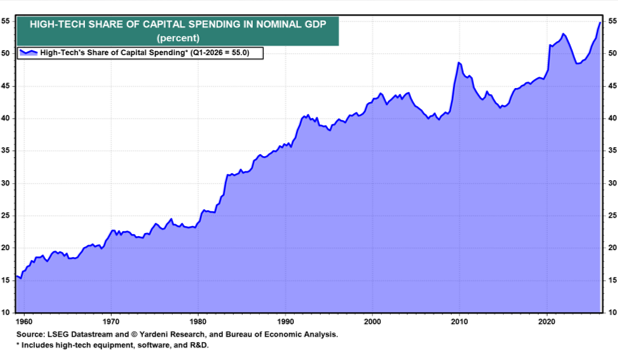
Source: Yardeni.com
As this disruptive AI revolution permeates all sectors of the economy, we are witnessing the early stages of a productivity renaissance. Even as unemployment rates slowly creep higher (reaching 4.3% from a 2023 low of 3.4%), corporate profit growth is accelerating while nominal GDP continues to chug along at a steady rate (see chart below).
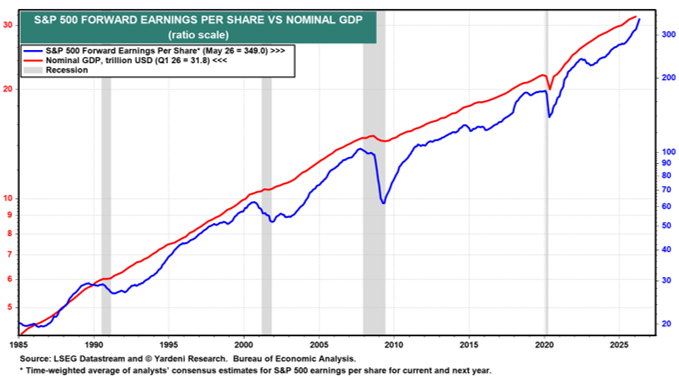
Source: Yardeni.com
The Infrastructure Winners
Underlying this economic growth are the individual companies building the foundation of the AI boom. Just five months into the year, a select group of infrastructure and semiconductor hardware companies have posted astronomical returns in 2026*:
Underlying the growth in profits and the economy are the individual companies driving the AI infrastructure boom. Even though we are only five months through the year, here is a small list of companies benefiting from and contributing to the rocketing growth in 2026 (YTD % Gains)*:
· Sandisk Corp. (SNDK) +604%
· Micron Technology Inc. (MU) +240%
· Dell Technologies Inc. (DELL) +234%
· Intel Corp. (INTC) +211%
· Western Digital Corp. (WDC) +208%
· Sterling Infrastructure Inc. (STRL) +181%
· Powell Industries Inc. (POWL) +168%
· Comfort Systems USA Inc. (FIX) +96%
· Vertiv Holdings Co. (VRT) +95%
*Sidoxia Capital Management and/or its clients hold positions in some of these companies (see Complete Strategy Performance and Disclosure at the bottom of this article or Click Here).
A major tailwind supporting these companies is the roughly $700 billion of capital expenditures expected in 2026 from hyperscale technology leaders such as Alphabet, Microsoft, Meta Platforms, and Amazon. These firms continue to aggressively invest in AI infrastructure to maintain competitive advantages and satisfy surging demand for AI-powered services – see AI Tech Spending article.
The Importance of Diversification (Even in a Hot Market)
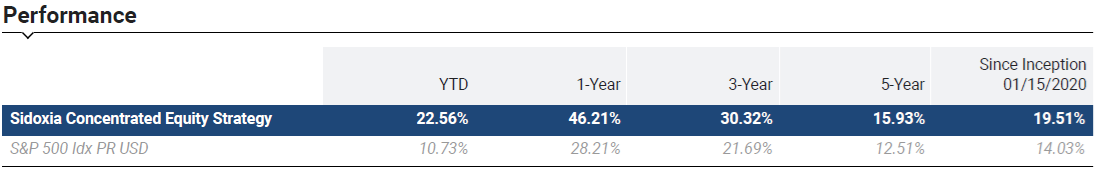
At Sidoxia, our concentrated equity portfolios have significantly outperformed the S&P 500 index in 2026, as well as on a 1-year, 3-year, and 5-year basis. However, our winning exposure in AI infrastructure stocks has been partially offset by underperformance in the cryptocurrency, healthcare, and software/SaaS sectors. This includes drags from holdings like Exzeo Group, Inc. (XZO, -43% YTD), Salesforce Inc. (CRM, -28%), and Roper Technologies Inc. (ROP, -27%).
Ultimately, this underscores the necessity of a balanced portfolio: the positive contributions from our top-performing names heavily outweighed the negative drag from the laggards, allowing our concentrated strategy to come out ahead.
No Signs of Slowing, But Watch the Horizon
Euphoria surrounding the AI spending wave shows no signs of abating in the near term. The highly anticipated upcoming Initial Public Offerings (IPOs) from private giants like SpaceX (SPCX), Anthropic, and OpenAI will likely add fuel to investor excitement. This naturally begs the question: are we inflating another technology bubble?
Trees don’t grow to the sky forever, and the same fundamental law applies to investing—eventually, the parabolic gains will slow or reverse.
The AI tsunami is currently in full force, and while it has created massive wealth today, historical market cycles remind us that unmanaged momentum can eventually cause financial damage to unprepared investors. Right now, there is no shortage of demand for AI services and infrastructure, keeping the market tide exceptionally high. Sidoxia and its clients have benefited tremendously from this secular trend, but we remain highly vigilant and active in managing risk for when the tide inevitably turns.
Stay tuned, and ensure your portfolio is properly structured to navigate the waves ahead.
Wade W. Slome, CFA, CFP®
Plan. Invest. Prosper.
Important Performance Disclosure: The specific positions discussed above were extracted based on the top and bottom performers from our overall Concentrated Equity Strategy portfolios. To see how these selections fit into our broader historical track record, please review our
Full Strategy Performance Sheet & Required Legal Disclosures (PDF)
Sidoxia Capital Management (SCM) and some of its clients hold positions in GS, STRL, POWL, FIX, VRT, XZO, CRM, ROP, and certain exchange traded funds (ETFs), but at the time of publishing had no direct position in any other security referenced in this article. Past performance is no guarantee of future results. Selections referenced in this article represent the top and bottom material contributors and do not reflect all positions bought or sold during this period.
ADDITIONAL DISCLOSURE: No information accessed through the Investing Caffeine (IC) website constitutes investment, financial, legal, tax or other advice nor is to be relied on in making an investment or other decision. Each investor’s situation is unique so please work with a professional financial adviser, tax accountant or legal representative, as applicable, to develop an individualized plan or address any questions you may have. Investing involves risk including the possibility of loss of one’s investment.
Stocks Soar as Profits Roar

The Geopolitical Dilemma: Iran Gone Wrong
It has been a volatile and unsettling period in the Middle East. Following more than a month of continuous bombing in Iran, the United States reached a tenuous ceasefire. While the active conflict has paused, the U.S. continues to maintain a financially crippling blockade against the Iranian regime.
If that geopolitical stress isn’t enough, oil prices remain elevated at $105 per barrel (WTI), roughly 57% above levels seen before the bombings began. Furthermore, gasoline prices hovering around the $4.40 per gallon threshold are acting like a brake that is slowing down global economic activity.
On the surface, this negative narrative sounds like a disastrous backdrop for financial markets. Yet, last month’s stock market performance tells a completely different story:
· S&P 500: +10.4%
· NASDAQ: +15.3%
· Dow Jones Industrial Average: +7.1%
Why the Disconnect?
Followers of my firm, Sidoxia Capital Management, and my blog, Investing Caffeine, know that geopolitics are rarely the primary drivers of long-term stock performance. Instead, we look to the “four legs of the Sidoxia stool”: profits, interest rates, valuations, and sentiments. For a deeper dive, check out my article: Don’t Be a Fool, Follow the Stool. The vital leg supporting the recent move in stocks has been soaring profits. As illustrated by data from Yardeni.com, S&P 500 profits (red line) are accelerating at a much steeper pace than those of the S&P 400 MidCap (blue line) and S&P 600 SmallCap (green line).
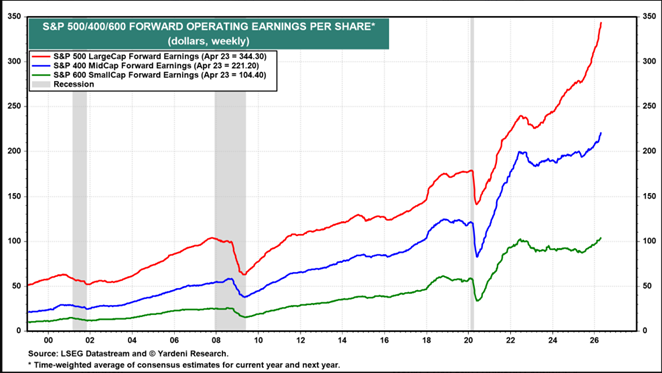
Source: Yardeni.com
A major contributor to this profit expansion is rising profit margins. Today, companies are earning a profit of approximately11 cents per dollar of sales, compared to just 5.5 cents during the 1970s and 1980s. The chart below highlights this phenomenon.
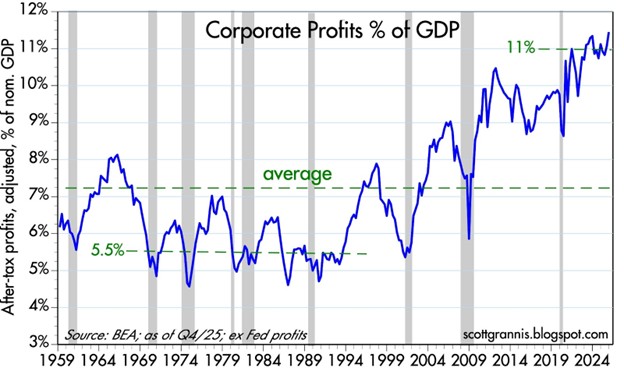
Source: Calafia Beach Pundit
The AI Productivity Revolution
What is driving much of this margin expansion? You guessed it: Artificial Intelligence.
We need to look no further than the mega-cap tech companies that reported Q1 financial results this week (Alphabet, Amazon, Microsoft, and Meta Platforms) to see how AI is helping companies cut costs and grow revenues:
- Combined, these four companies boast a revenue run-rate exceeding $1.7 trillion, with an accelerating growth rate above +22%.
- Meanwhile, headcount growth at these firms has remained virtually flat at < 2%. In fact, Meta and Microsoft recently announced a combined 20,000 in job cuts, raising concerns over an AI labor crisis.
These sales increases and expense reductions help explain last month’s surge in the performance of these stocks:
- Alphabet-Google (GOOGL): +33.9%
- Amazon.com Inc. (AMZN): +27.3%
- Microsoft Corp. (MSFT): +10.2%
- Meta Platforms Inc. (META): +6.8%
AI Driving the IPO Pipeline The AI boom is also creating massive value in the private markets. High-profile expected IPOs – including Elon Musk’s xAI, OpenAI (makers of ChatGPT), and Anthropic – are expected to exceed a combined $2 trillion in valuation. The graphic below shows the gargantuan size of these expected IPOs.
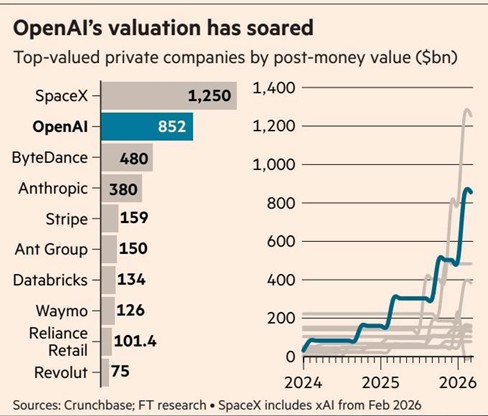
Source: Financial Times
The AI Train is Leaving the Station
AI is impacting every industry and every worker in some way, and this disruptive wave will undoubtedly displace some jobs. However, investors have the opportunity to jump on the train rather than be left behind.
As I noted in my recent article, The Saaspocalypse Has Arrived—or Has It?, if history repeats itself, the rollout of new technologies creates an influx of new industries and jobs that offset initial disruptions. If you work in an industry vulnerable to AI proliferation, taking advantage of the AI profit revolution can help offset potential financial disruption.
Of course, not everything is rainbows and unicorns. The Iranian conflict could still spiral out of control, which could quickly reverse recent stock market gains.
As I recapped for investors last month:
“History reminds us that while geopolitical shocks are terrifying in the moment, their impact on diversified portfolios is almost always temporary… In the world of investing, the best time to stay disciplined is exactly when everyone else is looking for the exit.”
Suffice it to say, geopolitics can and will impact short-term performance, but they rarely dictate long-term trends. When analyzing the market, it is crucial to remember a fundamental truth: When profits roar, stock prices often soar.
Wade W. Slome, CFA, CFP®
Plan. Invest. Prosper.
This article is an excerpt from a previously released Sidoxia Capital Management complimentary newsletter (May 1, 2026). Subscribe Here to view all monthly articles.
DISCLOSURE: Sidoxia Capital Management (SCM) and some of its clients hold positions in GOOGL, META, AMZN, MSFT, and certain exchange traded funds (ETFs), but at the time of publishing had no direct position in any other security referenced in this article. No information accessed through the Investing Caffeine (IC) website constitutes investment, financial, legal, tax or other advice nor is to be relied on in making an investment or other decision. Please read disclosure language on IC Contact page.
Bombs Away – Iran & Oil Spark an Explosive Month

The stock market felt the blast of geopolitical tension last month as all three major domestic indexes all retreated. In March, the S&P 500 fell -5.1%, the Dow Jones Industrial Average dropped -5.4%, and the NASDAQ slid -4.8%.
While a -5% monthly drop grabs headlines, perspective and context are key. Since the start of 2023, the S&P 500 remains up approximately +70% (excluding dividends). Even after the recent -7% pullback from January’s record highs, the index is still trading +35% above its April 2025 lows.
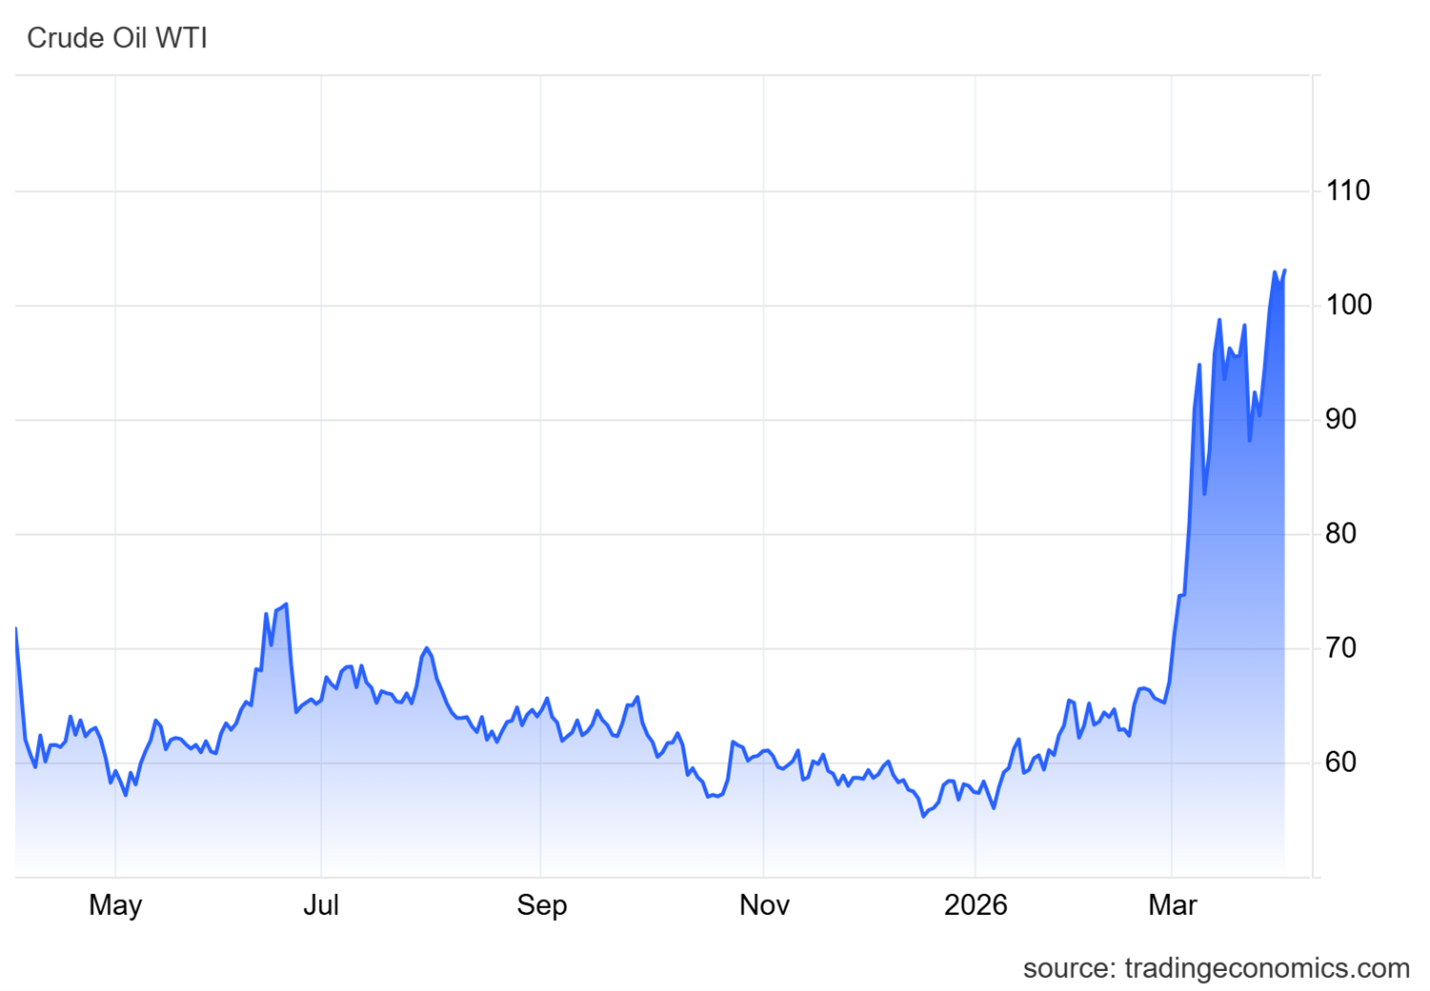
The Strait Has Created An Oil Gate
The primary catalyst for the market volatility is the escalating conflict involving the U.S., Israel, and Iran. Beyond the tragic human cost, the economic “bomb” has been the disruption of the Strait of Hormuz, which handles the flow of roughly 20% of the world’s oil supply.
Basic economics dictates that when supply is choked, prices skyrocket. We saw exactly that: WTI Crude spiked roughly +54% over the last month, surging from $67 to a peak near $103 per barrel (see chart below).
The “energy tax” from higher oil prices has introduced four major stressors for investors:
- Drained Consumer Wallets: Every extra dollar spent at the pump is a dollar not spent on groceries, healthcare, or retail. Since consumers disproportionately control the U.S. economy, cuts in discretionary spending on things like vacations, cars, and houses has a material negative impact on the nation’s financial output.
- Widespread Industrial Shock: High oil prices inflate costs for almost every physical industry, including airline fuel, trucking logistics, petroleum-based fertilizers, and construction inputs like asphalt and steel.
- Labor Market Cooling: The February jobs report was a wake-up call, showing a loss of -92,000 jobs (well below the expected gain of +130,000). While AI-driven displacement is a factor, the sudden spike in energy overhead has clearly contributed to employers pausing their hiring.
- Recessionary Red Flags: Prediction markets like Polymarket now place the probability of a U.S. recession by the end of 2026 at 34.5%, up significantly from just a few months ago (see chart below).
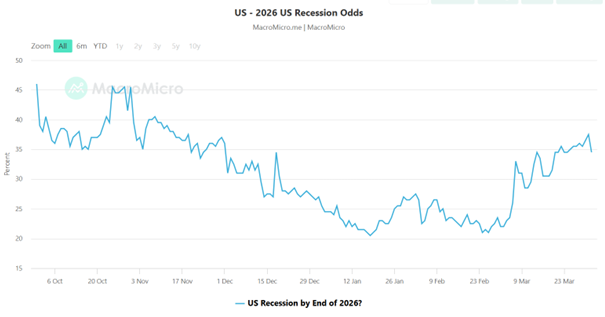
Source: MacroMicro & Polymarket
Geopolitical Noise vs. Market Reality
While current volatility feels unique, seasoned investors have seen this movie before. It is easy to forget that the S&P 500 slumped -21% last year as markets grappled with the administration’s aggressive tariff strategies, only to see prices roar back once the initial shock subsided. Even with the recent -7% pullback from January’s record highs, the S&P 500 remains +35% higher than the lows of April 2025.
Both the tariff friction and the Iranian conflict could be viewed as “self-inflicted” geopolitical maneuvers. While the long-term economic gains of these high-stakes decisions are still being debated, one short-term reality is certain: the November midterm elections are fast approaching.
History suggests that as elections loom, the administration will prioritize stability and “voter-friendly” economic conditions. We are already seeing a shift in rhetoric that suggests an “off-ramp” for the Iran conflict may be closer than the headlines imply. President Trump is addressing the nation today with an update on the current situation. When political capital is on the line, pragmatic pivots often follow unpopular volatility. What does this mean for investors? This means we are likely closer to the end of this Iranian conflict than we are to the beginning.
The Resilience of History
The last decade has been a relentless cycle of “unprecedented” global unrest. However, as the timeline below illustrates, geopolitical shocks have historically acted as speed bumps, not roadblocks, for long-term equity growth:
- 2026: Maduro Kidnapping (Venezuela)
- 2025: Operation Midnight Hammer (Iran)
- 2024: Collapse of the Assad Regime (Syria) & Moscow Terrorist Attack
- 2024: Houthi Red Sea Attacks
- 2023: Israel-Hamas Conflict
- 2022: Russia-Ukraine Invasion
- 2021: U.S. Withdrawal from Afghanistan
- 2017: North Korean “Fire and Fury”
- 2016: Brexit
- 2015: Paris Terrorist Attacks
The Bottom Line: Since the beginning of 2015, the S&P 500 has more than tripled (+217%). The data is clear: even in the face of horrific global events, the market’s primary engine – corporate innovation and earnings – tends to prevail. In the world of investing, a timeless (if cynical) truth remains: “When missiles fly, it’s time to buy!”
The Fed’s “Wet Towel”
This oil-driven inflation has also doused hopes for aggressive monetary easing. At the start of the year, the appointment of Kevin Warsh as the incoming Fed Chairman (set to succeed Jerome Powell in May) led markets to price in multiple rate cuts. However, the March “dot plot” (see chart below) revealed a much more hawkish reality. The Federal Reserve now projects only one 25-basis-point cut for the remainder of 2026, bringing the target range to 3.25%–3.50%. Seven officials now see zero cuts this year, reflecting a “higher for longer” stance as they battle renewed energy-led inflation.
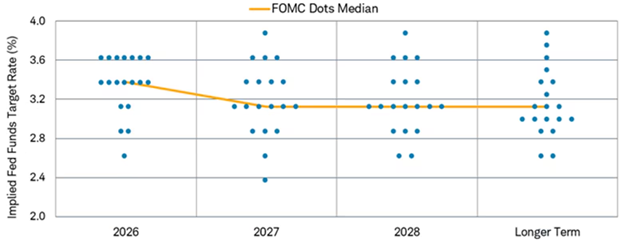
Source: Charles Schwab
The Sidoxia Strategy: Don’t Fear the Turbulence
History reminds us that while geopolitical shocks are terrifying in the moment, their impact on diversified portfolios is almost always temporary. Since 2015, the S&P 500 has more than tripled (+217%) despite a decade defined by the Russia-Ukraine war, the collapse of the Assad regime, and various “Operation Midnight Hammer” style conflicts.
As we look toward the November midterm elections, we expect political rhetoric to shift toward stabilization. President Trump has already signaled that an “offramp” for the Iranian conflict may be approaching, as high energy prices are rarely a winning campaign strategy. At Sidoxia, we aren’t distracted by the noise of the “bombs.” We continue to focus on fundamental valuations and opportunistically use this volatility to improve our clients’ positioning. In the world of investing, the best time to stay disciplined is exactly when everyone else is looking for the exit.
Wade W. Slome, CFA, CFP®
Plan. Invest. Prosper.
This article is an excerpt from a previously released Sidoxia Capital Management complimentary newsletter (Apr. 1, 2026). Subscribe Here to view all monthly articles.
DISCLOSURE: Sidoxia Capital Management (SCM) and some of its clients hold positions in certain exchange traded funds (ETFs), but at the time of publishing had no direct position in any other security referenced in this article. No information accessed through the Investing Caffeine (IC) website constitutes investment, financial, legal, tax or other advice nor is to be relied on in making an investment or other decision. Please read disclosure language on IC Contact page.
A Sleepy Stock that Can Wake Up Your Portfolio

In over 35 years of investing, I have rarely encountered a company in such a unique – and frustrating – position as Harmony Biosciences (“Harmony” – HRMY). As a shareholder through my firm, Sidoxia Capital Management, I approach this analysis with a dual lens: as an investor seeing immense value, and as a fiduciary who expects corporate leadership to act in the best interest of its owners.
While Harmony’s executive team has executed brilliantly on its clinical mission, they are currently failing their fiduciary duty regarding capital allocation. Here is why Harmony is a “Diamond in the Rough” that needs a wake-up call.
Harmony Biosciences Overview – A Rare Disease Powerhouse
Harmony is a neuroscience-focused company targeting rare and underserved conditions such as narcolepsy, Prader-Willi Syndrome, and certain rare epilepsies—areas where treatment options are limited or nonexistent.
Today, the vast majority of revenue is driven by narcolepsy, a neurological disorder that disrupts sleep-wake cycles and leads to excessive daytime sleepiness and sudden sleep attacks. While approximately 135,000–200,000 Americans are diagnosed, the true number is likely higher due to underdiagnosis and misdiagnosis.
Harmony’s flagship drug, WAKIX (pitolisant), is on track to surpass $1 billion in annual revenue in 2026, achieving blockbuster status. Importantly, WAKIX is the only FDA-approved narcolepsy treatment that is not a controlled substance as defined by the U.S. Drug Enforcement Administration (DEA), providing a meaningful competitive advantage over alternative therapies.
Significant Growth Beyond WAKIX
Harmony’s long-term opportunity extends well beyond narcolepsy. The company is leveraging the pharmaceutical compound behind its franchise drug WAKIX (pitolisant) to expand and diversify its revenue base into additional CNS (Central Nervous System) indications, with five ongoing Phase 3 registrational programs (see below):
- Pitolisant HD (High Dose) – Idiopathic Hypersomnia (IH) – potential $1.5 billion – $2.0 billion market with possible FDA submission for approval in 2027.
- Pitolisant HD (High Dose) – Narcolepsy – potential to accelerate the growth of $1 billion WAKIX franchise (2026 estimate) by offering enhanced efficacy for fatigue. FDA submission for approval of Pitolisant HD could come in 2027.
- Pitolisant – Prader-Willi Syndrome (PWS) – There are an estimated 15,000–20,000 people in the U.S. with PWS. Over half of these targeted patients suffer from EDS, which is effectively treated with Pitolisant. PWS has a potential of reaching $300 million – $500 million in revenue and receiving FDA submission for approval during the 2nd half of 2026.
- EPX-100 (Clemizole HCl) – Dravet Syndrome (epilepsy with onset at infancy) – expands Harmony into a potential $800 million global market by 2030 with possible FDA submission for approval in the 1st half of 2027.
- EPX-100 (Clemizole HCl) – Lennox-Gastaut Syndrome (LGS) (epilepsy with multiple seizure types) – opens the company to a potential $1 billion market globally.
Collectively, this pipeline has the potential to generate billions in incremental revenue.
A Diamond in the Rough

There are many ways to value a stock, but one common approach is to compare a company’s price-to-earnings ratio (P/E) to that of the S&P 500. Generally, stocks trading below the market’s average P/E are considered cheap, while those above it are viewed as more expensive.
Harmony shares currently trade at approximately 8x trailing twelve-month earnings and 7x its 2026 earnings forecast. By comparison, this represents roughly a -70% discount to the average S&P 500 stock. Based on these metrics, Harmony appears dramatically undervalued—assuming the company’s fundamentals remain intact.
Of course, valuation must be considered alongside growth and execution. On that front, management continues to emphasize strong underlying performance.
And the results support that claim. In less than three years, CEO Dr. Jeffrey Dayno has grown revenue by approximately 74%, from roughly $500 million in April 2023 to over $860 million today, with expectations to exceed $1 billion in annual sales by the end of the year.
But wait, there’s more. The balance sheet tells a similarly compelling story. Over that same period, Harmony’s net cash position (gross cash minus debt) has increased from approximately $201 million to $719 million, even after completing two acquisitions totaling about $69 million (Zynerba and Epygenix). During this time, quarterly revenue growth has averaged roughly +23%, while cash has more than tripled, despite the acquisitions.
What’s more, Harmony’s cash profitability is equally impressive. In 2025, Harmony generated a 40% free cash flow margin, meaning $0.40 of every $1 of revenue converted into free cash flow. That level of efficiency would rank among the top two percent of companies in the S&P 500, placing Harmony alongside some of the most profitable behemoths in the market, including NVIDIA Corp.
Which brings us to the key question: If the stock is this inexpensive and the fundamentals are this strong, why isn’t the company aggressively repurchasing its own shares hand-over-fist? To date, management has not provided a clear or credible answer to this question.
What is the Downside to Harmony?
All this fundamental strength and financial momentum sounds like great news for shareholders—but where’s the risk and bad news? Regrettably, despite strong execution under CEO Dr. Jeffrey Dayno over the past three years, the stock is down approximately -14% (from ~$32 to ~$28 per share).
If everything is going so well, why have investors been so spooked recently? The primary concern centers on potential generic competition for WAKIX, the company’s key drug. To Harmony’s credit, it has already settled litigation with six of seven generic challengers, but one holdout—AET Pharma—has taken the case to trial. Some Wall Street analysts and investors believe the judge may rule in favor of AET, which contributed to a sharp decline in the stock last month.
If Harmony loses, WAKIX’s patent protection—currently expected to extend through 2030—could be materially weakened, potentially allowing generic competition to enter the market as early as late 2026 or early 2027, depending on the timing of the ruling and subsequent developments.
Fear not, says management. They remain confident in their defense strategy. As CEO Dr. Dayno stated, “Pitolisant GR will extend the WAKIX franchise and our leadership in narcolepsy as a line extension of WAKIX with its broad clinical utility. We are on track for NDA submission in Q2 this year with a target PDUFA date in Q1 2027.”
Management believes this next-generation formulation, Pitolisant GR, could significantly mitigate—or even eliminate—the impact of generic competition. Unlike WAKIX, which faces potential patent challenges, Pitolisant GR is expected to have patent protection through 2044.
If the timeline holds, the company expects a substantial portion of WAKIX patients to transition to GR, reducing the impact of any generic entrants. Additionally, even in a worst-case scenario where AET prevails, the financial risk associated with launching an “at-risk” generic—particularly if Harmony were to win on appeal—could be significant enough to deter entry and easily push AET towards a settlement with Harmony.
Am I Missing Something?
When a stock trades at such an egregiously low valuation, I inevitably ask myself, “Am I missing something?” If management is sitting on its hands doing nothing, perhaps Harmony’s fundamental outlook is worse than they are leading investors to believe. If management is unwilling to deploy even a portion of its inefficient, over-bloated cash hoard toward share repurchases – especially with the stock arguably at its cheapest level in history – why should investors commit their hard-earned capital to what could be a sinking ship?
Is it possible that management lacks confidence in the Pitolisant GR NDA data, or that the Q2 NDA timeline could slip? If so, and if AET prevails in court, Harmony’s entire $1 billion franchise revenue base could be at risk.
Management has dismissed these concerns and continues to insist that everything is on track. If that’s truly the case, then – with a clear line of sight into the company’s prospects – Harmony should be aggressively buying back its stock if the outlook is as strong and rosy as they claim.
Actions Speak Louder than Words

According to management, Harmony’s fundamentals remain robust. Not only does Harmony have five late-stage, phase three indications in the pipeline, it also claims to have a near bullet-proof generic competition protection strategy. Yet, with the stock down around -33% from its 52-week high, it is difficult to justify why management is not forcefully repurchasing shares at prices that are currently highly accretive to EPS.
I have raised this issue with senior management multiple times, but unfortunately my concerns have fallen on deaf ears. I’m hardly alone – other investors have voiced similar frustrations but inaction remains the default stance of management. The company’s response to this elephant in the room remains perplexing.
On the most recent fourth quarter conference call with investors, CFO Sandip Kapadia stated, “Business development is a high priority, and our intention is to deploy capital to expand our pipeline and commercial portfolio.” CEO Dr. Jeffrey Dayno echoed this sentiment, emphasizing a “commitment to generate even greater value through the pursuit of smart business development opportunities.”
It’s great that Harmony “intends” to deploy capital and “pursue” opportunities, but the fact remains, Harmony effectively has not devoted a penny over the last two years to capital deployment, and the company has spent next-to-nothing on capital deployment since the company’s IPO (Initial Public Offering) in August 2020.
Meanwhile, the company’s massive net cash balance – currently $719 million – is rapidly expanding by more than $100 million+ per quarter and is on track to swell to $1 billion this year. By the end of 2026, cash could represent as much as two-thirds of Harmony’s total market value, particularly if the share price remains depressed or declines further.
Walking and Chewing Gum

Can Harmony walk and chew gum at the same time? In other words, can the company allocate a portion of its gigantic cash balance toward a monumentally accretive share repurchase program while simultaneously pursuing business development (M&A – Mergers & Acquisitions) opportunities? The short answer is yes.
In fact, Harmony did exactly that in 2023 and 2024 – deploying nearly half of its cash toward share buybacks while ALSO completing two acquisitions that contributed to its expanding pipeline of promising new indications.
Management argues it’s currently evaluating a broad list of acquisition targets. However, one could reasonably contend that Harmony will be hard-pressed to find opportunities more attractive than its own stock. The bar is exceptionally high: identifying highly profitable companies with similarly robust pipelines, that are also trading at a steep discount and offering comparable growth characteristics.
By comparison, Harmony’s own shares appear to trade at roughly a -70% discount to the market, with approximately 50% of its market capitalization in cash, while delivering ~20% top-line growth, and securing a deep pipeline of five Phase 3 programs. Under these conditions, it seems like Harmony buying back their own stock is a no-brainer.
Where Is the Board and Why Are They Not Acting?

This is a question I’m asking, and I hope the board will answer the capital allocation question more thoughtfully. Ideally, the response will come in the form of a material share repurchase (i.e., action).
For those curious, I have identified the distinguished group of Harmony board members, and I intend to pursue an explanation relating to the board’s inaction. Here are Harmony’s current board members:
- Jeffrey S. Aronin (Executive Chairman) – Founder and CEO of Paragon Biosciences.
- Jeffrey M. Dayno, MD (President, CEO & Director) – Former CMO of Harmony; Board-certified neurologist.
- Peter Anastasiou (Independent Director) – CEO of Capsida Biotherapeutics; former Lundbeck executive.
- Antonio Gracias (Independent Director) – Founder/CEO of Valor Equity Partners and Director at Tesla.
- Mark Graf (Independent Director) – Former CFO of Discover Financial Services.
- Ron Philip (Independent Director) – CEO of Orbital Therapeutics and former CEO of Spark Therapeutics.
- Juan Sabater (Independent Director) – Partner at Valor Equity Partners and former Goldman Sachs MD.
- Gary Sender (Independent Director) – Former CFO of Nabriva Therapeutics and Shire PLC.
- Linda Szyper (Independent Director) – Former COO of McCann Health; pharmaceutical sales veteran.
- Andreas Wicki, PhD (Independent Director) – CEO of HBM Healthcare Investments.
I’m not sure whether the board is asleep at the switch, but it has a clear fiduciary duty to allocate capital efficiently and maximize shareholder value. Allowing the balance sheet to become excessively bloated while taking no meaningful action falls short of that responsibility. The company needs to act.
As Harmony’s share price remains stagnant and under pressure, management and the board continue to irresponsibly let cash accumulate. Net cash now represents approximately 45% of the company’s market capitalization. If Harmony were in the S&P 500, this would place it among the top 1% of companies by cash as a percentage of market value – all while trading at roughly a -70% discount to the broader market.
We remain long-term shareholders, but there are only two plausible explanations. Either management is correct, and this represents a generational buying opportunity—or the company knows something investors do not, which may explain the lack of action and the continued buildup of cash.
Bottom line: assuming a successful defense against generic competition and a conservative rollout of the pipeline—including Pitolisant GR and Pitolisant HD—$7 in EPS by 2030 at a 22x multiple implies a $154 price target, or roughly +450% upside from today’s ~$28 share price.
Harmony may be a sleepy stock today, but it has all the ingredients to wake up your portfolio. While management and the board have been slow to act and have yet to fully meet their fiduciary responsibility on capital allocation, I remain optimistic that they will ultimately do the right thing. By deploying capital more effectively – most notably through a meaningful share repurchase at today’s historically attractive valuation – Harmony has the opportunity to awaken significant shareholder value and live up to its full potential.
Wade W. Slome, CFA, CFP®
Plan. Invest. Prosper.
DISCLOSURE: Sidoxia Capital Management (SCM) and some of its clients hold positions in HRMY, NVDA, TSLA, GS, and certain exchange traded funds (ETFs), but at the time of publishing had no direct position in DFS, HBMN, HLUYY, or any other security referenced in this article. No information accessed through the Investing Caffeine (IC) website constitutes investment, financial, legal, tax or other advice nor is to be relied on in making an investment or other decision. Please read disclosure language on IC Contact page.
The SaaSpocalypse Has Arrived…Or Has It?

Well, the new month has started with a bang. Financial markets have not only experienced a bang from another military strike on Iran, but also an explosion of AI paranoia. As hundreds of billions of AI investment dollars flood into the economy, fears are intensifying that the AI displacement of workers could have a detrimental impact on the economy and financial markets.
The Monthly Scorecard
It was a mixed performance in the market last month. Geopolitical headlines surrounding Iran and the Middle East are currently front and center, but under the surface, the real story isn’t just geopolitics—it’s a growing investor anxiety around artificial intelligence and its disruptive potential. Here’s what happened last month:
- S&P 500: -0.9%
- Dow Jones Industrial Average: +0.2%
- NASDAQ: -3.4%
The “SaaSpocalypse” and the Tech Identity Crisis
Software stocks are currently under assault, plunging -9.7% for the month and a staggering -22.8% for the start of the year (as measured by the IGV iShares Software index). Analysts are calling this the “SaaSpocalypse” (Software as a Service)—a phenomenon where the market fear is that AI is “eating” software companies.
High-profile casualties have added fuel to the fire. IBM, for example, suffered its worst trading day in 25 years, dropping -13% in a single day. Concerns came to light that new AI agent coding tools like Anthropic’s Claude Code could threaten IBM’s legacy dominance in COBOL-based mainframe systems.
Paranoia vs. Reality
This “AI Paranoia” has spread far beyond Silicon Valley, infecting industries like transportation, banking, travel, real estate, and food delivery. Two major catalysts fueled this fire:
The Citrini Report: A viral, dystopian report from described an “avalanche” of white-collar firings (see chart below). The report argues that while the government may try to intervene with stimulus, it “won’t change the fact that an AI Claude agent can do the work of a $180,000 product manager for $200/month.”
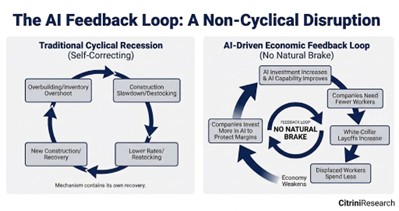
Source: Citrini Research
- Corporate Reductions: High-profile cuts have validated these fears. Block Inc. (led by Jack CEO Dorsey, former Twitter Founder) announced it is slashing 40% of its workforce due to AI advancements, while Amazon recently eliminated 30,000 white-collar positions (10% of its corporate staff).
However, there is a silver lining to that perspective. While software jobs have flattened since ChatGPT arrived in late 2022, we have yet to see the “cliff dive” in total employment that many predicted. In fact, employment (165 million employed) and labor force (172 million) figures are near record levels, so we have not seen AI kill the economy quite just yet (see chart below).
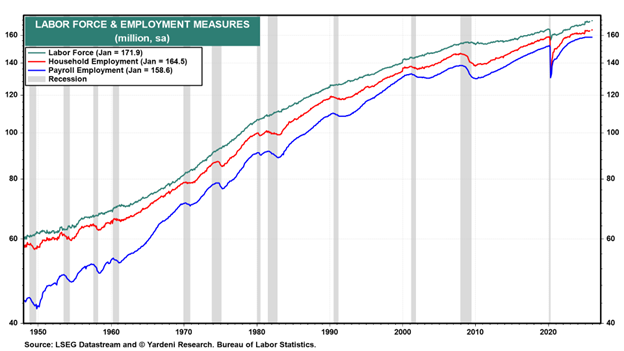
Source: Yardeni Research and Bureau of Labor Statistics
The Great Rotation: Looking for “HALO”
As investors try to decipher the winners and losers, they are migrating away from technology and rotating into HALO stocks (Hard Asset, Low Obsolescence). These companies are seen as less susceptible to AI disruption. Evidence of this shift is clear in the outperformance of value, small-cap, and mid-cap stocks. Notably, the Dow Jones Industrial Average, an index heavy with hard asset exposure, just posted its 10th consecutive month of gains despite the broader technology stock volatility.
A Massive Bet on the Future
Despite the “bubble” murmurs, the AI juggernauts are doubling down. OpenAI just closed the largest private financing in history, raising $110 billion—including $50 billion from Amazon, $30 billion from NVIDIA, and $30 billion from SoftBank. The demand for compute and data centers remains insatiable, supported by the $700 billion being spent by the large hyperscalers (Amazon, Alphabet-Google, Microsoft, and Meta Platforms) this year.
Geopolitical and Legal Headwinds
Adding to the month’s complexity are external shocks:
- Middle East Tensions: Military strikes on Iran recently killed the Iranian Supreme Leader, Ali Khamenei, and other key leaders, injecting significant geopolitical risk.
- Tariff Uncertainty: The Supreme Court recently ruled against the IEEPA tariffs instituted by the Trump administration. While temporary alternatives are in place, the markets are waiting for a permanent solution to work through the courts.
Resilience in the Face of Technological Change
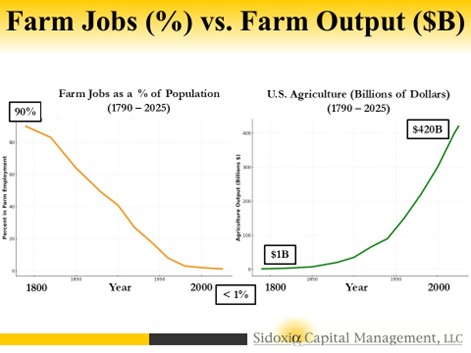
It is easy to get lost in the dystopian narrative, but history offers a more hopeful guide. Technology has been replacing human workers for centuries—from the looms of the Industrial Revolution to the tractors of the Agricultural Revolution – see chart below (1790 – 2025). In every instance, while specific roles were displaced, new industries emerged that not only soaked up the unemployed but expanded the labor force into areas we couldn’t have previously imagined (see also The Fallacy Behind Technological Innovation).
The reality today is that the economy remains remarkably strong. Employment data is resilient, labor force participation is near record levels, and corporate profits are breaking out to new all-time highs. Furthermore, the ISM Manufacturing PMI (Purchasing Managers Index) recently spiked to 52.6, signaling an expansion in a sector that had been declining for years (see chart below).
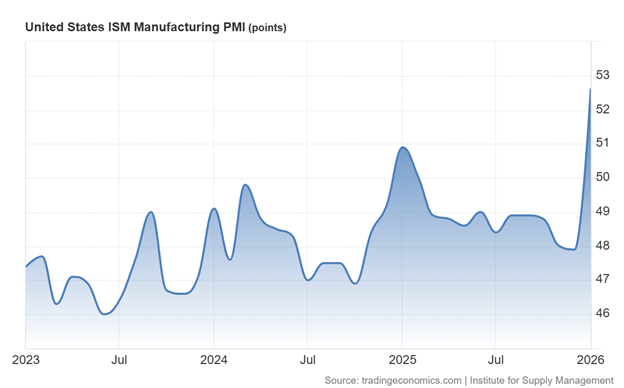
Source: Trading Economics
We are not witnessing the end of work, but rather a high-speed evolution. As we’ve seen before, the human capacity for innovation and adaptation usually outruns the machines.
Wade W. Slome, CFA, CFP®
Plan. Invest. Prosper.
This article is an excerpt from a previously released Sidoxia Capital Management complimentary newsletter (Mar. 2, 2026). Subscribe Here to view all monthly articles.
DISCLOSURE: Sidoxia Capital Management (SCM) and some of its clients hold positions in AMZN, GOOGL, META, MSFT, NVDA, certain exchange traded funds (ETFs), but at the time of publishing had no direct position in IBM, XYZ or any other security referenced in this article. No information accessed through the Investing Caffeine (IC) website constitutes investment, financial, legal, tax or other advice nor is to be relied on in making an investment or other decision. Please read disclosure language on IC Contact page.
Scary Headlines Abound as Dow Knocks on 50-Thou…What Now?

The Dow Jones Industrial Average first crossed the 40,000 milestone in mid-2024 (see Investing Caffeine – Dow 40,000), yet barely 18 months later, the index has notched another record closing high and is now knocking on the door of 50,000.
For the most recent month:
Dow Jones: +1.7%
S&P 500: +1.4%
NASDAQ: +1.0%
Remarkably, as we enter 2026 flirting with these major milestones, this marks the third consecutive year of double-digit gains across the major stock indices—despite what feels like a nonstop barrage of alarming and often unimaginable headlines.
And that’s the key point.
A World on Fire… According to the Headlines
• Greenland Takeover Threat: Over a year ago, President Trump declared U.S. control of Greenland an “absolute necessity” for national security amid rising Russian and Chinese Arctic influence. Last month, tensions escalated when a proposed tariff regime—starting at 10% and rising to 25%—was announced against Denmark and several European allies. Markets ultimately breathed a sigh of relief after tariffs and military threats were reversed following the announcement of a negotiated framework.
• Venezuelan Invasion: In early January, U.S. forces executed a high-precision raid of the Venezuelan capital of Caracas in the middle of the night, when President Nicolas Maduro was successfully extracted without any Americans killed. Maduro now faces narcoterrorism and corruption charges in federal court in Brooklyn. Meanwhile, Secretary of State Marco Rubio has spearheaded a plan that prioritizes the rebuilding of Venezuela’s oil infrastructure by seizing tankers and millions of barrels of sanctioned crude oil to finance the reconstruction.
• ICE Protests in Minnesota Turn Deadly: Immigration protests in Minnesota escalated last month, resulting in two high-profile fatalities as demonstrators clashed with federal ICE authorities (Immigration and Customs Enforcement).
• Government Shutdown (Again): A partial government shutdown began January 31, 2026, after six of twelve appropriations bills expired. Political gridlock—particularly surrounding DHS (Department of Homeland Security) and ICE funding—has once again sidelined Washington as lawmakers attempt to negotiate a resolution. House members gather back from recess on February 2nd in an attempt to end the budget standoff.
• Federal Reserve Leadership Uncertainty: Fed Chair Jerome Powell’s term expires in May. President Trump has nominated Kevin Warsh as his successor, criticizing “Too Late” Powell’s pace of rate cuts for years. Warsh, a former Fed Governor during the 2008 Financial Crisis, is widely respected but faces scrutiny regarding Fed independence, in part because he shares the President’s view that interest rates should be lower in the current environment. His Senate confirmation remains pending.
• Middle East Tensions in Iran: Following last year’s U.S. strikes on Iranian nuclear facilities, tensions have reignited amid reports of mass protester killings by Iran’s IRGC (Islamic Revolutionary Guard Corps). The U.S. has since mobilized substantial regional military assets, signaling possible intervention in support of regime change.
• Supreme Court Tariff Ruling Looms: The Supreme Court has yet to rule on the administration’s use of the International Emergency Economic Powers Act (IEEPA) of 1977 to impose sweeping global tariffs. A ruling against the government could trigger over $100 billion in retroactive refunds. The next decision window is February 20, 2026.
• U.S. Dollar Weakness: After declining roughly 10% in 2025, the dollar continued to weaken in January 2026 (-1%) – see chart below. Precious metals surged alongside the move—gold up +12% and silver +17% for the month—despite sharp end-of-month pullbacks.
• Cryptocurrency Collapse: Bitcoin has fallen roughly -38% from its October 2025 peak near $126,000 to about $78,000, once again challenging its “digital gold” and “store-of-value” narrative.
• Ongoing Ukraine War and Gaza Conflict: The Russia-Ukraine conflict drags into its fifth year, while violence persists in Gaza despite a loosely agreed ceasefire, with casualties continuing to rise.
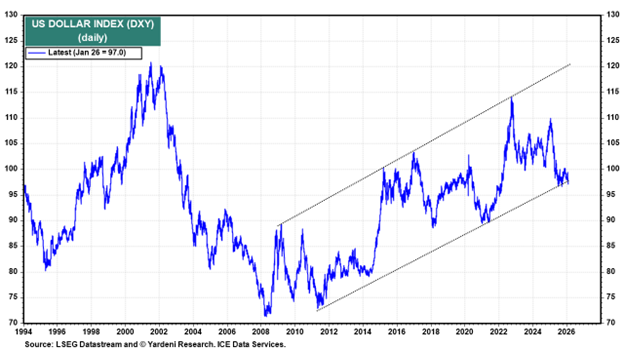
Source: Yardeni Research
Don’t Believe the Hype
That’s a staggering amount of uncertainty. So how has the stock market responded?
By soaring.
S&P 500 Returns:
2023: +24.2%
2024: +23.3%
2025: +16.4%
The verdict on 2026 remains unwritten—but so far, the trend remains intact.
For most of my professional career, I’ve urged investors to tune out fear-driven media narratives (see Turn Off the TV). History repeatedly shows there is little correlation between scary headlines and long-term stock prices.
In fact, I’ve argued before that bad news can often be good news for markets (see Bad News is Good News). Conversely, in 2022 we witnessed strong employment and solid economic growth—yet both stocks and bonds suffered significant losses.
What Actually Moves Markets (“The Stool”)

Rather than reacting to noise, investors should focus on what truly drives long-term returns. At Sidoxia Capital Management, we emphasize four foundational forces (see Don’t Be a Fool, Follow the Stool):
1. Profits
2. Interest Rates
3. Sentiment
4. Valuations
These four legs of the “Sidoxia Stool” exert far more influence over market direction than daily headlines ever will.
While the current environment presents a mixed picture across these factors, monitoring them—rather than reacting emotionally to media narratives—offers investors far greater clarity on where markets may head next. And whether the Dow reaches 50,000… or 100,000 likely won’t be decided by headlines. It will be decided by fundamentals.
Wade W. Slome, CFA, CFP®
Plan. Invest. Prosper.
This article is an excerpt from a previously released Sidoxia Capital Management complimentary newsletter (Feb. 2, 2026). Subscribe Here to view all monthly articles.
DISCLOSURE: Sidoxia Capital Management (SCM) and some of its clients hold positions in certain exchange traded funds (ETFs), but at the time of publishing had no direct position in any other security referenced in this article. No information accessed through the Investing Caffeine (IC) website constitutes investment, financial, legal, tax or other advice nor is to be relied on in making an investment or other decision. Please read disclosure language on IC Contact page.
Green Lights Everywhere… But Is It Time to Tap the Brakes?

The economic and market fundamentals appear to be flashing green lights everywhere. Growth is strong, inflation has cooled, and financial conditions have eased. Yet even with clear skies and open roads, experienced drivers know conditions can change quickly. It may not be time to slam on the brakes—but it could be time to keep a foot hovering nearby.
After the Federal Reserve aggressively applied the brakes in 2022 with seven rate hikes—taking the federal funds rate from 0.25% to 4.50%—the stock market declined nearly 19%. Since rates peaked at 5.50% in 2023, the Fed has cut rates six times, lowering them by a cumulative 1.75% to approximately 3.75%. Those cuts have helped pave the way for a smoother ride, providing a meaningful tailwind to equity markets.
That said, the most recent quarter-point cut produced mixed results. Last month, the Dow Jones Industrial Average rose +0.7%, the S&P 500 was essentially flat at –0.1%, and the NASDAQ lagged with a –0.5% decline.
Navigating the Winning Streak
We have encountered a few economic speed bumps along the way—tariffs and geopolitical events earlier in 2025, for example—but once investors realized those tariffs were more bark than bite (as I discussed previously in Tariff Sheriff), stocks resumed their impressive run. The market has now delivered three consecutive years of strong returns: 2023 (+24%), 2024 (+23%), and 2025 (+16%).
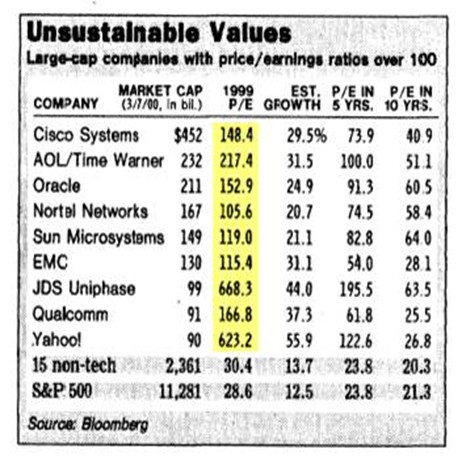
With these strong gains, today’s environment can feel like cruising on a national highway—clear roads, sunny skies, cruise control engaged, and little traffic in sight. The momentum could continue. Three strong years in a row do not rule out a fourth or fifth. In fact, the late 1990s offer a powerful reminder: from 1995 through 2000, the stock market averaged approximately 29% annual returns through the March 2000 peak (see table below). However, once the technology bubble burst, it took more than 13 years for the market to reclaim new year-end highs.
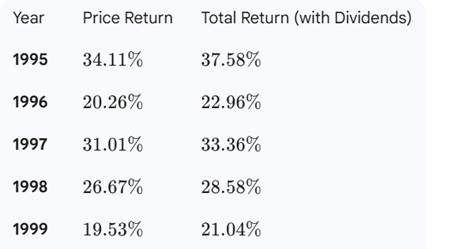
Source: Gemini
After more than three decades of investing, one lesson remains clear: trees can grow for years—but they do not grow to the sky forever. Bull markets often last longer than expected, but they eventually end.
Why the Forecast Looks Rosy
Several factors are supporting today’s strong market backdrop:
- Strong Economic Growth: Third-quarter GDP growth of 4.3% marked the fastest expansion in two years (see chart below)
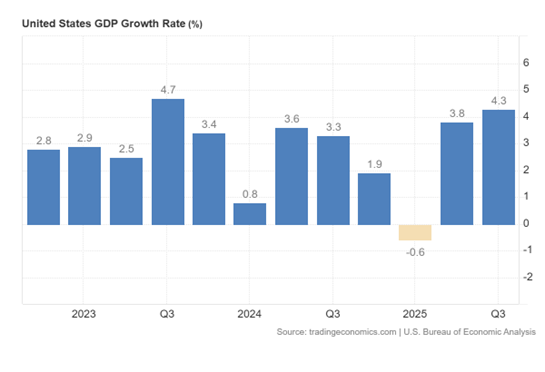
Source: Trading Economics
- AI-Driven Productivity: GDP growth has remained robust even as unemployment has risen from 4.0% earlier in the year to approximately 4.6% today. Growth outpacing employment is the definition of productivity, and the proliferation of artificial intelligence is accelerating this trend. Large companies such as Amazon.com (AMZN), Microsoft (MSFT), Alphabet-Google (GOOGL), and Meta Platforms (META) have reduced headcount significantly by tens of thousands in recent years while revenues and profits continue to surge (see also Mag 7 Takes Cash to the Bank).
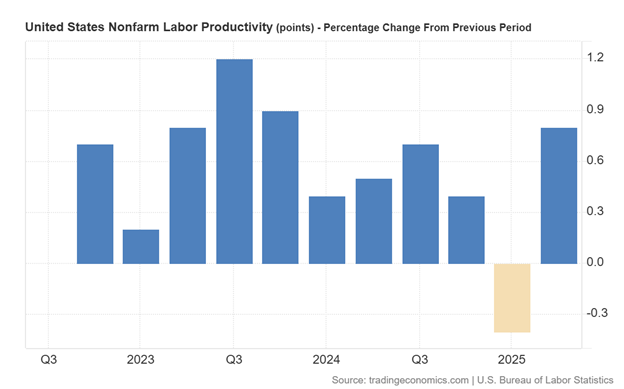
Source: Trading Economics
- Taming Inflation: Crude oil prices have fallen roughly 20% over the last year, and Owner’s Equivalent Rent (which makes up about one-third of CPI inflation) has been steadily declining—both positive signals for inflation pressures ahead (see chart below).

Source: Calafia Beach Pundit
- Lapping Tariffs: Tariffs represented a one-time price increase. As we move into 2026, their inflationary impact should diminish as those increases roll off.
- Narrowing Budget Deficit: While debt and deficits remain headline risks, federal spending has been flat over the past year while revenues have increased roughly 10%, according to Scott Grannis (see chart below).
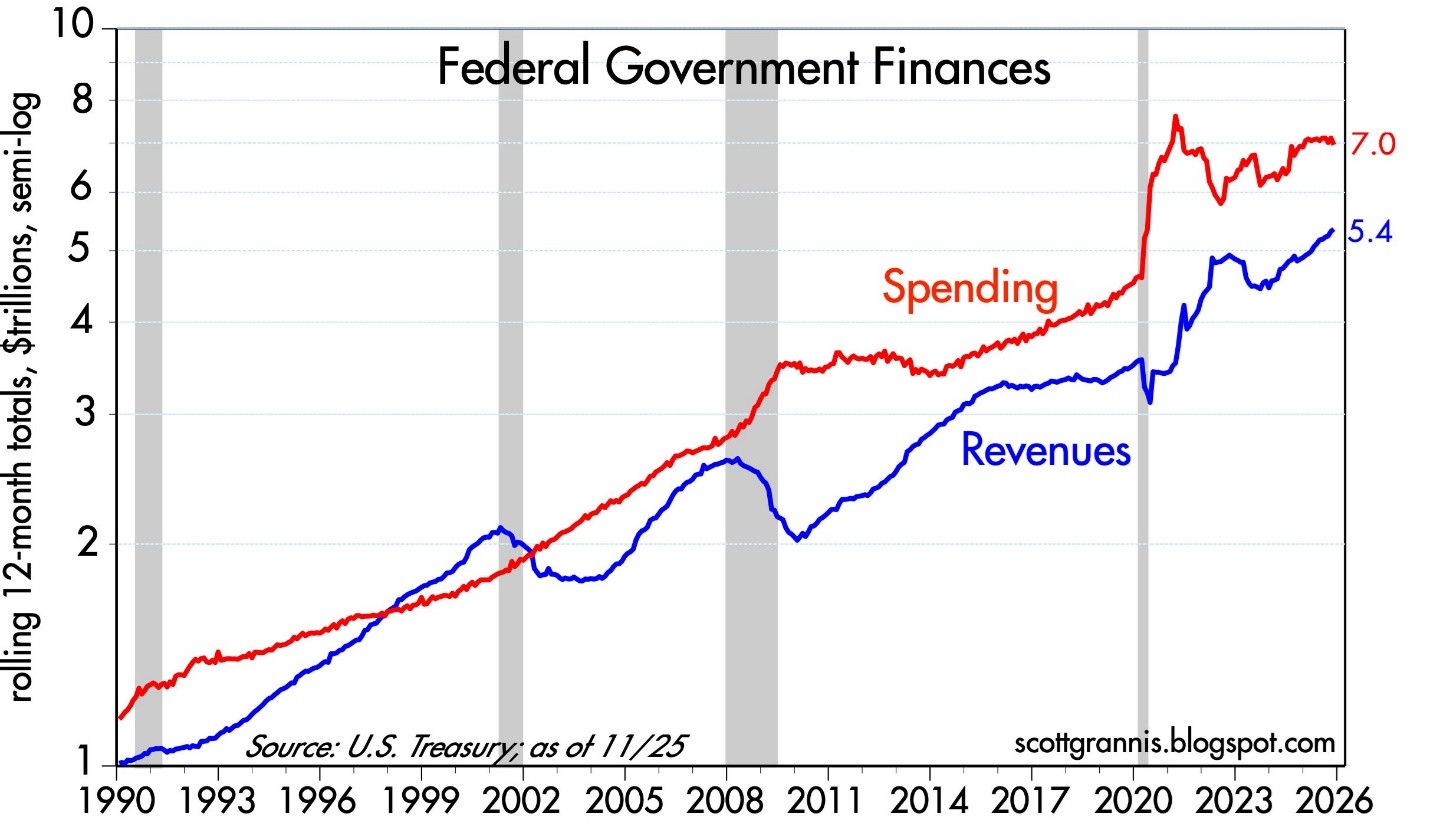
Source: Calafia Beach Pundit
- Tax Cuts & Higher Refunds Ahead: Many provisions of the One Big Beautiful Bill (OBBB) will be felt more fully in 2026, including 100% bonus depreciation for businesses, higher SALT deduction caps, increased standard deductions, no tax on tips or overtime, and a higher Child Tax Credit (CTC). Collectively, these could result in refunds up to $1,000 higher per individual.
Together, these factors could support continued market strength into 2026. But weather, road conditions, and markets can change quickly.
Reasons to Keep Your Foot Near the Brake Pedal
While the road looks smooth, several caution signs deserve attention:
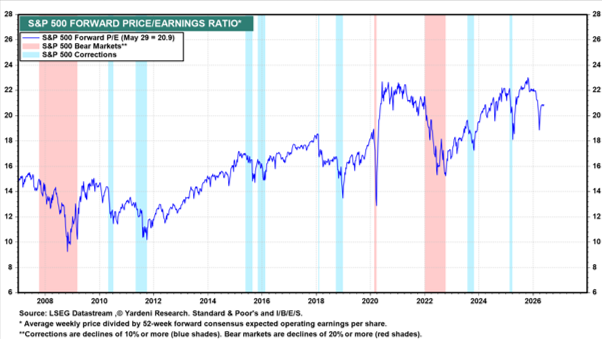
- Elevated Valuations: Forward price-to-earnings ratios (P/E) are at their highest levels since the late 1990s, outside of the brief post-COVID period. (see chart below).
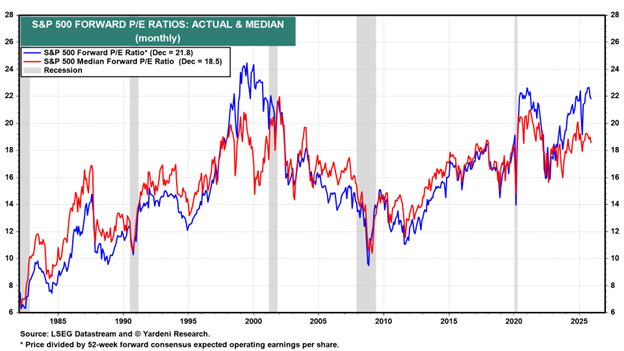
Source: Yardeni Research
- Animal Spirits Are Back: Speculation has expanded well beyond traditional markets. Prediction platforms such as Kalshi, Polymarket, FanDuel, DraftKings, Robinhood, Coinbase, and others now allow bets on everything from political outcomes to economic data—further evidence of speculative behavior.
- Gold and Silver Speculation: Despite a relatively stable U.S. dollar over the past six months, gold rose +64% and silver catapulted +145% in 2025—moves difficult to justify by fundamentals alone (see chart below).

Source: MarketSurge
- Investor Complacency: The Volatility Index (VIX), often called the “fear gauge,” currently hovers near 15, well below its long-term average of 20. Historically, true fear doesn’t surface until readings exceed 25.
- Market Concentration: The “Magnificent 7” stocks represent roughly 1% of the companies in the S&P 500 but account for about 37% of the index’s weighting (see Mag 7 Takes Cash to the Bank)—a concentration reminiscent of the late 1990s. When leadership narrows, downturns can be sharper.
The Sidoxia View
At Sidoxia Capital Management, we have implemented all-weather, time-tested strategies through decades of both bull and bear markets. We believe diversification and disciplined risk management are essential—not fruitless prediction attempts. Rather than attempting to time short-term market moves, we focus on adapting portfolios to changing conditions and navigating inevitable financial potholes.
We don’t always get it right, but over the long run, this approach has allowed us to earn and retain the trust, loyalty, and confidence of our clients.
After three years of strong performance, it’s easy to assume clear roads and blue skies will continue indefinitely. But history teaches us that the most dangerous moments often occur when confidence is highest. This is not a call to abandon the journey—only a reminder to stay alert. When markets accelerate this quickly, discipline, diversification, and risk management matter more than ever.
Wade W. Slome, CFA, CFP®
Plan. Invest. Prosper.
This article is an excerpt from a previously released Sidoxia Capital Management complimentary newsletter (Jan. 2, 2026). Subscribe Here to view all monthly articles.
DISCLOSURE: Sidoxia Capital Management (SCM) and some of its clients hold positions in MSFT, GOOGL, AMZN, META, and certain exchange traded funds (ETFs), but at the time of publishing had no direct position in ORCL or any other security referenced in this article. No information accessed through the Investing Caffeine (IC) website constitutes investment, financial, legal, tax or other advice nor is to be relied on in making an investment or other decision. Please read disclosure language on IC Contact page.
As We Give Thanks, AI and Mag 7 Take Cash to the Bank

Market volatility resurfaced last month as speculation intensified over whether an AI bubble may be forming—and potentially bursting. Yet despite the jitters, equity markets remain solidly positive for the year (S&P 500 +16.5%, NASDAQ +21.0%, Dow +12.2%) – see S&P 500 chart below. A significant portion of the gains have been powered in large part by ongoing strength in the Magnificent 7. Standouts such as NVIDIA (+31.8%) and Alphabet (+68.1%) have been instrumental in carrying the broader indices higher.

Even with these sizable year-to-date gains, memories of the 2000 Tech Bubble and 2008 Financial Crisis resurfaced and prompted investors to temporarily tap the brakes. Mid-month, the NASDAQ retreated roughly -9% from its October peak. After a month-end bounce, the S&P 500 finished essentially flat (+0.1%), the NASDAQ slipped -1.5%, and the Dow eked out a +0.3% increase.
OpenAI and the $1.4 Trillion Question
At the center of the AI controversy sits OpenAI, parent of the three-year-old technology toddler, ChatGPT (Generative Pre-trained Transformer), which now boasts more than 800 million global users (see chart below). The company reportedly runs at a $20 billion annual revenue pace, yet faces difficult questions about how it intends to fund its staggering $1.4 trillion AI infrastructure commitments.
Those concerns came to a head when tech investor Brad Gerstner pressed CEO Sam Altman on his podcast last month. Instead of answering how OpenAI plans to underwrite such an enormous buildout, Altman childishly shot back defensively:
“If you want to sell your shares, I’ll find you a buyer.” (See clip here — or full interview here)

Source: Digital Information World
OpenAI is a key player, but just one component in the vast—and rapidly expanding—web of global AI infrastructure. Gartner, a global research and advisory firm, forecasts $2 trillion of AI investment in 2026, while NVIDIA CEO Jensen Huang recently said:
“Over the next five years, we’re going to scale into… effectively a $3 to $4 trillion AI infrastructure opportunity.”
These provocative “Is this a bubble?” questions make for great headlines, but to truly evaluate AI sustainability, it’s wise to follow the classic Watergate guidance from of All the President’s Men character, Deep Throat (FBI Associate Director, Mark Felt), who tells journalist Bob Woodward to “follow the money,” if he wants to get to the bottom of the Watergate scandal.
The same principle applies to investors who follow the money – the picture looks very different from past bubbles.
Forget Pets.com—Today’s AI Buildout Is Being Funded by Cash-Rich Titans
Unlike the flimsy, profitless internet startups of the late 1990s—companies that raised billions based on “eyeballs” and cocktail-napkin business plans—the current AI buildout is being financed largely by profitable cash-generating giants.
Yes, some firms like Oracle (ORCL) are leaning on debt financing for data-center expansion. But the overwhelming majority of AI capex is being funded by customers and by the cash flow of the Magnificent 7, a group with the financial firepower to sustain multi-year spending without relying heavily on capital markets.
This dynamic alone separates today’s environment from classic bubble conditions.
Do the Magnificent 7 Really Deserve a $22 Trillion Valuation?
The Mag 7 represent only 1% of S&P 500 constituents yet account for a massive 35% of the index’s market value. That concentration understandably raises eyebrows, evoking historical parallels to the “Nifty Fifty” of the 1970s or the “Four Horsemen” of the 1990s.
But headline concentration can be misleading—because the fundamentals tell a very different story. Here are some of the major disparities:
1.) Mag 7 Share of Profits Matches Their Share of Market Value: The Mag 7 collectively contribute $22 trillion of the S&P 500’s $58 trillion total value (below). Said differently, the market values and weightings of the Mag 7 equate to about $22 trillion and 37% of the S&P 500, respectively:
· Nvidia Corp: $4.3T & 7.0%
· Apple Inc.: $4.1 T & 6.7%
· Alphabet Inc.: $3.9 T & 6.3%
· Microsoft Corp.: $3.7 T & 5.9%
· Amazon.com Inc.: $2.5 T & 4.0%
· Meta Platforms Inc.: $1.6T & 2.6%
· Tesla Inc.: $1.4T & 2.3%
· TOTAL: $22T / 37%
Source: Slickcharts
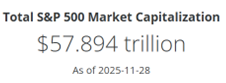
Conveniently (and importantly), the Mag 7’s roughly $747 billion in annual cash flow (see table below) is a good proxy for their profit contribution to the $2 trillion in S&P profits.
Source: SEC Filings & MarketSurge
The $747 billion in Mag 7 cash flows divided by the $2 trillion in S&P 500 coincidentally also equates to 37% ($747B/$2T).
These calculations of the Mag 7 are not bubble math—these calculation comparisons are rational math. Arguments could be made that Mag 7 market values are actually undervalued (not in bubble territory) and should appreciate to a higher percentage of the S&P 500 weightings because these 7 stocks are growing sales and profits faster than compared to the other “absentee” 493 stocks in the index.
2.) Mag 7 are Swimming in Cash: That $747 billion in annual cash flow is on track to hit a jaw-dropping $1 trillion, giving these firms ample capital to fund AI buildouts without substantially accessing the equity or credit markets. The ability to self-fund a multi-trillion-dollar infrastructure expansion is the opposite of bubble behavior.
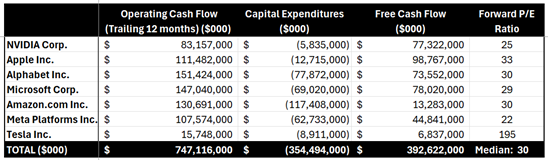
3.) Valuations Are Elevated—but Far from Bubble Territory: During the 2000 Tech Bubble, many leading tech names traded at 100x+ earnings (See also: Rational or Irrational Exuberance. Today, the Mag 7 trade at a median forward P/E around 30x. Expensive? Historically, yes, versus long-term averages, but nowhere near historical extremes. Relative to growth, profitability, and cash flow, valuations are far more grounded today than during prior manias.
The bottom line is there is plenty to be thankful for and bubble fears are overstated. Despite pockets of AI froth, the underlying economic engine powering AI adoption is real, profitable, and well-capitalized. When investors follow the money, they discover:
· The Mag 7 generate over one-third of S&P 500 profits
· They generate and hold hundreds of billions in cash
· They largely fund their own AI capital expenditures
· Valuations remain far below bubble-era extremes
Investors have a lot to be thankful for. And while volatility will likely continue, the ingredients for a classic, catastrophic AI bubble are noticeably absent. For disciplined, long-term investing strategies like those employed at Sidoxia Capital Management, this environment still offers abundant opportunity—without the need to fear a pricked AI balloon anytime soon.
Wade W. Slome, CFA, CFP®
Plan. Invest. Prosper.
This article is an excerpt from a previously released Sidoxia Capital Management complimentary newsletter (Dec. 1, 2025). Subscribe Here to view all monthly articles.
DISCLOSURE: Sidoxia Capital Management (SCM) and some of its clients hold positions in NVDA, AAPL, MSFT, GOOGL, AMZN, META, TSLA, and certain exchange traded funds (ETFs), but at the time of publishing had no direct position in ORCL or any other security referenced in this article. No information accessed through the Investing Caffeine (IC) website constitutes investment, financial, legal, tax or other advice nor is to be relied on in making an investment or other decision. Please read disclosure language on IC Contact page.
Rational or Irrational Exuberance?

The government may be shut down, but the stock market hasn’t noticed. In fact, stocks just capped another record-breaking month. The S&P 500 gained +2.3%, the NASDAQ climbed +4.7%, and the Dow rose +2.5%.
Millions of Americans are feeling the downside of the shutdown—from disrupted travel to stalled services and furloughed workers. Historically, such uncertainty rattles Wall Street. This time? Investors seem more captivated by the transformative promise of artificial intelligence (AI).
So, the key question today: Is this AI-driven exuberance rational—or irrational?
Exuberance Then vs. Exuberance Now
Having invested for more than 35 years, I’ve seen periods of euphoria and fear. I vividly remember December 1996 when Fed Chair Alan Greenspan famously questioned whether markets were becoming “irrationally exuberant.” Back then, the NASDAQ sat near 1,300. Over the next three years it soared past 5,100 (almost quadrupling), only to crash nearly 80% by 2002.
But here’s the twist: it’s true, we did experience a “tech bubble burst”, but where is the NASDAQ index value today? Amazingly, the index stands at 23,000 (see chart below) – an 18x increase above the 1996 level when Greenspan gave his irrational exuberance speech! So, in hindsight, the sound we heard during 2000 was not the tech bubble bursting but rather an internet Big Bang! The internet wasn’t a speculative fad—it was the foundation of a global transformation.
So, what about AI?

Source: Macrotrends LLC
Internet Cycle vs. AI Supercycle
The internet era lifted the number of online users from zero to five billion—over 60% of the planet (see chart below). The AI wave kicked off publicly in November 2022 with ChatGPT’s release. In under three years, the NASDAQ has more than doubled. That pace isn’t sustainable forever, of course. Bubbles form, emotions swing, and markets correct. But dismissing AI as a fad ignores its unmistakable—and accelerating—impact.

Source: BOND – Mary Meeker
With the rapid appreciation in the stock market, it’s important for investors to identify and understand the warning signs of potential bubble bursting or market crash. In fact, I continue to do my part by studying past crashes. My shipment of Andrew Ross Sorkin’s book, 1929: Inside the Greatest Crash in Wall Street History just arrived and all these lessons remind us that not all booms are bubbles, and not all crashes end innovation.
Not All Bubbles are Created Equal
Major market drawdowns are part of a long-term investor’s journey:
- 1929: Great Crash
- 1973-74: Nifty-Fifty
- 1987: Black Monday
- 2000: Dot-com bust
- 2008: Financial crisis
- 2020: COVID crash
Many pundits today are now asking is this AI surge the next bubble? Valuations, as measured by P/E ratios (Price/Earnings), suggest a very different setup than in 2000.
Back then, many tech leaders traded at 100x+ earnings. Today’s Magnificent Seven tech leaders are elevated, but nowhere near dot-com extremes:
- NVIDIA Corporation (NVDA): 57x
- Apple Inc. (AAPL): 36x
- Microsoft Corp. (MSFT): 36x
- Alphabet Inc. (GOOG): 32x
- Amazon.com, Inc. (AMZN): 31x
- Meta Platforms, Inc. (META): 23x
*Source: MarketSurge – only Tesla, Inc. (TSLA) has a P/E higher than 100x.
For the S&P 500 overall, the index has a forward P/E of 22.8x (Yardeni Research), significantly lower than 2000 levels and nowhere near bubble territory.
Source: Wall Street Journal – March 14, 2000
Life After the Internet and Life After AI Introduction
Think back 25 years:
- Renting movies at Blockbuster before Netflix went digital
- Driving to the bank for deposits
- Buying stamps to mail checks before Venmo or Zelle
Today, those activities feel prehistoric. AI is set to reshape daily life on an even faster timeline — from medicine and logistics to entertainment and marketing.
I’m discovering “AI epiphanies” weekly.
- With a few prompts, I created a beautiful Mother’s Day poem and became a poet hero despite never writing poetry before.
- When I recently needed to write an obituary for my mother, AI helped structure and refine it in minutes instead of taking me hours.
- Just last month I needed to hunt down lobster bisque for a shrimp pasta recipe I wanted to make. It turned into a time-wasting scavenger hunt. Thankfully, AI found it in stock, even when multiple apps insisted it wasn’t available. Needless to say, the recipe was incredibly delicious, and my stomach thanked ChatGPT.
And when it comes to investing? Evaluating biotech companies used to take weeks. Now, detailed research can be synthesized in days without sacrificing rigor. AI isn’t replacing insight — it’s amplifying output.
Not All AI Stories Are “Unicorns and Rainbows”
AI boosts productivity. Higher productivity means some companies need fewer people. Amazon recently announced 14,000 layoffs despite reporting amazing financial results. Microsoft and Meta have also announced thousands of employee layoffs even as profits rise.
This isn’t doom and gloom — it’s innovation cycles in action. Technology displaces tasks before ultimately creating new industries and roles.
So… Rational or Irrational?
Although there has been much debate regarding whether we are in an AI bubble, from my perspective, we are in the very early innings of a long AI revolutionary game. There are definitely pockets of frothiness that expose investors to undue risk, but if you can follow a disciplined, diversified, valuation-sensitive investment strategy, like we implement at Sidoxia Capital Management, I feel that the current exuberance is more rational than irrational.
Wade W. Slome, CFA, CFP®
Plan. Invest. Prosper.
This article is an excerpt from a previously released Sidoxia Capital Management complimentary newsletter (Nov. 3, 2025). Subscribe Here to view all monthly articles.
DISCLOSURE: Sidoxia Capital Management (SCM) and some of its clients hold positions in NVDA, AAPL, MSFT, GOOGL, AMZN, META, TSLA, and certain exchange traded funds (ETFs), but at the time of publishing had no direct position in any other security referenced in this article. No information accessed through the Investing Caffeine (IC) website constitutes investment, financial, legal, tax or other advice nor is to be relied on in making an investment or other decision. Please read disclosure language on IC Contact page.


