Posts filed under ‘Themes – Trends’
Yellen is “Yell-ing” About High Stock Prices!

Earlier this week, Janet Yellen, chair of the U.S. Federal Reserve, spoke at the Institute for New Economic Thinking conference at the IMF headquarters in Washington, D.C. In addition to pontificating about the state of the global economy and the direction of interest rates, she also decided to chime in with her two cents regarding the stock market by warning stock values are “quite high.” She went on to emphasize “there are potential dangers” in the equity markets.
Unfortunately, those investors who have hinged their investment careers on the forecasts of economists, strategists, and Fed Chairmen have suffered mightily. Already, Yellen’s soapbox rant about elevated stock prices is being compared to former Fed Chairman Alan Greenspan’s “Irrational Exuberance” speech, which I have previously discussed on numerous occasions (see Irrational Exuberance Déjà Vu).
Greenspan’s bubble warning talk was given on December 5, 1996 when the NASDAQ closed around 1,300 (it closed at 5,003 this week). Greenspan specifically said the following:
“But how do we know when irrational exuberance has unduly escalated asset values, which then become subject to unexpected and prolonged contractions as they have in Japan over the past decade?”
After his infamous speech, the NASDAQ index almost quadrupled in value to 5,132 in the ensuing three years before cratering by approximately -78%,
Greenspan’s successor, economics professor Ben Bernanke, didn’t fare much better than the previous Fed Chairmen. Unlike many, I give full credit where credit is due. Bernanke deserves extra credit for his nimble but aggressive actions that helped prevent a painful recession from expanding into a protracted and lethal depression.
With that said, as late as May 2007, Bernanke noted Fed officials “do not expect significant spillovers from the subprime market to the rest of the economy.” Moreover, in 2005, near the peak in housing prices, Bernanke said the probability of a housing bubble was “a pretty unlikely possibility.” Bernanke went on to add housing price increases, “largely reflect strong economic fundamentals.” Greenspan concurred with Bernanke. Just a year prior, Greenspan noted that the increase in home values was “not enough in our judgment to raise major concerns.” History has proven how Bernanke and Greenspan could not have been more wrong.
If you still believe Yellen is the bee’s knees when it comes to the investing prowess of economists, perhaps you should review Long Term Capital Management (LTCM) debacle. In the midst of the 1998 Asian financial crisis, Robert Merton and Myron Scholes, two world renowned Nobel Prize winners almost single handedly brought the global financial market to its knees. Merton and Scholes used their lifetime knowledge of economics to create complex computerized investment algorithms. Everything worked just fine until LTCM lost $500 million in one day, which required a $3.6 billion bailout from a consortium of banks.
NASDAQ 5,000…Bubble Repeat?
Janet Yellen’s recent prognostication about the valuation of the U.S. stock market happens to coincide with the NASDAQ index breaking through the 5,000 threshold, a feat not achieved since the piercing of the technology bubble in the year 2000. Investing Caffeine readers and investors of mine understand today’s NASDAQ index is much different than the NASDAQ index of 15 years ago (see also NASDAQ Redux), especially when it comes to valuation. The folks at Bespoke put NASDAQ 5,000 into an interesting context by adding the important factor of inflation to the mix. Even though the NASDAQ index is within spitting distance of its all-time high of 5,132 (reached in 2000), the index would actually need to rally another +40% to reach an all-time “inflation adjusted” closing high (see chart below).

Source: Bespoke Investment Group
Economists and strategists are usually articulate, and their arguments sound logical, but they are notorious for being horribly bad at predicting the future, Janet Yellen included. I agree valuation is an all-important factor in determining future stock market returns. Howeer, by Robert Shiller, Janet Yellen, and a host of other economists relying on one flawed metric (CAPE PE), they have not only been wildly wrong year after year, but they are recklessly neglecting many other key factors (see also Shiller CAPE Smells Like BS).
I freely admit stocks will eventually go down, most likely a garden variety -20% recessionary decline in prices. While from a historical standpoint we are overdue for another recession (about two recessions per decade), this recovery has been the slowest since World War II, and the yield curve is currently not flashing any warning signals. When the eventual stock market decline happens, it likely will not be driven by high valuations. The main culprit for a bear market will be a decline in earnings – high valuations just act as gasoline on the fire. Janet Yellen will continue to offer her opinions on many aspects of the economy, but if she steps on her soapbox again and yells about stock market valuations, you will be best served by purchasing a pair of earplugs.

Wade W. Slome, CFA, CFP®
Plan. Invest. Prosper.
DISCLOSURE: Sidoxia Capital Management (SCM) and some of its clients hold positions in certain exchange traded funds (ETFs), but at the time of publishing, SCM had no direct position in any other security referenced in this article. No information accessed through the Investing Caffeine (IC) website constitutes investment, financial, legal, tax or other advice nor is to be relied on in making an investment or other decision. Please read disclosure language on IC Contact page.
Netflix: Burn It and They Will Come

In the successful, but fictional movie, Fields of Dreams, an Iowa farmer played by actor Kevin Costner is told by voices to build a field for baseball playing ghosts. After the baseball diamond is completed, the team of Chicago White Sox ghosts, including Shoeless Joe Jackson, come to play.
Well, in the case of the internet streaming giant Netflix Inc (NFLX), instead of chasing ghosts, the company continues to chase the ghosts of profitability. Netflix’s share price has already soared +63% this year as the company continues to burn hundreds of millions in cash, while aggressively building out its international streaming footprint. Unlike Kevin Costner, Netflix investors are likely to eventually get spooked by the by the stratospheric valuation and bleeding cash.
At Sidoxia, we may be a dying breed, but our primary focus is on finding market leading franchises that are growing cash flows at reasonable valuations. In sticking with my nostalgic movie quoting, I believe as Cuba Gooding Jr. does in the classic movie, Jerry Maguire, “Show me the money!” Unfortunately for Netflix, right now the only money to be shown is the money getting burned.
Burn It and They Will Come
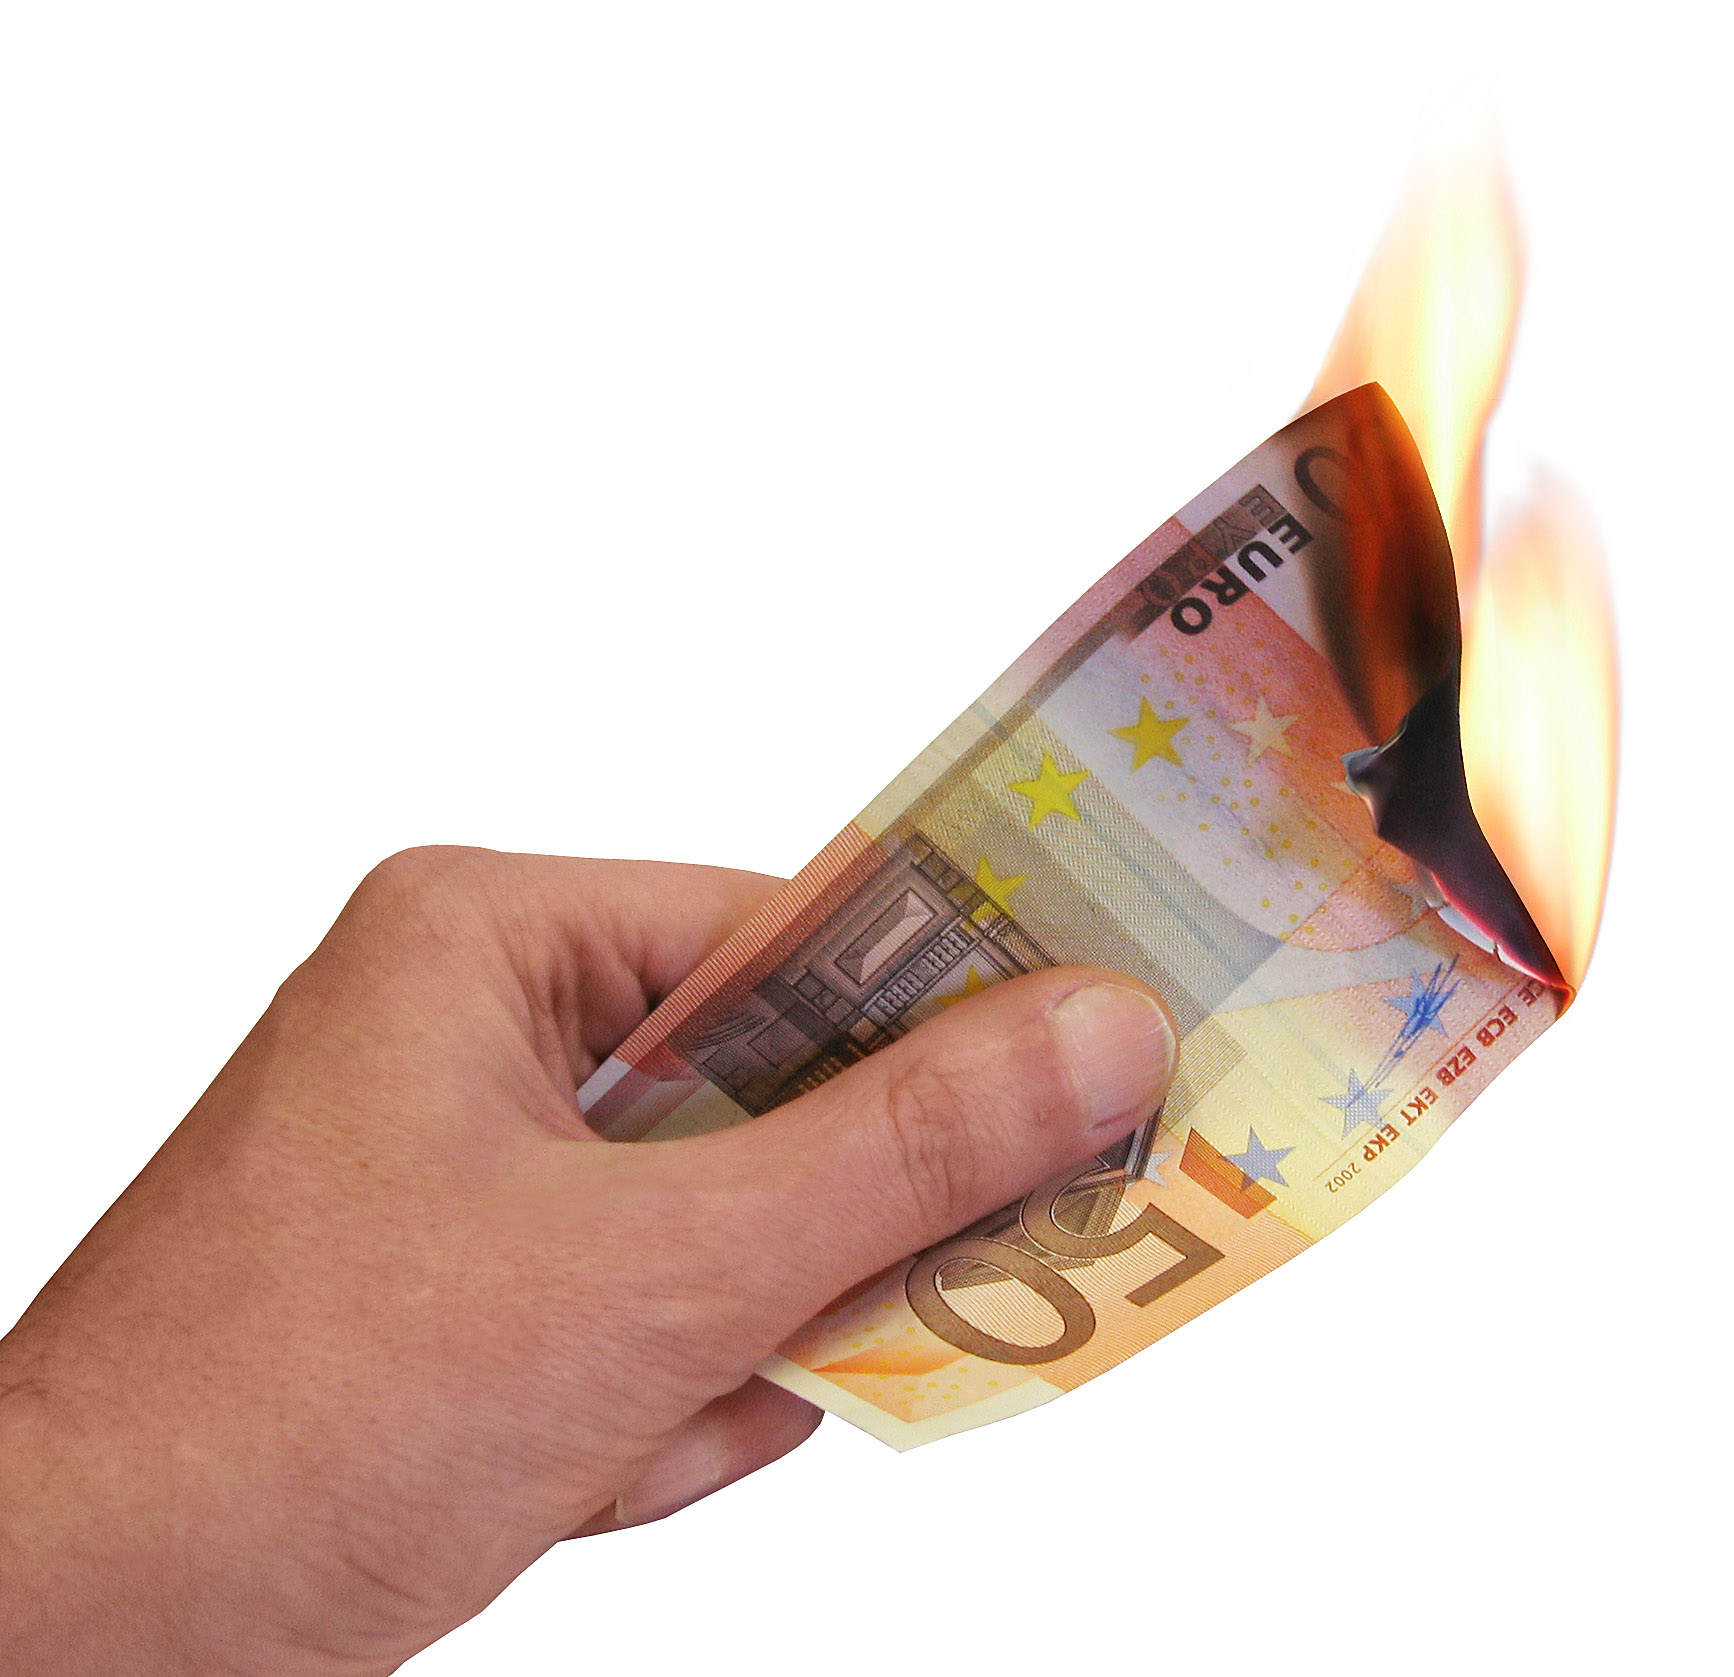
In a little over three years, Netflix has burned over -$350 million in cash, added $2 billion in debt, and spent approximately -$11 billion on streaming content (about -$4.6 billion alone in the last 12 months). As the hemorrhaging of cash accelerates (-$163 million in the recent quarter), investors with valuation dementia have bid up Netflix shares to a head-scratching 350x’s estimated earnings this year and a still mind-boggling valuation of 158x’s 2016 Wall Street earnings estimates of $3.53 per share. Of course the questionable valuation built on accounting smoke and mirrors looks even more absurd, if you base it on free cash flow…because Netflix has none. What makes the Netflix story even scarier is that on top of the rising $2.4 billion in debt anchored on their balance sheet, Netflix also has commitments to purchase an additional $9.8 billion in streaming content in the coming years.
For the time being, investors are enamored with Netflix’s growing revenues and subscribers. I’ve seen this movie before (no pun intended), in the late 1990s when investors would buy growth with reckless neglect of valuation. For those of you who missed it, the ending wasn’t pretty. What’s causing the financial stress at Netflix? It’s fairly simple. Beyond the spending like drunken sailors on U.S. television and movie content (third party and original), the company is expanding aggressively internationally.
The open check book writing began in 2010 when Netflix started their international expansion in Canada. Since then, the company has launched their service in Latin America, the United Kingdom, Ireland, Finland, Denmark, Sweden Norway, Netherlands, Germany, Austria, Switzerland, France, Belgium, Luxembourg, Australia, and New Zealand.
With all this international expansion behind Netflix, investors should surely be able to breathe a sigh of relief by now…right? Wrong. David Wells, Netflix’s CFO had this to say in the company’s recent investor conference call. Not only have international losses worsened by 86% in the recent quarter, “You should expect those losses to trend upward and into 2016.” Excellent, so the horrific losses should only deteriorate for another year or so…yay.
While Netflix is burning hundreds of millions in cash, the well documented streaming competition is only getting worse. This begs the question, what is Netflix’s real competitive advantage? I certainly don’t believe it is the company’s ability to borrow billions of dollars and write billions in content checks – we are seeing plenty of competitors repeating the same activity. Here is a partial list of the ever-expanding streaming and cord-cutting competitive offerings:
- Amazon Prime Instant Video (AMZN)
- Apple TV (AAPL)
- Hulu
- Sony Vue
- HBO Now
- Sling TV (through Dish Network – DISH)
- CBS Streaming
- YouTube (GOOG)
- Nickelodeon Streaming
Sadly for Netflix, this more challenging competitive environment is creating a content bidding war, which is squeezing Netflix’s margins. But wait, say the Netflix bulls. I should focus my attention on the company’s expanding domestic streaming margins. This is true, if you carelessly ignore the accounting gimmicks that Netflix CFO David Wells freely acknowledges. On the recent investor call, here is Wells’s description of the company’s expense diversion trickery by geography:
“So by growing faster internationally, and putting that [content expense] allocation more towards international, it’s going to provide some relief to those global originals, and the global projects that we do have, that are allocated to the U.S.”
In other words, Wells admits shoving a lot of domestic content costs into the international segment to make domestic profit margins look better (higher). Longer term, perhaps this allocation could make some sense, but for now I’m not convinced viewers in Luxembourg are watching Orange is the New Black and House of Cards like they are in the U.S.
Technology: Amazon Doing the Heavy Lifting
If check writing and accounting diversions aren’t a competitive advantage, does Netflix have a technology advantage? That’s tough to believe when Netflix effectively outsources all their distribution technology to Amazon.com Inc (AMZN).
Here’s how Netflix describes their technology relationship with Amazon:
“We run the vast majority of our computing on [Amazon Web Services] AWS. Given this, along with the fact that we cannot easily switch our AWS operations to another cloud provider, any disruption of or interference with our use of AWS would impact our operations and our business would be adversely impacted. While the retail side of Amazon competes with us, we do not believe that Amazon will use the AWS operation in such a manner as to gain competitive advantage against our service.”
Call me naïve, but something tells me Amazon could be stealing some secret pointers and best practices from Netflix’s operations and applying them to their Amazon Prime Instant Video offering. Nah, probably not. Like Netflix said, Amazon wouldn’t steal anything to gain a competitive advantage…never.
Regardless, the real question surrounding Netflix should focus on whether a $35 billion valuation should be awarded to a money losing content portal that distributes content through Amazon? For comparison purposes, Netflix is currently valued at 20% more than Viacom Inc (VIA), the owner of valuable franchises and brands like Paramount Pictures, Nickelodeon, MTV, Comedy Central, BET, VH1, Spike, and more. Viacom, which was spun off from CBS 44 years ago, actually generated about $2.5 billion in cash last year and paid out about a half billion dollars in dividends. Quite a stark contrast compared to a company accelerating its cash losses.
I openly admit Netflix is a wonderful service, and I have been a loyal, longtime subscriber myself. But a good service does not necessarily equate to a good stock. And despite being short the stock, Sidoxia is actually long the company’s bonds. It’s certainly possible (and likely) Netflix’s stock will underperform from today’s nosebleed valuation, but under almost any scenario I can imagine, I have a difficult time foreseeing an outcome in which Netflix would go bankrupt by 2021. Bond investors currently agree, which explains why my Netflix bonds are trading at a 5% premium to par.
Netflix stockholders, and crazy disciples like Mark Cuban, on the other hand, may have more to worry about in the coming quarters. CEO Reed Hastings is sticking to his “burn it and they will come” strategy at all costs, but if profits and cash don’t begin to pile up quickly, then Netflix’s “Field of Dreams” will turn into a “Field of Nightmares.”
Wade W. Slome, CFA, CFP®
Plan. Invest. Prosper.
DISCLOSURE: Sidoxia Capital Management (SCM) and some of its clients hold positions in certain exchange traded funds (ETFs), AAPL, GOOGL, AMZN, long Netflix bond position, long Dish Corp bond, and a short position in NFLX, but at the time of publishing, SCM had no direct position in VIA, TWX, SNE, or any other security referenced in this article. No information accessed through the Investing Caffeine (IC) website constitutes investment, financial, legal, tax or other advice nor is to be relied on in making an investment or other decision. Please read disclosure language on IC Contact page.
Fink & Capitalism: Need 4 Kitchens in Your House?

Do you need four kitchens in your house? Apparently financial industry titan Larry Fink does. If Mr. Fink were a designer for millionaire homeowners, he would advise them to use their millions to build more kitchens in their house (reinvest) rather than distribute those monies to family members (dividends) or use that money to pay back an equity loan from mom and dad for the down payment (share buybacks). Essentially that is exactly what is happening in the stock market. Companies that are generating record profits and margins (millionaires) are increasingly choosing to pay out larger percentages of profits to stockholders (family members) in the form of rising dividends and share buybacks. Contrary to Mr. Fink’s belief, corporate America is actually doing plenty with room additions, landscaping, and roof replacements – I will describe more later.
As a consequence of corporate America’s increasingly shareholder friendly practices of returning cash, Fink believes this trend will stifle innovation and long-term growth in American companies. Here’s a snapshot of the supposed dividend/buyback problem Mr. Fink describes:

Source: Financial Times
Fink Mails Letter from Soapbox
For those of you who do not know who Larry Fink is, he is the successful Chairman and CEO of BlackRock Inc. (BLK), an investment manager which oversees about $4.65 trillion in investment assets. Mr. Fink ignited this recent financial controversy when he jumped on his soapbox by mailing letters to 500 CEOs lecturing them on the importance of long-term investing. What is Mr. Fink’s beef? Fink’s issues revolve around his belief that CEOs and corporations are too short-term oriented.
In his letter, Mr. Fink had this to say:
“This pressure [to meet short-term financial goals] originates from a number of sources—the proliferation of activist shareholders seeking immediate returns, the ever-increasing velocity of capital, a media landscape defined by the 24/7 news cycle and a shrinking attention span, and public policy that fails to encourage truly long-term investment.”
He goes on to bolster his argument with the following:
“More and more corporate leaders have responded with actions that can deliver immediate returns to shareholders, such as buybacks or dividend increases, while underinvesting in innovation, skilled workforces or essential capital expenditures necessary to sustain long-term growth.”
What Mr. Fink does not say in his letter is that large, multinational S&P 500 corporations driving this six-year bull run are sitting on a record hoard of cash, exceeding $1.4 trillion (see chart below). In this light, it should come as no surprise that CEOs are forking over more cash to investors in the forms of dividends and share repurchases.
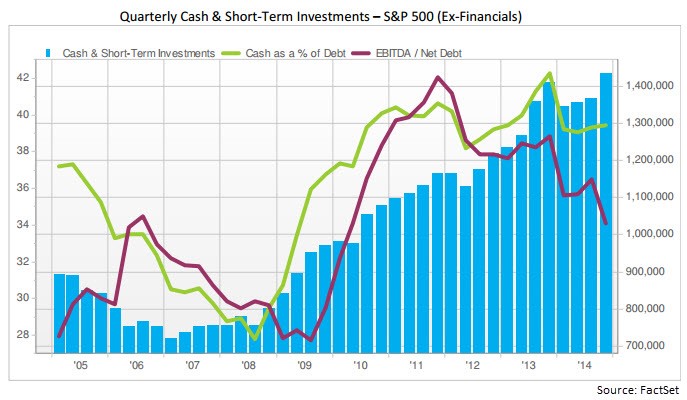
What’s more, despite Fink’s assertion that share buybacks and dividends are killing innovation, he also fails to mention in his letter that 2014 capital expenditures of $730 billion are also at a record level. That’s right, CAPEX has not been cut to the bone as he implies, but rather risen to all-time highs.
It’s true that generationally low (and declining) interest rates have accelerated the pace of dividends/repurchases, however dividend payout ratios (the percentage of profits distributed to shareholders) of about 32% remain firmly below the long-term payout ratio of approximately 54% (see chart below) – see also Dividend Floodgates Widen. I find it difficult to fault many companies doing something with the gargantuan piles of inflation-losing cash anchoring their balance sheets. Don’t cash-rich companies have a fiduciary duty to borrow reasonable amounts of near-0% debt today (see Bunny Rabbit Market) in exchange for share buybacks currently providing returns of about 5.5% (inverse of 18x P/E ratio) and likely yielding 7%+ returns five years from now?

Source: Financial Times
The “Short-Term” Poster Child – Apple
There is no arguing that excessive debt eventually can catch up to a company. Our multi-year expanding economy is eventually due for another recession in the coming years, and there will be hell to pay for irresponsible, overleveraged companies. With that said, let’s take a look at the poster child of “short-termism” according to Mr. Fink …Apple Inc. (AAPL).
Of the roughly $500 billion in buybacks spent by S&P 500 companies in 2014, Apple accounted for approximately $45 billion of that figure. On top of that, CEO Tim Cook and his board generously decided to return another $11 billion to shareholders in the form of dividends. Has this “short-term” return of capital stifled innovation from the company that has launched iPhone version 6, iPad, Apple Watch, Apple Pay, and is investing into exciting areas like Apple Television, Apple Car, and who knows what else?
To put these Apple numbers into perspective, consider that last year Apple spent over $6 billion on research and development (R&D); $10 billion on capital expenditures; and hired over 12,000 new full-time employees. This doesn’t exactly sound like the death of innovation to me. Even after doling out roughly -$28 billion in expenditures and -$56 billion in dividends/share repurchases, Apple was amazingly able to keep their net cash position flat at an eye-popping +$141 billion!
Mr. Fink abhors “activist shareholders seeking immediate returns” but rather than deriding them perhaps he should send the greedy, capitalist Carl Icahn a personal thank you letter. Since Icahn’s vocal plea for a large Apple share buyback, the shares have skyrocketed about +85%, catapulting BlackRock’s ownership value in Apple to over $19 billion.
With respect to these increasing outlays, Mr. Fink also notes:
“Returning excessive amounts of capital to investors—who will enjoy comparatively meager benefits from it in this environment—sends a discouraging message.”
This would be true if investors took the dividends and stuffed them under their mattress, but an important message Mr. Fink neglects to address as it relates to dividends and share buybacks is demographics. There are 76 million Baby Boomers born between 1946 – 1964 and a Boomer is turning age 65 every 8 seconds. With many bonds trading at near 0% yields (even negative yields) it is no wonder many income starving retirees are demanding many of these cash-rich corporations to share more of the growing spoils via rising dividends.
Capitalism Works
After looking at a few centuries of our country’s history, one of the main lessons we can learn is that capitalism works – especially over the long-run. With about 200 countries across the globe, there is a reason the U.S. is #1…we’re good at capitalism. As our economy has matured over the decades, it is true our priorities and challenges have changed. It is also true that other countries may be narrowing the gap with the U.S., due to certain advantages (e.g., demographics, lower entitlements, easier regulations, etc), but the U.S. will continue to evolve.
In many respects, capitalism is very much like Darwinism – corporations either adapt with the competition…or they die. I repeatedly hear from pessimists that the U.S. is in a secular state of decline, but if that’s the case, how come the U.S. continues to dominate and innovate in major industries like biotechnology, mobile technology, networking, internet, aviation, energy, media, and transportation? Quite simply, we are the best and most experienced practitioners of capitalism.
Certainly, capitalism will continue to cultivate cyclical periods of excess investment/leverage and insufficient regulation. But guess what? Investors, including the public, eventually lose their shirts and behaviors/regulations adjust. At least for a little while, until the next period of excess takes hold. If Apple, and other balance sheet healthy companies allocate capital irresponsibly, capital will flow towards more aggressive and innovative companies. BlackBerry Limited (BBRY) knows a little bit about the consequences of cutthroat competition and suboptimal capital allocation.
While I emphatically share Mr. Fink’s focus on long-term investing values (including his self-serving tax reform ideas), I vigorously disagree with his attacks on shareholder friendly actions and his characterization of rising dividends/buybacks as short-term in nature. In fact, increasing dividends and share buybacks can very much coexist as a long-term investment and capital allocation strategy.
The question of proper capital allocation should have more to do with the age of a company. It only makes sense that younger companies on average should reinvest more of their profits into growth and innovation. On the other hand, more mature S&P 500-like companies will be in a better position to distribute higher percentages of profits to shareholders – especially as cash levels continue to rise to record levels and leverage remains in check.
BlackRock’s Larry Fink may continue to urge CEOs to reinvest their growing cash hoards into superfluous corporate kitchens, but Sidoxia and other prudent capitalist investors will continue to exhort CEOs to opportunistically take advantage of near-free borrowing rates and responsibly share the accretive gains with shareholders. That’s a message Mr. Fink should include in a letter to CEOs – he can use BlackRock’s lofty, above-average dividend to cover the cost of postage.
Wade W. Slome, CFA, CFP®
Plan. Invest. Prosper.
DISCLOSURE: Sidoxia Capital Management (SCM) and some of its clients hold positions in certain exchange traded funds (ETFs) including AAPL and iShares ETFs, but at the time of publishing, SCM had no direct position in BLK, BBRY or any other security referenced in this article. No information accessed through the Investing Caffeine (IC) website constitutes investment, financial, legal, tax or other advice nor is to be relied on in making an investment or other decision. Please read disclosure language on IC Contact page.
The Bunny Rabbit Market

This article is an excerpt from a previously released Sidoxia Capital Management complementary newsletter (April 1, 2015). Subscribe on the right side of the page for the complete text.
With spring now upon us, we can see the impact the Easter Bunny has had on financial markets…a lot of bouncing around. More specifically, stocks spent about 50% of the first quarter in negative territory, and 50% in positive territory. With interest rates gyrating around the 2% level for the benchmark 10-Year Treasury Note for most of 2015, the picture looked much the same. When all was said and done, after the first three months of the year, stocks as measured by the S&P 500 finished +0.4% and bonds closed up a similarly modest amount of +1.2%, as measured by the Total Bond Market ETF (BND).
Why all the volatility? The reasons are numerous, but guesswork of when the Federal Reserve will reverse course on its monetary policy and begin raising interest rates has been (and remains) a dark cloud over investment strategies for many short-term traders and speculators. In order to provide some historical perspective, the last time the Federal Reserve increased interest rates (Federal Funds rate) was almost nine years ago in June 2006. It’s important to remember, as this bull market enters its 7th consecutive year of its advance, there has been no shortage of useless, negative news headlines to keep investors guessing (see also a Series of Unfortunate Events). Over this period, ranging concerns have covered everything from “Flash Crashes” to “Arab Springs,” and “Ukraine” to “Ebola”.
Last month, the headline pessimism persisted. In the Middle East we witnessed a contentious re-election of Israeli Prime Minister Benjamin Netanyahu; Saudi Arabia led airstrikes against Iranian-backed, Shi’ite Muslim rebels (Houthis) in Yemen; controversial Iranian nuclear deal talks; and President Barack Obama directed airstrikes against ISIS fighters in the Iraqi city of Tikrit, while he simultaneously announced the slowing pace of troop withdrawals from Afghanistan.
Meanwhile in the global financial markets, investors and corporations continue to assess capital allocation decisions in light of generationally low interest rates, and a U.S. dollar that has appreciated in value by approximately +25% over the last year. In this low global growth and ultra-low interest rate environment (-0.12% on long-term Swiss bonds and 1.93% for U.S. bonds), what are corporations choosing to do with their trillions of dollars in cash? A picture is worth a thousand words, and in the case of companies in the S&P 500 club, share buybacks and dividends have been worth more than $900,000,000,000.00 over the last 12 months (see chart below).

Source: Financial Times
Case in point, Apple Inc (AAPL) has been the poster child for how companies are opportunistically boosting stock prices and profitability metrics (EPS – Earnings Per Share) by borrowing cheaply and returning cash to shareholders via stock buybacks and dividend payments. More specifically, even though Apple has been flooded with cash (about $178 billion currently in the bank), Apple decided to accept $1.35 billion in additional money from bond investors by issuing bonds in Switzerland. The cost to Apple was almost free – the majority of the money will be paid back at a mere rate of 0.28% until November 2024. What is Apple doing with all this extra cash? You guessed it…buying back $45 billion in stock and paying $11 billion in dividends, annually. No wonder the stock has sprung +62% over the last year. Apple may be a unique company, but corporate America is following their shareholder friendly buyback/dividend practices as evidenced by the chart below. By the way, don’t be surprised to hear about an increased dividend and share buyback plan from Apple this month.

Source: Investors Business Daily
Despite all the turmoil and negative headlines last month, the technology-heavy NASDAQ Composite index managed to temporarily cross the psychologically, all-important 5,000 threshold for the first time since the infamous tech-bubble burst in the year 2000, more than 15 years ago. The Dow Jones Industrial also cracked a numerically round threshold (18,000) last month, before settling down at 17,779 at month’s end.
While the S&P 500 and NASDAQ indexes have posted their impressive 9th consecutive quarter of gains, I don’t place a lot of faith in dubious, calendar-driven historical trends. With that said, as I eat jelly beans and hunt for Easter eggs this weekend, I will take some solace in knowing April has historically been the most positive month of the year as it relates to direction of stock prices (see chart below). Over the last 20 years, stocks have almost averaged a gain of +3% over this 30-day period. Perhaps investors are just in a better mood after paying their taxes?
Source: Bespoke
Even though April has historically been an outperforming month, banker and economist Robert Rubin stated it best, “Nothing is certain – except uncertainty.” We’ve had a bouncing “Bunny Market” so far in 2015, and chances are this pattern will persist. Rather than fret whether the Fed will raise interest rates 0.25% or agonize over a potential Greek exit (“Grexit”) from the EU, you would be better served by constructing an investment and savings plan to meet your long-term financial goals. That’s an eggstra-special idea that even the Easter Bunny would want to place in the basket.
Wade W. Slome, CFA, CFP®
Plan. Invest. Prosper.
DISCLOSURE: Sidoxia Capital Management (SCM) and some of its clients hold positions in certain exchange traded funds (ETFs) including BND and AAPL (stock), but at the time of publishing, SCM had no direct position in any other security referenced in this article. No information accessed through the Investing Caffeine (IC) website constitutes investment, financial, legal, tax or other advice nor is to be relied on in making an investment or other decision. Please read disclosure language on IC Contact page.
Chicken or Beef? Time for a Stock Diet?

The stock market has been gorging on gains over the last six years and the big question is are we ready for a crash diet? In other words, have we consumed too much, too fast? Since the lows of 2009 the S&P 500 index has more than tripled (or +209% without dividends).
In our daily food diets our proteins of choice are primarily chicken and beef. When it comes to finances, our investment choices are primarily stocks and bonds. There are many factors that can play into a meat-eaters purchase decision, including the all-important factor of price. When the price of beef spikes, guess what? Consumers rationally vote with their wallets and start substituting beef for relatively lower priced chicken options.
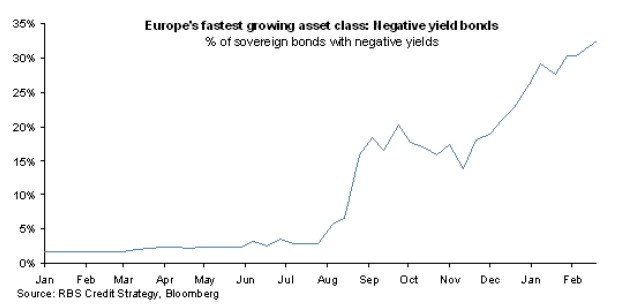
The same principle applies to stocks and bonds. And right now, the price of bonds in general have gone through the roof. In fact bond prices are so high, in Europe we are seeing more than $2 trillion in negative yielding sovereign bonds getting sucked up by investors.
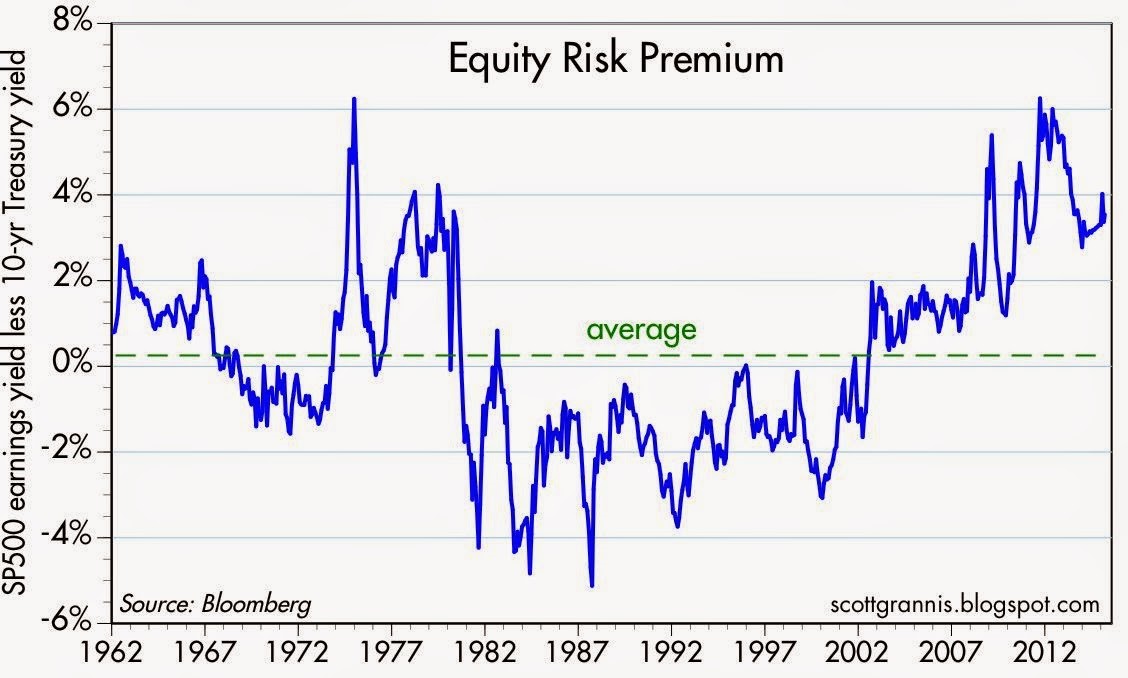
Another area where we see evidence of pricey bonds can be found in the value of current equity risk premiums. Scott Grannis of Calafia Beach Pundit posted a great 50-year history of this metric (chart below), which shows the premium paid to stockholders over bondholders is near the highest levels last seen during the Great Recession and the early 1980s. To clarify, the equity risk premium is defined as the roughly 5.5% yield currently earned on stocks (i.e., inverse of the approx. 18x P/E ratio) minus the 2.0% yield earned on 10-Year Treasury Notes.
Source: Scott Grannis
The equity risk premium even looks more favorable if you consider the negative interest rate European environment mentioned earlier. The 60 billion euros of monthly debt in ECB (European Central Bank) quantitative easing purchases has accelerated the percentage of negative yield bond issuance, as you can see from the chart below.
Source: FT Alphaville
Hibernating Bond Vigilantes
Dr. Ed Yardeni coined the famous phrase “bond vigilantes” to describe the group of hedge funds and institutional investors who act as the bond market sheriffs, ready to discipline any over leveraged debt-issuing entity by deliberately cratering prices via bond sales. For now, the bond vigilantes have in large part been hibernating. As long as the vigilantes remain asleep at the switch, stock investors will likely continue earning these outsized premiums.
How long will these fat equity premiums and gains stick around? A simple diet of sharp interest rate increases or P/E expansion would do the trick. An increase in the P/E ratio could come in one of two ways: 1) sustained stock price appreciation at a rate faster than earnings growth; or 2) a sharp earnings decline caused by a recessionary environment. On the bright side for the bulls, there are no imminent signs of interest rate spikes or recessions. If anything, dovish commentary coming from Fed Chairwoman Janet Yellen and the FOMC would indicate the economy remains in solid recovery mode. What’s more, a return to normalized monetary policy will likely involve a very gradual increase in interest rates – not a piercing rise as feared by many.
Regardless of whether it’s beef prices or bond prices spiking, rather than going on a crash diet, prudently allocating your money to the best relative value will serve your portfolio and stomach best over the long run.
Wade W. Slome, CFA, CFP®
Plan. Invest. Prosper.
DISCLOSURE: Sidoxia Capital Management (SCM) and some of its clients hold positions in certain exchange traded funds (ETFs), but at the time of publishing, SCM had no direct position in any other security referenced in this article. No information accessed through the Investing Caffeine (IC) website constitutes investment, financial, legal, tax or other advice nor is to be relied on in making an investment or other decision. Please read disclosure language on IC Contact page.
March Madness – Dividend Grandness & Volatility Blandness

March Madness has arrived once again. This NCAA basketball event, which has been around since 1939, begins with a selection committee choosing the top 68 teams in the country. These teams are matched up against each other through a single-elimination tournament until a national champion is throned. The stock market does not have a selection committee that picks teams from conferences like the SEC, Big East, Pac-12, and ACC, but rather millions of investors select the best investments from asset classes like stocks, bonds, real estate, commodities, venture capital, and private equity.
In the investment world, there are no win-loss records, but rather there are risk-return profiles. Investors generally migrate towards the asset classes where they find the optimal trade-off between risk and return. Speculators, day-traders, and momentum traders may define risk differently, but regardless, over the long-run, capital goes where it is treated best. And over the last six years, the U.S. stock market hasn’t been a bad place to be (the S&P 500 has about tripled).
Why such outperformance in stocks? Besides a dynamic earnings recovery from the 2008-2009 financial crisis, another major factor has been the near-0% interest rate environment. When investors are earning near nothing in their bank and savings accounts, it is perfectly rational for savers to look for riskier options, if they are compensated for that risk. In addition to loose central bank and quantitative easing policies fueling demand for stocks, rising dividends have increased the attractiveness of the stock market. In fact, as you can see from the chart below, dividends have about doubled from 2008-2009 and about tripled from the year 2000.
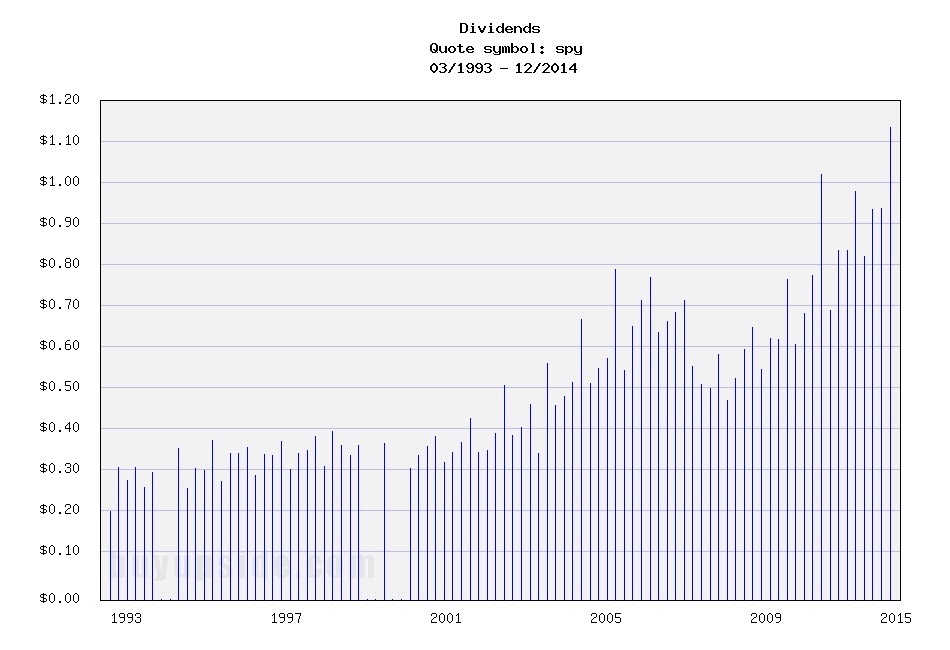
Source: Buy Upside
Stock prices have moved higher in concert with rising dividends, which, as you can see from the chart below, has kept the dividend yield flat at around 2% over the last few years. Treasury bond yields, on the other hand, have been on steady declining trend for the last 35 years. So, while coupons on newly issued bonds have been declining for virtually the last three and a half decades, stock dividends have been on a steadily upward moving rampage, excluding recessions (up +13% in the most recent reported period).
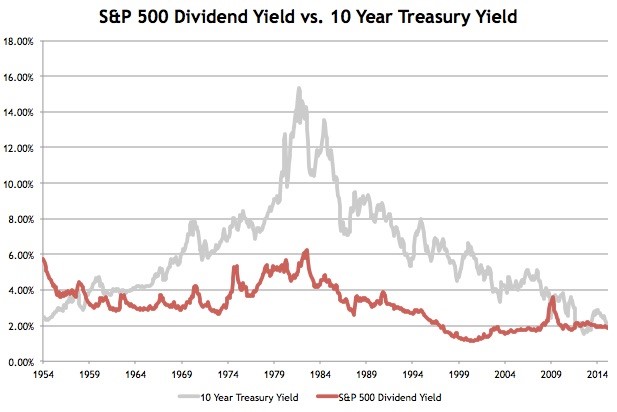
Source: Avondale Asset Management
Declining interest rates have made stocks look attractive relative to investment grade corporate bonds too as evidenced by the chart below. As you can see, over the last half-century, corporate bond yields have predominantly offered higher income yields than the earnings yield on stocks – that is not the case today.
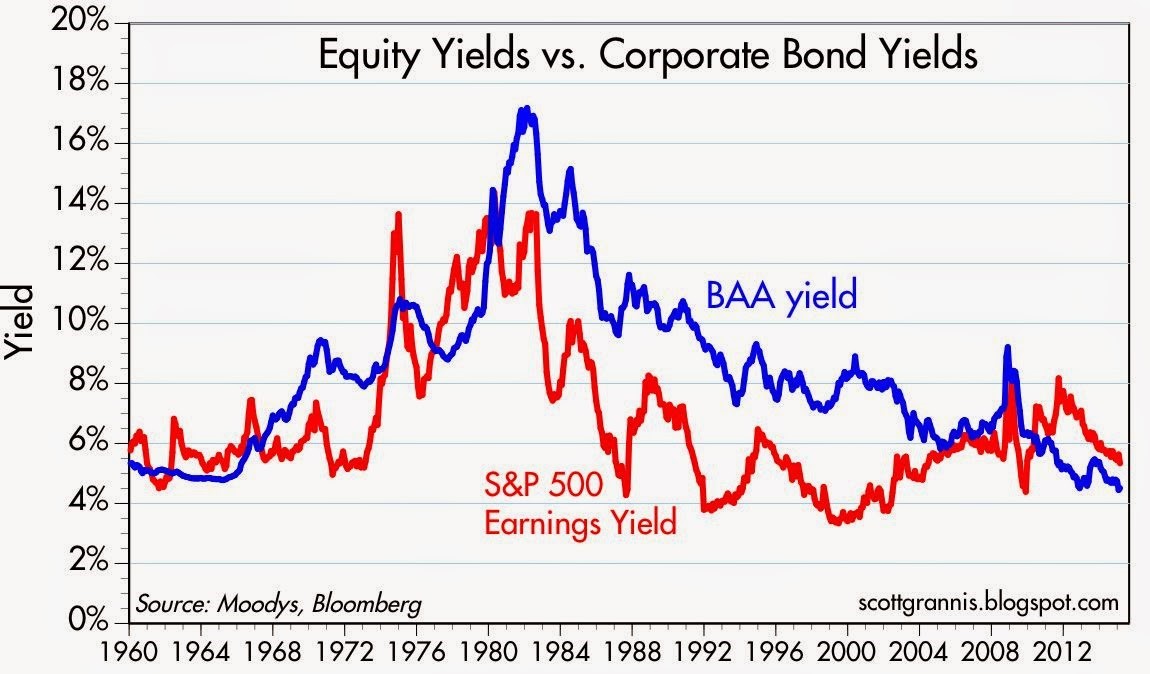
Source: Calafia Beach Pundit
What does all this stock dividend, earnings yield stuff mean? In the grand scheme of things, income starving Baby Boomers and retirees are slowly realizing that stocks in general stack up favorably in an environment in which interest payments are going down and dividend payments are going up. One of the areas highlighting the underlying demand for stocks is the Volatility Index (VIX) – a.k.a., the “Fear Gauge.” Despite Greece, Russia, ISIS, the Fed, and the Dollar dominating the headlines, the hunger for yield and growth in a declining interest rate environment is cushioning the blow during these heightened periods of volatility (see also A Series of Unfortunate Events).
Since the end of 2011, the monthly close of the VIX has stayed above its historical average of approximately 20 only two times (see chart below). In other words, over that timeframe, the VIX has remained below average about 95% of the time. When the VIX has spiked above 20, generally it has only been for brief periods, until cooler heads prevail and bargain hunters come in to buy depressed stock bargains.
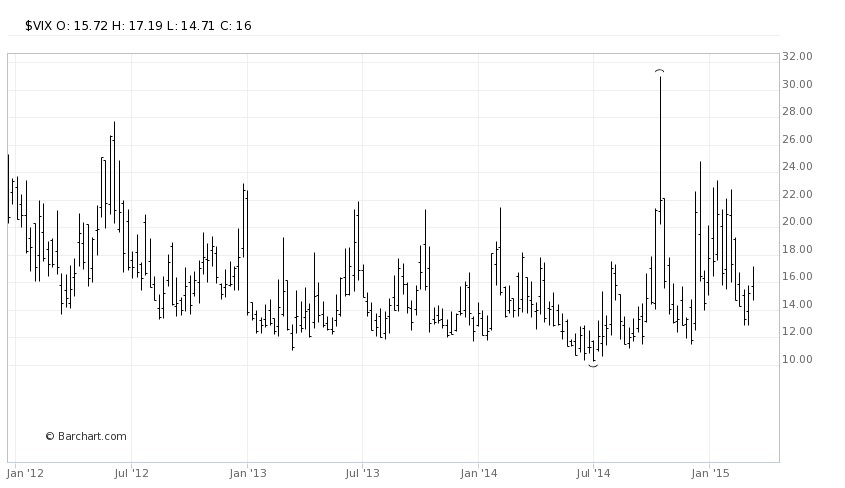
Source: Barchart
I’m not naïve enough to believe the bull market in stocks will last forever, but as long as interest rates don’t spike up and/or corporate earnings crater, underlying demand for yield should provide a floor for stocks during heightened periods of volatility. We may be in the midst of March Madness but volatility blandness is showing us that investors are paying attention to dividend grandness.
Wade W. Slome, CFA, CFP®
Plan. Invest. Prosper.
DISCLOSURE: Sidoxia Capital Management (SCM) and some of its clients hold positions in certain exchange traded funds (ETFs) and SPY, but at the time of publishing, SCM had no direct position in any other security referenced in this article. No information accessed through the Investing Caffeine (IC) website constitutes investment, financial, legal, tax or other advice nor is to be relied on in making an investment or other decision. Please read disclosure language on IC Contact page.
NASDAQ Redux

The NASDAQ Composite index once again crossed the psychologically, all-important 5,000 threshold this week for the first time since the infamous tech-bubble burst in the year 2000. Of course, naturally, the media jumped on a non-stop, multi-day offensive comparing and contrasting today’s NASDAQ vs. the NASDAQ twin of yesteryear. Rather than rehash the discussion once again, I have decided to post three articles I published in recent years on the topic covering the outperformance of the spotlighted, tech-heavy index.
NASDAQ 5,000 Irrational Exuberance Déjà Vu?

Investors love round numbers and with the Dow Jones Industrial index recently piercing 17,000 and the S&P 500 index having broken 2,000 , even novice investors have something to talk about around the office water cooler. While new all-time records are being set for the major indices during September, the unsung, tech-laden NASDAQ index has yet to surpass its all-time high of 5,132 achieved 14 and ½ years ago during March of 2000.
Click Here to Read the Rest of the Article
NASDAQ and the R&D Tech Revolution

It’s been a bumpy start for stocks so far in 2014, but the fact of the matter is the NASDAQ Composite Index is up this year and hit a 14-year high in the latest trading session (highest level since 2000). The same cannot be said for the Dow Jones Industrial and S&P 500 indices, which are both lagging and down for the year. Not only did the NASDAQ outperform the Dow by almost +12% in 2013, but the NASDAQ has also trounced the Dow by over +70% over the last five years.
Click Here to Read the Rest of the Article
NASDAQ: The Ugly Stepchild

All the recent media focus has been fixated on whether the Dow Jones Industrial Average index (“The Dow”) will close above the 13,000 level. In the whole scheme of things, this specific value doesn’t mean a whole lot, but it does make for a great topic of conversation at a cocktail party. Today, the Dow is trading at 12,983, a level not achieved in more than three and a half years. Not a bad accomplishment, given the historic financial crisis on our shores and the debacle going on overseas, but I’m still not so convinced a miniscule +0.1% move in the Dow means much. While the Dow and the S&P 500 indexes garner the hearts and minds of journalists and TV reporters, the ugly stepchild index, the NASDAQ, gets about as much respect as Rodney Dangerfield (see also No Respect in the Investment World).
Click Here to Read the Rest of the Article
Wade W. Slome, CFA, CFP®
Plan. Invest. Prosper.
DISCLOSURE: Sidoxia Capital Management (SCM) and some of its clients hold positions in certain exchange traded funds (ETFs) , but at the time of publishing, SCM had no direct position in any other security referenced in this article. No information accessed through the Investing Caffeine (IC) website constitutes investment, financial, legal, tax or other advice nor is to be relied on in making an investment or other decision. Please read disclosure language on IC Contact page.
Here Comes the Great Rotation…Finally?

For decades interest rates have continually gravitated to zero like flies attracted to stink. For a split second in 2013, as long-term U.S. Treasury rates about doubled from 1.5% to 3.0% before reversing, it appeared the declining rate cycle could finally be broken. At the time, pundits of all types were calling for the “great rotation” out of bonds into stocks. Half of this forecast came to fruition as stocks grinded to record highs in 2014, but even I the big stock bull admittedly did not expect interest rates on 10-year Switzerland bonds to turn negative (see also Draghi QE Beer Goggles), especially after U.S. quantitative easing (QE) came to an end.
With rates already at a generational low, how could anyone be expected to accept a measly 0.3% annual return for a whole decade? Well, that’s exactly what’s happening in massive developed markets like Germany and Japan. While investors and retirees are painted into a corner by being forced to accept near-0% interest payments, savvy corporate borrowers are taking advantage of this once in a lifetime opportunity. Take for example the recently unprecedented $1.35 billion Switzerland bond issuance by Apple Inc. (AAPL), which included a tranche of bonds maturing in 2024 that yielded a paltry 0.25%.
With bonds offering lower and lower yield possibilities for investors of all stripes, at Sidoxia we are still finding plenty of opportunities in stocks, especially in high dividend-paying equity investments. In the U.S., the average S&P 500 stock is yielding approximately the same as the 10-Year Treasury Note (2.0%), but in other parts of the world, equity markets such as the following are offering significantly higher yields:
- iShares MSCI Australia (Yield 5.0% – EWA)
- Europe FTSE Europe (Yield: 4.6% – VGK)
- Market Vectors Russia (Yield 4.6% – RSX)
- iShares MSCI Brazil (Yield 4.0% – EWZ)
- iShares MSCI Sweden (Yield 3.8% – EWD)
- iShares MSCI Malaysia (Yield 3.8% – EWM)
- iShares MSCI Singapore (Yield 3.4% – EWS)
- iShares China (Yield 2.5% – FXI)
A New “Great Rotation” in 2015?
If you look at the 2014 ICI (Investment Company Institute) fund flow data, it becomes clear the great rotation out of bonds into U.S. stocks has not occurred. More specifically, despite the S&P 500 index reaching new record highs, -$60 billion flowed out of U.S. stock funds last year, and about +$44 billion flowed into all bond funds. Could the “great rotation” out of bonds into stocks finally happen in 2015? Certainly, this scenario is a possibility, but given the barren bond yield environment, perhaps the new “great rotation” in 2015 will be out of domestic equities into higher yielding international equity markets. In addition to the higher international market yields listed above, many of these foreign markets are priced more attractively (i.e., lower Price-Earnings (P/E) ratios) as you can see from the chart below created by strategist Dr. Ed Yardeni.
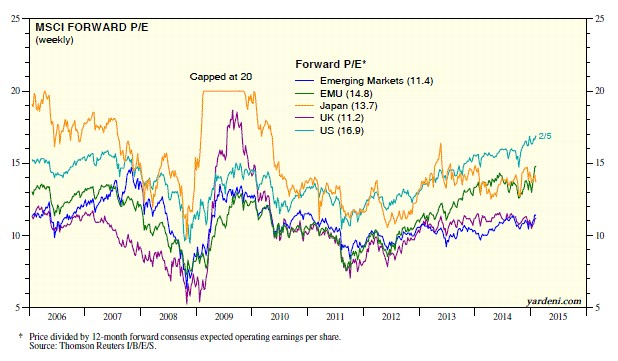
Source: Ed Yardeni – Dr. Ed’s Blog
Obviously, any asset shifting scenario is not mutually exclusive, and there could be a combination of investor reallocations made in 2015. It’s possible that previously unloved emerging markets and international developed markets could receive new investor capital from several areas.
With defensive sectors like utilities (up +25%) and healthcare (up +24%) leading the U.S. sector higher last year, it’s evident to me that “skepticism” remains the operative word in investors’ minds and there is no clear evidence of widespread euphoria hitting the U.S. stock market. Valuations as measured by trailing P/E ratios have objectively moved above historical averages, however this has occurred within the context of all-time record low interest rates and inflation. If you take into account the near-0% interest rate environment into your calculus, current stock prices (P/E ratios) are well within historical norms (see also The Rule of 20 Can Make You Plenty), which still leaves room for expansion.
If some of the half-glass full economic waters spill into the half-glass empty emerging markets/international markets, conceivably the eagerly anticipated “great rotation” out of bonds into U.S. stocks may also flow into even more attractively valued foreign equity opportunities.
Wade W. Slome, CFA, CFP®
Plan. Invest. Prosper.
DISCLOSURE: Sidoxia Capital Management (SCM) and some of its clients hold positions in AAPL and certain exchange traded funds (ETFs) including VGK, EWZ, FXI, but at the time of publishing SCM had no direct position in EWA, RSX, EWD, EWM, EWS, and any other security referenced in this article. No information accessed through the Investing Caffeine (IC) website constitutes investment, financial, legal, tax or other advice nor is to be relied on in making an investment or other decision. Please read disclosure language on IC Contact page.
Is Good News, Bad News?

The tug-of-war is officially on as investors try to decipher whether good news is good or bad for the stock market? On the surface, the monthly January jobs report released by the Bureau of Labor Statistics (BLS) appeared to be welcomed, positive data. Total jobs added for the month tallied +257,000 (above the Bloomberg consensus of +230,000) and the unemployment rate registered 5.7% thanks to the labor participation rate swelling during the month (see chart below). More specifically, the number of people looking for a job exceeded one million, which is the largest pool of job seekers since 2000.
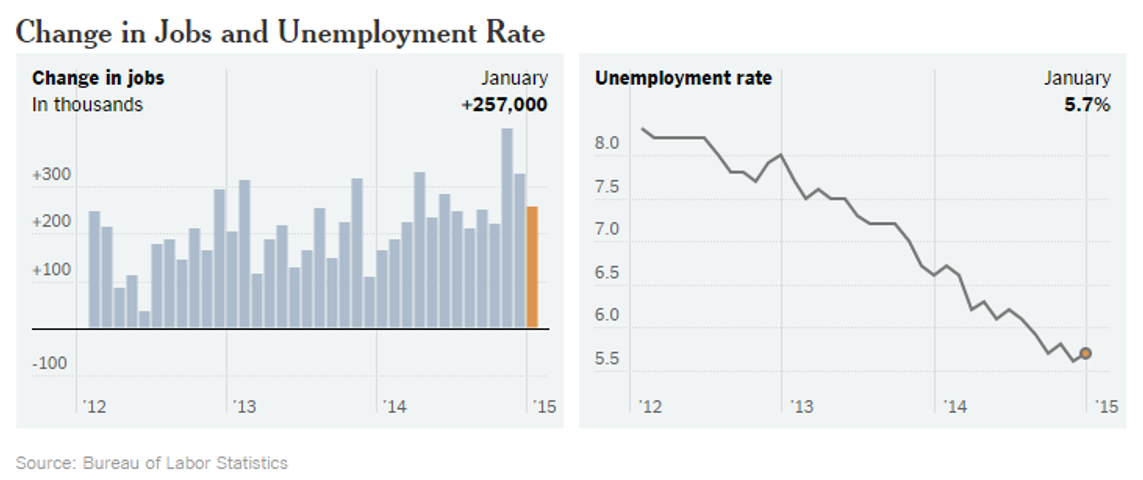
Source: BLS via New York Times
Initially the reception by stocks to the jobs numbers was perceived positively as the Dow Jones Industrial index climbed more than 70 points on Friday. Upon further digestion, investors began to fear an overheated employment market could lead to an earlier than anticipated interest rate hike by the Federal Reserve, which explains the sell-off in bonds. The yield on the 10-Year Treasury proceeded to spike by +0.13% before settling around 1.94% – that yield compares to a recent low of 1.65% reached last week. The initial euphoric stock leap eventually changed direction with the Dow producing a -180 point downward reversal, before the Dow ended the day down -62 points for the session.
Crude Confidence?
The same confusion circling the good jobs numbers has also been circulating around lower oil prices, which on the surface should be extremely positive for the economy, considering consumer spending accounts for roughly 70% of our country’s economic output. Lower gasoline prices and heating bills means more discretionary spending in the pockets of consumers, which should translate into more economic activity. Furthermore, it comes as no surprise to me that oil is both figuratively and literally the lubricant for moving goods around our country and abroad, as evidenced by the Dow Jones Transportation index that has handily outperformed the S&P 500 index over the last 18 months. While this may truly be the case, many journalists, strategists, economists, and analysts are nevertheless talking about the harmful deflationary impacts of declining oil prices. Rather than being viewed as a stimulative lubricant to the economy, many of these so-called pundits point to low oil prices as a sign of weak global activity and an omen of worse things to come.
This begs the question, as I previously explored a few years ago (see Good News=Good News?), is it possible that good news can actually be good news? Is it possible that lower energy costs for oil importing countries could really be stimulative for the global economy, especially in regions like Europe and Japan, which have been in a decade-long funk? Is it possible that healthier economies benefiting from substantial job creation can cause a stingy, nervous, and scarred corporate boardrooms to finally open up their wallets to invest more significantly?
Interest Rate Doom May Be Boom?
Quite frankly, all the incessant, never-ending discussions about an impending financial market Armageddon due to a potential single 0.25% basis point rate hike seem a little hyperbolic. Could I be naively whistling past the graveyard? From my perspective, although it is a foregone conclusion the Fed will have to increase interest rates above 0%, this is nothing new (I’m really putting my neck out there on this projection). Could this cause some volatility when it finally happens…of course. Just look at what happened to financial markets when former Federal Reserve Chairman Ben Bernanke merely threatened investors with a wind-down of quantitative easing (QE) in 2013 and investors had a taper tantrum. Sure, stocks got hit by about -5% at the time, but now the S&P 500 index has catapulted higher by more than +25%.
Looking at how stocks react in previous rate hike cycles is another constructive exercise. The aggressive +2.50% in rate hikes by former Fed Chair Alan Greenspan in 1995 may prove to be a good proxy (see also 1994 Bond Repeat?). After suffering about a -10% correction early in 1994, stocks rallied in the back-half to end the year at roughly flat.
And before we officially declare the end of the world over a single 0.25% hike, let’s not forget that the last rate hike cycle (2004 – 2006) took two and a half years and 17 increases in the targeted Federal Funds rate (1.00% to 5.25%). Before the rate increases finally broke the stock market’s back, the bull market moved about another +40% higher…not too shabby.
Lastly, before writing the obituary of this bull market, it’s worth noting the yield curve has been an incredible leading indicator and currently this gauge is showing zero warnings of any dark clouds approaching on the horizon (see chart below). As a matter of fact, over the last 50 years or so, the yield curve has turned negative (or near 0%) before every recession.
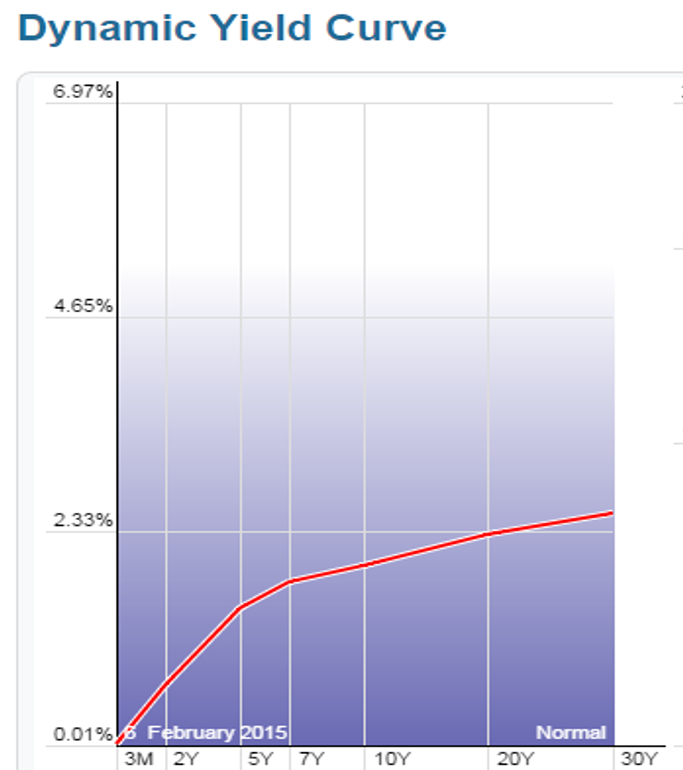
Source: StockCharts.com
As the chart above shows, the yield curve remains very sloped despite modest flattening in recent quarters.
While many skeptics are having difficulty accepting the jobs data and declining oil prices as good news because of rate hike fears, history shows us this position could be very misguided. Perhaps, once again, this time around good news may actually be good news.
Wade W. Slome, CFA, CFP®
Plan. Invest. Prosper.
DISCLOSURE: Sidoxia Capital Management (SCM) and some of its clients hold positions in certain exchange traded funds (ETFs), but at the time of publishing SCM had no direct position in any other security referenced in this article. No information accessed through the Investing Caffeine (IC) website constitutes investment, financial, legal, tax or other advice nor is to be relied on in making an investment or other decision. Please read disclosure language on IC Contact page.
Inflating Dollars & Deflating Footballs

This article is an excerpt from a previously released Sidoxia Capital Management complementary newsletter (February 2, 2015). Subscribe on the right side of the page for the complete text.
In the weeks building up to Super Bowl XLIX (New England Patriots vs. Seattle Seahawks) much of the media hype was focused on the controversial alleged “Deflategate”, or the discovery of deflated Patriot footballs, which theoretically could have been used for an unfair advantage by New England’s quarterback Tom Brady. While Brady ended up winning his record-tying 4th Super Bowl ring for the Patriots by defeating the Seahawks 28-24, the stock market deflated during the first month of 2015 as well. Similar to last year, the stock market has temporarily declined last January before surging ahead +11.4% for the full year of 2014. It’s early in 2015, and investors chose to lock-in a small portion of the hefty, multi-year bull market gains. The S&P 500 was sacked for a loss of -3.1% and the Dow Jones Industrial index by -3.7%.
Despite some early performance headwinds, the U.S. economy kicked off the year with the wind behind its back in the form of deflating oil prices. Specifically, West Texas Intermediate (WTI) crude oil prices declined -9.4% last month to $48.24, and over -51.0% over the last six months. Like a fresh set of substitute legs coming off the bench to support the team, the oil price decline represents an effective $125 billion tax cut for consumers in the form of lower gasoline prices (average $2.03 per gallon nationally) – see chart below. The gasoline relief will allow consumers more discretionary spending money, so football fans, for example, can buy more hot dogs, beer, and souvenirs at the Super Bowl. The cause for the recent price bust? The primary reasons are three-fold: 1) Sluggish oil demand from developed markets like Europe and Japan coupled with slowing consumption growth in some emerging markets like China; 2) Growing supply in various U.S. fracking regions has created a temporary global oil glut; and 3) Uncertainty surrounding OPEC (Organization of Petroleum Exporting Countries) supply/production policies, which became even more unclear with the recent announced death of Saudi Arabia’s King Abdullah.
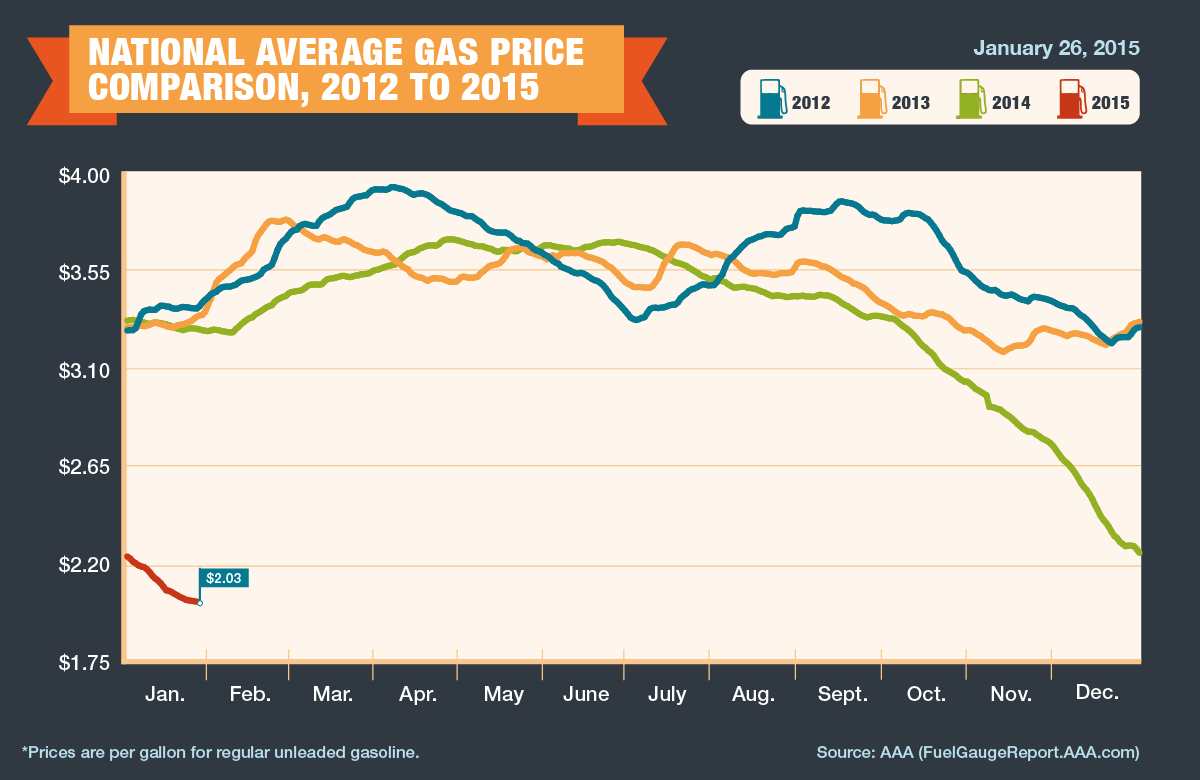
Source: AAA
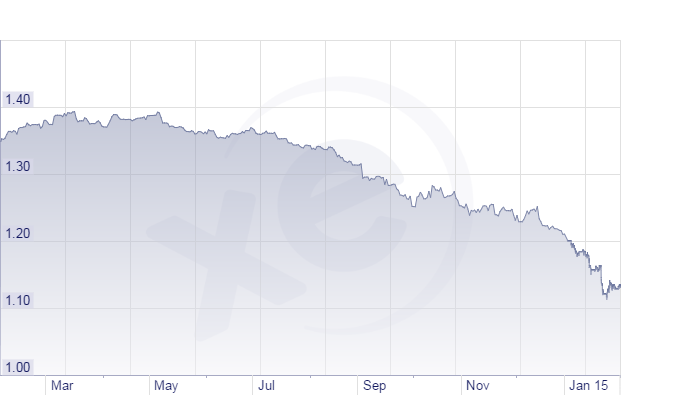
More deflating than the NFL football’s “Deflategate” is the approximate -17% collapse in the value of the euro currency (see chart below). Euro currency matters were made worse in response to European Central Bank’s (ECB) President Mario Draghi’s announcement that the eurozone would commence its own $67 billion monthly Quantitative Easing (QE) program (very similar to the QE program that Federal Reserve Chairwoman Janet Yellen halted last year). In total, if carried out to its full design, the euro QE version should amount to about $1.3 trillion. The depreciating effect on the euro (and appreciating value of the euro) should help stimulate European exports, while lowering the cost of U.S. imports – you may now be able to afford that new Rolls-Royce purchase you’ve been putting off. What’s more, the rising dollar is beneficial for Americans who are planning to vacation abroad…Paris here we come!
Source: XE.com
Another fumble suffered by the global currency markets was introduced with the unexpected announcement by the Swiss National Bank (SNB) that decided to remove its artificial currency peg to the euro. Effectively, the SNB had been purchased and accumulated a $490 billion war-chest reserve (Supply & Demand Lessons) to artificially depress the value of the Swiss franc, thereby allowing the country to sell more Swiss army knives and watches abroad. When the SNB could no longer afford to prop up the value of the franc, the currency value spiked +20% against the euro in a single day…ouch! In addition to making its exports more expensive for foreigners, the central bank’s move also pushed long-term Swiss Treasury bond yields negative. No, you don’t need to check your vision – investors are indeed paying Switzerland to hold investor money (i.e., interest rates are at an unprecedented negative level).
In addition to some of the previously mentioned setbacks, financial markets suffered another penalty flag. Last month, multiple deadly terrorist acts were carried out at a satirical magazine headquarters and a Jewish supermarket – both in Paris. Combined, there were 16 people who lost their lives in these senseless acts of violence. Unfortunately, we don’t live in a Utopian world, so with seven billion people in this world there will continue to be pointless incidences like these. However, the good news is the economic game always goes on in spite of terrorism.
As is always the case, there will always be concerns in the marketplace, whether it is worries about inflation, geopolitics, the economy, Federal Reserve policy, or other factors like a potential exit of Greece out of the eurozone. These concerns have remained in place over the last six years and the stock market has about tripled. The fact remains that interest rates are at a generational low (see also Stretching the High Yield Rubber Band), thereby supplying a scarcity of opportunities in the fixed income space. Diversification remains important, but regardless of your time horizon and risk tolerance, attractively valued equities, including high-quality, dividend-paying stocks should account for a certain portion of your portfolio. Any winning retirement playbook understands a low-cost, globally diversified portfolio, integrating a broad set of asset classes is the best way of preventing a “deflating” outcome in your long-term finances.

Wade W. Slome, CFA, CFP®
Plan. Invest. Prosper.
DISCLOSURE: Sidoxia Capital Management (SCM) and some of its clients hold positions in certain exchange traded funds (ETFs), but at the time of publishing SCM had no direct position in any other security referenced in this article. No information accessed through the Investing Caffeine (IC) website constitutes investment, financial, legal, tax or other advice nor is to be relied on in making an investment or other decision. Please read disclosure language on IC Contact page.