Posts filed under ‘Stocks’
Can the Lost Decade Strike Twice?

There is an old saying that lightning does not strike twice in the same place. I firmly believe this principle will apply to stock returns over the next decade. Josh Brown, investor and writer for The Reformed Broker highlighted a chart published by Bloomberg showing the 10-year return for various asset classes. Statisticians and market commentators have been quick to point out that stocks, as measured by various benchmarks, have not only underperformed bonds for the last 10 years, but stock performance has actually also been negative for the trailing decade.
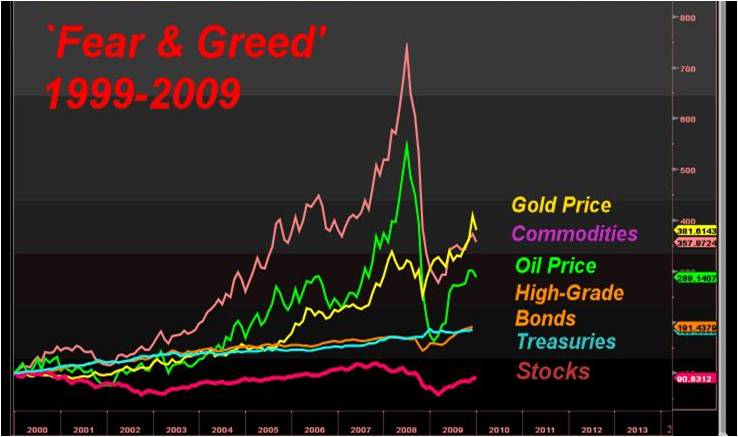
Source: Bloomberg via The Reformed Broker
Will this trend persist during the next decade? Will the lost decade in stocks be repeated again, similar to the deflation death spiral experienced by the Japanese? (Read more regarding Japanese market on IC). With the Fed Funds rate at effectively zero, is it possible bonds can pull off a miracle over the next 10 years? I suppose anything is possible, but I seriously doubt it.
Let’s not forget that the P/E ratio (Price-Earnings) pegged by some to be at about 14-15x’s 2010 expected earnings – nestled comfortably within historical bands. Granted, financials and some other sectors were overheated (e.g. certain Consumer industries), but based on next year’s estimates, some industries are already expected to exceed the peak earnings achieved during 2007 (e.g., Technology).
History on Our Side

Source: Crestmont Research. Dated graph over the last century showing stock returns rarely result in negative returns over a rolling 10 year period.
For the trailing decade using December 20, 2009 as an end point, I arrive at a marginally negative return for the S&P 500 index assuming an average dividend yield of 2.5% for the period. Certainly the negative return would be pronounced by any fees, commissions or taxes related to a 10-year buy-and-hold strategy of the broad market index. This chart gets chopped off in 2005, nonetheless history is on our side, lending support that stock returns have a good chance of improving on the results over the last 10 years.
Equity Risk Premium
The bubbles and scandals that have blanketed corporate America over the last 10 years have made the average investor extremely skeptical. What does this mean for the pricing of risk? Well, if you rewind to the year 2000 when technology exceeded 50% of some indexes, and many investors thought technology was a low risk endeavor, there was virtually no equity risk premium discounted into many stock prices. If you fast forward to today, the reverse is occurring. Investors despise market volatility and arguably demand a much higher risk premium for taking on the instability of stocks. This is the exact environment investors should desire – lots of skepticism and money piled into bonds (See IC article on investor queasiness). As Warren Buffett says, “Be fearful when others are greedy and greedy when others are fearful.” I believe the next 10 years will be a time to be greedy.
The analysis above is obviously very narrow in scope, since we are only discussing domestic stock markets. In my client portfolios I advocate a broadly diversified portfolio across asset classes (including bonds), geographies, and styles. However, in managing bonds across portfolios, I am forced to tactfully include strategies such as inflation protection and shorter duration techniques. With the year-end fast approaching, now is a good time to review your financial goals and asset allocation.
Lightning definitely negatively impacted stocks this decade, but betting for lightning to strike twice this decade could very well turn out to be a losing wager.
Wade W. Slome, CFA, CFP®
Plan. Invest. Prosper.
DISCLOSURE: Sidoxia Capital Management (SCM) and some of its clients own certain exchange traded funds, but at time of publishing had no direct positions in BRKA. No information accessed through the Investing Caffeine (IC) website constitutes investment, financial, legal, tax or other advice nor is to be relied on in making an investment or other decision. Please read disclosure language on IC “Contact” page.
Running with the Bulls

Guest Contributing Writer: Bruce Wimberly
No matter where you turn some “expert” is espousing his or her view on the direction of the market. The reality is none of them know. My advice to anyone is avoid the fallacy of experts. Those that purport to know, donʼt. It is a mere exercise in futility to justify charging higher fees. Letʼs be honest if anyone knew the future direction of asset prices they would be beyond rich (Iʼm talking John Paulson – Trade of the Century rich!). Nice job John who would have thought you could make that much money betting against mortgages.
As investors our best bet is to accept that fact that market timing is a losing strategy. Timing the market is similar to a coin flip. Pure and simple, the cost of getting it wrong wipes out the occasional gain of getting it right. Remember, every time you listen to the perma-bears and try to time the market, there is big time investment professional on the other side of that trade who is by definition taking the opposite view.
Good investors expand their timeframes. They do not get sucked into the news of the day. Let the perma-bears worry about Dubai, currency devaluation, or whatever else is todayʼs fear. Keep in mind there is always something to worry about. For long term investors the greatest fear is not being in the market. For example, if inflation were to average 3% and you are sitting in cash earning nothing your money will be cut in half by 2033. Grandmaʼs mattress is not an option for most people.
Now back to the question of bulls versus bears and the direction of the markets. Who is right? The simplest way to think about this comes from Oracle of Omaha himself, Warren Buffett. Buffett thinks of the market as a reflection of total market cap relative to US GNP (gross national product). After all, in the long run the market should approximate some measure of overall corporate profitability or in this case overall economic growth. If you accept Buffettʼs argument then the market is neither overly expensive or cheap. As of yesterday the total market index is at $11,296.2 billion which is about 79% of the last reported GDP. (I know the perma-bulls will find some reason to bash the reported GDP number). Nevertheless, this simple formula provides a good long term context on which to gage the relative attractiveness of the overall market. To put todayʼs number in context (79%) at the peak of the market bubble in 1999, the ratio of total market cap/GDP was 150% or almost double todayʼs reading. Yes, the market has made a major move from depressed levels earlier in the year but that is irrelevant. Donʼt anchor on that number or you will never get off the sidelines.
My advice is simple, ignore the perma-bears and avoid market timing like the plague for it is a suckers bet (see also article on passive vs. active investing). If the market does pull back (and it will at some point) this is great news for the long term investor. Anytime you can buy a stock on sale – this is a good thing! So enjoy the Christmas holidays, donʼt believe the hyped up bears and as always:
Plan. Invest. Prosper.
DISCLOSURE: Sidoxia Capital Management (SCM) and some of its clients own certain exchange traded funds and equity securities in client and personal portfolios at the time of publishing, but had no direct position in BRKA/B. No information accessed through the Investing Caffeine (IC) website constitutes investment, financial, legal, tax or other advice nor is to be relied on in making an investment or other decision. Please read disclosure language on IC “Contact” page.
Passive vs. Active Investing: Darts, Monkeys & Pros

Bob Turner is founder of Turner Investments and a manager of several funds at the investment company. In a recent article he reintroduces the all-important, longstanding debate of active management (“hands-on”) versus passive management (“hands off”) approaches to investing.
Mr. Turner makes some good arguments for the active management camp, however some feel differently – take for example Burton Malkiel. The Princeton professor theorizes in his book A Random Walk Down Wall Street that “a blindfolded monkey throwing darts at a newspaper’s stock page could select a portfolio that would do just as well as one carefully selected by experts.” In fact, The Wall Street Journal manages an Investment Dartboard contest that stacks up amateur investors’ picks against the pros’ and random stock picks selected by randomly thrown darts. In many instances, the dartboard picks outperform the professionals.
Given the controversy, who’s right…the darts, monkeys, or pros? Distinguishing between the different categorizations can be difficult, but we will take a stab nevertheless.
Arguments for Active Management
Turner contends, active management outperforms in periods of high volatility and he believes the industry will be entering such a phase:
“Active managers historically have tended to perform best in a market in which the performance of individual stocks varies widely.”
He also acknowledges that not all active managers outperform and admits there are periods where passive management will do better:
“The reason why most active investors fail to outperform is because they in fact constitute most of the market. Even in the best of times, not all active managers can hope to outperform…The business of picking stocks is to some degree a zero-sum game; the results achieved by the best managers will be offset at least somewhat by the subpar performance of other managers.”
Buttressing his argument for active management, Turner references data from Advisor Perspectives showing an inconclusive percentage (40.5%-67.8%) of the actively managed funds trailing the passively managed indexes from 2000 to 2008.
The Case for Passive Management
Turner cites one specific study to support his active management cause. However, my experience gleaned from the vast amounts of academic and industry data point to approximately 75% of active managers underperforming their passively managed indexes, over longer periods of time. Notably, a recent study conducted by Standard & Poor’s SPIVA division (S&P Indices Versus Active Funds) discovered the following conclusions over the five year market cycle from 2004 to 2008:
- S&P 500 outperformed 71.9% of actively managed large cap funds;
- S&P MidCap 400 outperformed 79.1% of mid cap funds;
- S&P SmallCap 600 outperformed 85.5% of small cap funds.
Read more about the dirty secrets shrinking your portfolio.
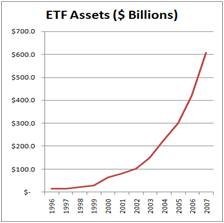
According to the Vanguard Group and the Investment Company Institute, about 25% of institutional assets and about 12% of individual investors’ assets are currently indexed (passive strategies). If you doubt the popularity of passive investment strategies, then look no further than the growth of Exchange Traded Funds (ETFs – see chart), index funds, or Vanguard Groups more than $1 trillion dollars in assets under management.
Although I am a firm believer in passive investing, one of its shortcomings is mean reversion. This is the idea that upward or downward moving trends tend to revert back to an average or normal level over time. Active investing can take advantage of mean reversion, conversely passive investing cannot. Indexes can get very top-heavy in weightings of outperforming sectors or industries, meaning theoretically you could be buying larger and larger shares of an index in overpriced glamour stocks on the verge of collapse. We experienced these lopsided index weightings through the technology bubbles in the late 1990s and financials in 2008. Some strategies may be better than other over the long run, but every strategy, even passive investing, has its own unique set of deficiencies and risks.
Professional Sports and Investing
As I discuss in my book, there are similarities that can be drawn between professional sports and investing with respect to active vs. passive management. Like the scarce number of .300 hitters in baseball, I believe there are a select few investment managers who can consistently outperform the market. In 2007, AssociatedContent.com did a study that showed there were only 22 active career .300 hitters in Major League Baseball. I recognize in the investing world there can be a larger role for “luck,” which is difficult, if not impossible, to measure (luck won’t help me much in hitting a 100 mile per hour fastball thrown by Nolan Ryan). Nonetheless, in the professional sports arena, there are some Hall of Famers (prospects) that have proved they could (can) consistently outperform their peers for extended durations of time.
Experience is another distinction I would highlight in comparing sports and investing. Unlike sports, in the investment world I believe there is a positive correlation between age and ability. The more experience an investor gains, generally the better long-term return achieved. Like many professions, the more experience you gain, the more valuable you become. Unfortunately, in many sports, ability deteriorates and muscles atrophy over time.
Size Matters
Experience alone will not make you a better investor. Some investors are born with an innate gift or intellect that propels them ahead of the pack. However, most great investors eventually get cursed by their own success thanks to accumulating assets. Warren Buffet knows the consequences of managing large amounts of dollars, “gravity always wins.” Having managed a $20 billion fund, I fully appreciate the challenges of investing larger sums of money. Managing a smaller fund is similar to navigating a speed boat – not too difficult to maneuver and fairly easy to dodge obstacles. Managing heftier pools of money can be like captaining a supertanker, but unfortunately the same rapid u-turn expectations of the speedboat remain. Managing large amounts of capital can be crippling, and that’s why captaining a supertanker requires the proper foresight and experience.
Room for All
As I’ve stated before, I believe the market is efficient in the long run, but can be terribly inefficient in the short-run, especially when the behavioral aspects of emotion (fear and greed) take over. The “wait for me, I want to play too” greed from the late 1990s technology craze and the credit-based economic collapse of 2008-2009 are further examples of inefficient situations that can be exploited by active managers. However, due to multiple fees, transaction costs, taxes, not to mention the short-term performance/compensation pressures to perform, I believe the odds are stacked against the active managers. For those experienced managers that have played the game for a long period and have a track record of success, I feel active management can play a role.
At Sidoxia Capital Management, I choose to create investment portfolios that blend a mixture of passive and active investment strategies. Although my hedge fund has outperformed the S&P 500 in 2009, that fact does not necessarily mean it’s the appropriate sole approach for all clients. As Warren Buffet states, investors should stick to their “circle of competence” so they can confidently invest in what they know. That’s why I generally stick to the areas of my expertise when I’m actively investing in stocks, and fill in the remainder of client portfolios with transparent, low-cost, tax-efficient equity and fixed income products (i.e., Exchange Traded Funds).
Even though the actively managed Turner Funds appear to have a mixed-bag of performance numbers relative to passively managed strategies, I appreciate Bob Turner’s article for addressing this important issue. I’m sure the debate will never fully be resolved. In the meantime, my client portfolios will aim to mix the best of both worlds within active and passive management strategies in the eternal quest of outwitting the darts, monkeys, and other pros.
Read the full Bob Turner article on Morningstar.com
Wade W. Slome, CFA, CFP®
Plan. Invest. Prosper.
DISCLOSURE: Sidoxia Capital Management (SCM) and some of its clients own certain exchange traded funds but had no direct position in stocks mentioned in this article. No information accessed through the Investing Caffeine (IC) website constitutes investment, financial, legal, tax or other advice nor is to be relied on in making an investment or other decision. Please read disclosure language on IC “Contact” page.
The Economics and Consequences of Obesity

‘Tis the season to consume a lot of calories, and my tighter fitting, post turkey-day trousers can attest to that fact. Healthcare reform is front and center in the national debate, as well, and the rising epidemic of obesity should play a significant role in the discussion. Why is this issue so important? According to female financial guru, Suze Orman, we are already spending $57 billion more on obesity than cancer. Obesity-related health care costs totaled about $117 billion in 2000, according to the CDC (Center of Disease Control). One study on obesity estimates the problem will cost the United States $344 billion in health costs by 2018.
Although it may be an uncomfortable issue to talk about, this matter has had a direct personal impact on my family, making the problem all the more tangible to me. Regardless of the function of genetics or what lifestyle choices are made, the negative consequences are indisputable.
Take a look at the table of negative outcomes provided by the CDC:
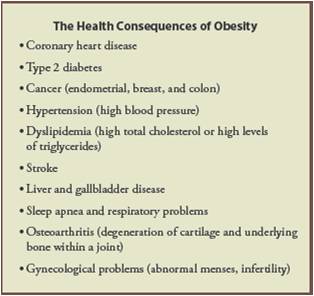
These consequences obviously take a large toll on the individuals, but they also have a massive impact on our healthcare system. And the CDC has the data to backup the severity of this intensifying problem:
“More than one third of U.S. adults—more than 72 million people—and 16% of U.S. children are obese. Since 1980, obesity rates for adults have doubled and rates for children have tripled. Obesity rates among all groups in society—irrespective of age, sex, race, ethnicity, socioeconomic status, education level, or geographic region—have increased markedly.”
Before solutions can be created, the root problems need to be addressed. One of the factors contributing to increased incidence of obesity is our unhealthy dietary habits (myself included). A chart from the New York Times highlights the economic impact of our food choices has been impacted by inflation trends. Over the last 30 years, unhealthy foods (beer, butter, and soda) have become much cheaper than healthy foods (fresh fruits and vegetables), on a relative basis (see chart below). Making a trip to fast food chains has not only become more convenient, but the practice has also become more affordable.

Source: Bureau of Labor Statistics (NY Times)
With our work lives stretched even further and stress levels rising, the picture below highlights the relationship between obesity (as measured by the Body Mass Index) and minutes spent per day eating. Our unhealthy, indoor, sedentary lifestyles take away from our healthy eating habits as well. The U.S. is the country with the highest percentage of individuals who are obese and the country that spends the third fewest minutes per day eating (eating more fast food). Seems like a fairly tight correlation.
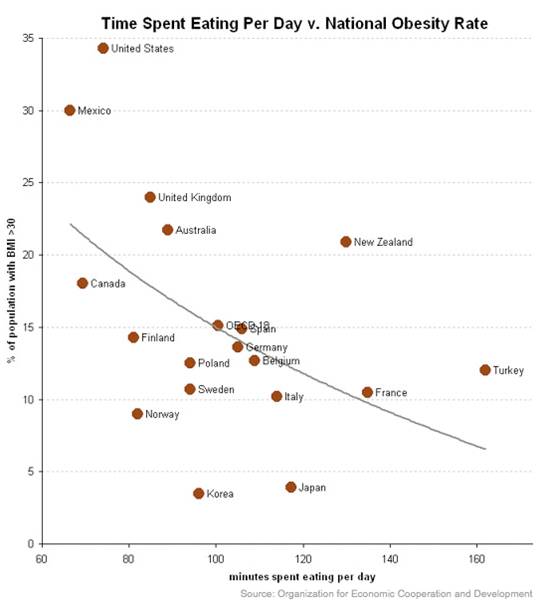
Data Source: OECD (Organization for Economic Cooperation and Development)
Solutions?
Education / Government: Educational support through cooperation with the government is necessary to spread the word regarding the consequences of obesity. Incentives also need to be integrated into our healthcare system so individuals can responsibly attack obesity head-on.
Behavioral Modification: Healthier diet and exercise lifestyles need to be evangelized. Implementation of economic incentives can possibly improve behavior by lowering insurance premiums in exchange for better health compliance.
Medications: Research needs to continue so innovative medications can help prevent and control obesity. Arena Pharmaceuticals (ARNA), VIVUS (VVUS), and Orexigen Therapeutics (OREX) are in the late stages in an attempt of getting their obesity drugs approved by the FDA. There is tremendous profit potential if the proper mix of efficacy and safety can be proven, however the detection of side-effects can potentially derail adoption and approval.
Surgery: Advancements have been introduced through medical technologies as well. Allergan’s (AGN) Lap-Band device is an example of an FDA approved device that effectively wraps around the stomach like a rubber-band to control excessive eating urges.
Obviously this is not an easy problem to deal with, as evidenced by the skyrocketing numbers. Many face inherent genetic hurdles in conquering diabetes, while others may have other health issues that contribute to overweight problems.
With the holidays upon us, I still plan on responsibly splurging on occasion, but I’m praying I will have the discipline to mix in some veggies and a run around the block with my eggnog and turkey leg. In the meantime, perhaps I’ll help support the economy by running to the mall and burning some holiday calories by doing some shopping!
Wade W. Slome, CFA, CFP®
Plan. Invest. Prosper.
DISCLOSURE: Sidoxia Capital Management (SCM) and some of its clients own certain exchange traded funds and AGN, but at time of publishing had no direct positions in ARNA, VVUS, or OREX. No information accessed through the Investing Caffeine (IC) website constitutes investment, financial, legal, tax or other advice nor is to be relied on in making an investment or other decision. Please read disclosure language on IC “Contact” page.
Equities Up, But Investors Queasy

The market may have recovered partially from its illness over the last two years, but investors are still queasy when it comes to equities. The market is up by more than +60% since the March 2009 lows despite the unemployment rate continuing to tick higher, reaching 10.2% in October. Even though equity markets have rebounded, recovering investors have flocked to the drug store with their prescriptions for bonds. Mark Dodson, CFA, from Hays Advisory published a telling chart that highlights the extreme aversion savers have shown towards stocks.
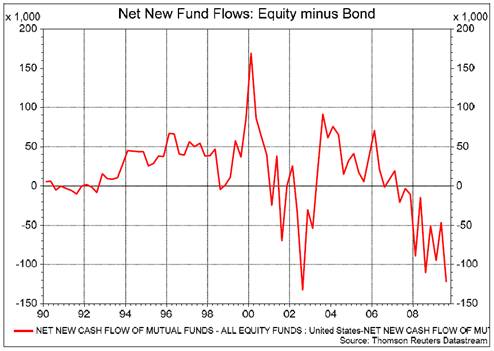
Source: Hays Advisory LLC (Thomson Reuters Datastream)
Dodson adds:
“Net new fund mutual fund flows favor bonds over stocks dramatically, so much so that flows are on the cusp of breaking into record territory, with the previous record occurring back in the doldrums of the 2002 bear market. Given nothing but the chart (above), we would never in a million years guess that the stock market has rallied 50-60% off the March lows. It looks more like what you would see right in the throes of a nasty stock market decline.”
Checking and savings data from the Federal Reserve Bank of Saint Louis further corroborates the mood of the general public as the nausea of the last two years has yet to wear off. The mountains of cash on the sidelines have the potential of fueling further gains under the right conditions (see also Dry Powder Piled High story).
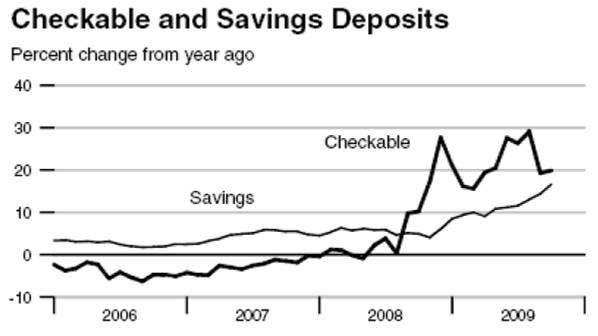
As Dodson notes in the Hays Advisory note, not everything is doom and gloom when it comes to stocks. For one, insider purchases according to the Emergent Financial Gambill Ratio is the highest since the recent bear market came to a halt. This trend is important, because as Peter Lynch emphasizes, “There are many reasons insiders sell shares but only one reason they buy, they feel the price is going up.”
What’s more, the yield curve is the steepest it has been in the last 25 years. This opposing signal should provide comfort to those blue investors that cried through inverted yield curves (T-Bill yields higher than 10-Year Notes) that preceded the recessions of 2000 and 2008.
Equity investors are still feeling ill, but time will tell if a dose of bond selling and a prescription for “cash-into-stocks” will make the queasy patient feel better?
Wade W. Slome, CFA, CFP®
Plan. Invest. Prosper.
DISCLOSURE: No information accessed through the Investing Caffeine (IC) website constitutes investment, financial, legal, tax or other advice nor is to be relied on in making an investment or other decision. Please read disclosure language on IC “Contact” page.
A Rare Breed: Father of Growth Investing

The man, the myth, the legend.
Successful long-term growth managers are part of a rare breed, but Thomas Rowe Price, Jr. – also known as the “Father of Growth Investing” – certainly qualifies. Too often, value legends like Warren Buffett and Benjamin Graham are highlighted in media circles. Using a baseball analogy, growth heroes like Mr. Price are more akin to atypical knuckleball pitchers, like Hall of Famer Phil Neikro. Writing about Mr. Price is consistent with my belief that investors striving to improve performance will be served well by studying great investors (for other growth superstars, see also Phil Fisher, Ron Baron, and John Calamos, Sr.).
History
T. Rowe Price was born in Linwood, Maryland, in 1898 and died in 1983. Price graduated from Swathmore College in 1919 with a degree in Chemistry, and then went onto work at Baltimore-based Mackubin Goodrich, which eventually became Legg Mason Inc. (LM). In 1937 he founded T. Rowe Price Associates (TROW) and successfully ramped up the company before the launch of the T. Rowe Price Growth Stock Fund in 1950. Expansion ensued until he made a timely sale of his company in the late 1960s (fortuitously before the 1973-1974 crash).
Philosophy
How did Price feel about growth investing?
“The growth stock theory of investing requires patience, but is less stressful than trading, generally has less risk, and reduces brokerage commissions and income taxes.”
This philosophy makes perfect sense to me; however it runs contrary to the strategies implemented by many managers whom are categorized in the “growth” style box today. In the hyper-sensitive, short-term focused performance world, many “momentum” managers play in this same “growth” sandbox. Typically this means managers buy stocks that are going up and sell stocks that are going down (see “momentum” article) over relatively short time frames, on average.
Price also firmly believed in fundamental research. As part of the investment process, Price believed in the “Life Cycle Theory of Companies,” meaning companies followed the phases of a human (birth, maturity, and decline). Price expands on this idea by stating the following: “An understanding of the life cycle of earnings growth and judgment in appraising future earnings trends are essential to investing.” He placed emphasis on investing in quality companies in good times and bad. In order to strip out economic cycle impacts, he compared company performance to peer performance – regardless of macroeconomic conditions.
John Train, the writer of “The Money Masters,” maintained the following factors were key underpinnings of Price’s investments:
- Superior research to develop products and markets.
- A lack of cutthroat competition.
- A comparative immunity from government regulation.
- Low total labor costs, but well-paid employees.
- At least a 10% return on invested capital, sustained high profit margins, and a superior growth of earnings per share.
Buy and Hold
The proof was in the pudding when it came to the “patience” referenced in Price’s quote above. For example, in the early 1970s, Price had accumulated gains of +6,184% in Xerox (XRX), which he held for 12 years, and gains of +23,666% in Merck (MRK), which he held for 31 years (Lessons from the Legends of Wall Street, Nikki Ross). Timing was not the most important factor in pulling the decision trigger:
“It is better to be early than too late in recognizing the passing of one era, the waning of old investment favorites and the advent of a new era affording new opportunities for the investor.”
In the polluted world of mass information that we sift through every day, I recommend reviewing the strategies of greats, including the “Father of Growth Investing” (T. Rowe Price). That’s my fatherly advice for you.
Wade W. Slome, CFA, CFP®
Plan. Invest. Prosper.
DISCLOSURE: Sidoxia Capital Management (SCM) and its clients owns certain exchange traded funds, but currently have no direct position in LM, TROW, XRX or MRK. No information accessed through the Investing Caffeine (IC) website constitutes investment, financial, legal, tax or other advice nor is to be relied on in making an investment or other decision. Please read disclosure language on IC “Contact” page.
Darkest Before Dawn – Gaming Industry Waiting for Sunrise

It is always darkest before dawn, and right now the days are dark in the video game industry.
The industry is facing multiple challenges ranging from the migration of players from console games to digital online games; the growth of the iPhone and mobile devices as a free and discounted gaming platform; sky-rocketing development and marketing costs; and not to mention a consumer recession in which coughing up $50-$60 bucks a pop for a next generation platform game can be quite painful (read more on economy).
Recent console price cuts are a welcomed positive, but industry leading Electronic Arts CEO (Ticker: ERTS), John Riccitiello’s sober assessment of the industry was summarized as followed:
“While the recent hardware price reductions are driving higher console sales, the improvement is not enough to get the industry back to flat software sales for the calendar year. We now expect packaged goods software to be down mid-to-high single digits in North America and Europe combined. This is well below our initial expectations for the year.”
Not all is lost, however. I am amazed out how gaming has expanded since I was a kid. I may be dating myself, but I vividly recall the endless summer days of playing Adventure and Pac-Man on my Atari 2600 and heading over to the arcade to play Defender with my buddies. Since the 1970s, the industry has matured dramatically.
If you don’t believe me, check out the trailer from the new industry megahit Call of Duty: Modern Warfare 2. Industry analysts are calling for an amazing $500 million in sales…in the first week! By way of comparison, this year’s top-grossing film in the U.S., “Transformers: Revenge of the Fallen,” generated over $200 million in sales over the first five days of its release.
If you have more time to burn, you can take a walk down memory lane to look at the history of video games from 1972 to 2007.
Electronic Arts (ERTS) a Long-Term Winner
As the complexity of the video game industry rises, the barriers to entry become even tougher, and weaker competitors fall to the way side. Industry leaders like Electronic Arts (EA), with approximately $4 billion in revenues and $2 billion in cash and securities on their balance sheet (with virtually no debt), stand to be powerful survivors once the industry finds its way through the valley. Not a large percentage of companies have about a third of its market capitalization in cash. Financial strength alone does not mean much if a company were in continual decline, but I strongly believe the industry will eventually rebound and EA will be pulled up with the tide. In their most recent quarter, the company highlighted their growing market share in North America and Europe couple with their #1 software publisher positioning on the PlayStation3 (PS3) and Microsoft Xbox 360 platforms.
Given all the swirling shifts in the industry, EA is not sitting on its hands either. In conjunction with the company’s earnings release, EA simultaneously announced their acquisition of Playfish, the largest social networking game provider on the internet, attracting over 60 million players per month and securing the #2 game provider position on Facebook. On the cost front, the company is implementing a targeted headcount reduction by approximately 1,500 employees, which will reduce costs by at least $100 million. This austerity plan will make EA more competitive and allow the company to invest more in growth initiatives and better handle the curveballs thrown at them. EA has become more focused too. As part of the cuts, the company will reduce the number of game titles from the mid-60 count last year to the high-30s next year. Quality, not quantity is the new emphasis and more resources will be diverted to EA’s online digital efforts.
The traditional video game packaged-game industry is very hit-driven, much like the movie industry. One way EA deals with this challenge is by creating franchises that keep consumers wanting more, whether it’s sequels to the Sims, Harry Potter, or other titles. Better yet, EA has created a razor blade replacement model with their sports franchises. For example, in Electronic Art’s Madden NFL franchise football game, players need to update their athlete rosters to account for the annual post-season blockbuster trades and fresh rookie signees. EA’s Sports division has a built-in mechanism to drive recurring demand for new content.
With the stock over $60 less than 24 months ago, a large percentage of the industry and company warts have already been discovered and discounted into the current stock price (~$18). As with all my stock picks, I leave dry powder as ammunition for any future purchases at lower prices. The critical two week selling season has historically accounted for up to 1/3 of a company’s total annual sales – that’s what I call a back-end loaded revenue stream! Or put another way, the software industry traditionally generates almost half of its annual sales during the holiday season. The tightly concentrated timeline for sales may bring heightened volatility to the stock’s trading pattern in the coming weeks.
For those with an extended time horizon, one need only look at EA’s cash pile, market positioning, normalized earnings, and long-term industry prospects in order to take a closer examination at Electronic Arts. Times are dark in the video game industry, but dawn will be here soon enough and Electronic Arts is positioned to benefit when the time comes.
Read EA’s Fiscal Q2 Earnings Call Transcript from Seeking Alpha
Wade W. Slome, CFA, CFP®
Plan. Invest. Prosper.
DISCLOSURE: Sidoxia Capital Management (SCM) and its clients have a long position in ERTS and AAPL at the time this article was originally posted. SCM and its clients own certain exchange traded funds, but currently have no direct position in ATVI, SNE, MSFT, or Facebook. No information accessed through the Investing Caffeine (IC) website constitutes investment, financial, legal, tax or other advice nor is to be relied on in making an investment or other decision. Please read disclosure language on IC “Contact” page.
From Pooches to Profits

Oh, I’m sure you’ve seen them – those nauseating people that willingly accept facial tongue baths from their pets and dress them up in ridiculous costumes. Hey, wait a second… I guess I’m one of those annoying people too. My wife and I were just debating which Halloween attire we should get for our dog…Cound Dogula or Barkenstein? But we are not the only fanatics humanizing our pets, as Petsmart (PETM) recently outlined in their recent analyst day. Sixty-two percent of U.S. households own a pet and if you just add up all the cats and dogs, the total reaches 171 million pets.
This is no small business – according to PETM, the industry exceeded $43 billion in 2008, spanning a whole variety of products and services, including food, veterinary care, supplies, and grooming/boarding services. PETM is collecting its growing share of the market at 14%, and I expect this share to increase over time.
What’s fueling the growth of the sector? For one, demographics is a contributor. As many Baby Boomers have become “empty-nesters” (kids move on) over time, they tend to fill that void with a pet. In addition, many working marriages have pushed having kids to the back-burner and choose to substitute a furry baby as a surrogate.
These trends have translated into vibrant growth for PETM over the years. The company has over 1,150 stores and 738 Banfield veterinary partnership locations, not to mention a significant rise in hotels. No, these are not the Four Seasons, but rather pet hotels that you can board Fido in when you take that family vacation to Hawaii or where guilt-ridden families can drop your friend off for doggy Day camp. These 156 pet hotels, which are included as part of PETM’s “Services,” continue to gain traction as they plan to open 20 new locations per year. Currently, services represents 11% of PETM’s sales (up from 8.8% in 2006), growing faster than overall sales with a significantly higher profit margins than the corporate average.
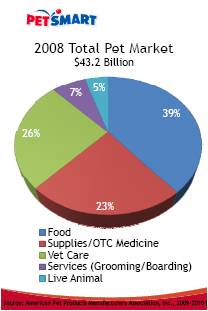
Source: Petsmart 2009 Analyst Day
Not everything is peachy keen as the company acknowledges the negative impact of unemployment, lower discretionary consumer spending and higher savings rate. As a result, PETM’s high margin “Hardgoods” category has gotten clobbered lately – even with more stable sales in non-discretionary categories like “Food.” Despite the economic developments, the company is not sitting on its hands. Not only are they focusing on driving sales through store pet adoptions (approaching four million on a cumulative basis), but the company is also reaping the rewards of its Pet Perks customer database to optimize sales performance. Petsmart has even taken a page out of Costco’s (COST) book with its focus on private label brands.
Beyond sales growth initiatives, the company has also been tightening their spending belt. For example, PETM is reducing capital expenditures from 6.4% of sales ($294 million) in 2007 to an estimated 2.2% ($120 million) this year. In addition, PETM is working on process improvements, space optimization, labor scheduling, and other cost-cutting initiatives.
The fruits of these labors are creating results. Just last week at their analyst meeting, PETM raised their 2009 earnings per share forecast to a range of $1.43 – $1.51 (from previous estimate of $1.37 – $1.45). Based on 2010 Wall Street estimate of $1.54, PETM’s stock currently trades at a reasonable 16.5x P/E multiple. On a free cash flow basis, the multiple on the estimated $226 million this year is even more attractive (see my article on cash flow investing).
Halloween is just around the corner, so maybe beyond picking up a doggie cardigan for the crisp fall weather, maybe you should consider some PETM shares too.
Wade W. Slome, CFA, CFP®
Plan. Invest. Prosper.
DISCLOSURE: Sidoxia Capital Management and its client accounts have no direct position in COST shares at the time this article was originally posted. Slome Sidoxia Fund does have a long position in PETM shares at the time this article was originally posted. No information accessed through the Investing Caffeine (IC) website constitutes investment, financial, legal, tax or other advice nor is to be relied on in making an investment or other decision. Please read disclosure language on IC “Contact” page.
Siegel Digs in Heels on Stocks

Jeremy Siegel, Wharton University Professor and author of Stocks for the Long Run, is defending his long-term thesis that stocks will outperform bonds over the long-run. Mr. Siegel in his latest Financial Times article vigorously defends his optimistic equity belief despite recent questions regarding the validity and accuracy of his long-term data (see my earlier article).
He acknowledges the -3.15% return of U.S. stock performance over the last decade (the fourth worst period since 1871), so what gives him confidence in stocks now? Let’s take a peek on why Siegel is digging in his heels:
Since 1871, the three worst ten-year returns for stocks have ended in the years 1974, 1920, and 1978. These were followed, respectively, by real, after-inflation stock returns of more than 8 per cent, 13 per cent, and 9 per cent over next ten years. In fact for the 13 ten-year periods of negative returns stocks have suffered since 1871, the next ten years gave investors real returns that averaged over 10 per cent per year. This return has far exceeded the average 6.66 per cent real return in all ten years periods, and is twice the return offered by long-term government bonds.
Siegel’s bullish stock stance has also been attacked by Robert Arnott, Chairman of Research Affiliates, when he noted a certain bond strategy bested stocks over the last 40 years. Here’s what Mr. Siegel has to say about stock versus bond performance:
Even with the recent bear market factored in, stocks have always done better than Treasury bonds over every 30-year period since 1871. And over 20-year periods, stocks bested Treasuries in all but about 5 per cent of the cases… In fact, with the recent stock market recovery and bond market decline, stock returns now handily outpace bond returns over the past 30 and 40 years.
If you’re 50, 60, or older, then Siegel’s time horizons may not fit into your plans. Nonetheless, in any game one chooses to play (including the game of money), I, like many, prefer to have the odds stacked in my favor.
In addressing the skeptics, such as Bill Gross who believes the U.S. is entering a “New Normal” phase of sluggish growth, Mr. Siegel notes this commentary even if true does not account for the faster pace of international growth – Siegel goes on to explain that the S&P 500 corporations garner almost 50% of revenues from these faster growing areas outside the U.S.
On the subject of valuation, Mr. Siegel highlights the market is trading at roughly 14x’s 2010 estimates, well below the 18-20x multiples usually associated with low-interest rate periods like these.
In periods of extreme volatility (upwards or downwards), the prevailing beliefs fight reversion to the mean arguments because trend followers believe “this time is different.” Just think of the cab drivers who were buying tech stocks in the late 1990s, or of the neighbor buying rental real estate in 2006. Bill Gross with his “New Normal” doesn’t buy the reversion argument either. Time will tell if we have entered a new challenging era like Mr. Gross sees? Regardless, Professor Siegel will be digging in his heels as he invests in stocks for the long run.
Read the Whole Financial Times Article Written by Professor Siegel
Wade W. Slome, CFA, CFP®
Plan. Invest. Prosper.
EPS House of Cards: Tricks of the Trade

As we enter the quarterly ritual of the tsunami of earnings reports, investors will be combing through the financial reports. Due to the flood of information, and increasingly shorter and shorter investment time horizons, much of investors’ focus will center on a few quarterly report metrics – primarily earnings per share (EPS), revenues, and forecasts/guidance (if provided).
Many lessons have been learned from the financial crisis over the last few years, and one of the major ones is to do your homework thoroughly. Relying on a AAA ratings from Moody’s (MCO) and S&P (when ratings should have been more appropriately graded D or F) or blindly following a “Buy” rating from a conflicted investment banking firm just does not make sense.
FINANCIAL SECTOR COLLAPSE
Given the severity of the losses, investors need to be more demanding and comprehensive in their earnings analysis. In many instances the reported earnings numbers resemble a deceptive house of cards on a weak foundation, merely overlooked by distracted investors. Case in point is the Financial sector, which before the financial collapse saw distorted multi-year growth, propelled by phantom earnings due to artificial asset inflation and excessive leverage. One need look no further than the weighting of Financial stocks, which ballooned from 5% of the total S&P 500 Index market capitalization in 1980 to a peak of 23% in 2007. Once the credit and real estate bubble burst, the sector subsequently imploded to around 9% of the index value around the March 2009 lows. Let’s be honest, and ask ourselves how much faith can we put in the Financial sector earnings figures that moved from +$22.79 in 2007 to a loss of -$21.24 in 2008? Current forecasts for the sector are looking for a rebound back up to +$11.91 in 2010. Luckily, the opacity and black box nature of many of these Financials largely kept me out of the 2009 sector implosion.
WHAT TO WATCH FOR
But the Financial sector is not the only fuzzy areas of accounting manipulation. Thanks to our friends at the FASB (Financial Accounting Standards Board), company management teams have discretion in how they apply different GAAP (Generally Accepted Accounting Principles) rules. Saj Karsan, a contributing writer at Morningstar.com, also writes about the “Fallacy of Earnings Per Share.”
“EPS can fluctuate wildly from year to year. Writedowns, abnormal business conditions, asset sale gains/losses and other unusual factors find their way into EPS quite often. Investors are urged to average EPS over a business cycle, as stressed in Security Analysis Chapter 37, in order to get a true picture of a company’s earnings power.”
These gray areas of interpretation can lead to a range of distorted EPS outcomes. Here are a few ways companies can manipulate their EPS:
Distorted Expenses: If a $10 million manufacturing plant is expected to last 10 years, then the depreciation expense should be $1 million per year. If for some reason the Chief Financial Officer (CFO) suddenly decided the building would last 40 years rather than 10 years, then the expense would only be $250,000 per year. Voila, an instant $750,000 annual gain was created out of thin air due to management’s change in estimates.
Magical Revenues: Some companies have been known to do what’s called “stuffing the channel.” Or in other words, companies sometimes will ship product to a distributor or customer even if there is no immediate demand for that product. This practice can potentially increase the revenue of the reporting company, while providing the customer with more inventory on-hand. The major problem with the strategy is cash collection, which can be pushed way off in the future or become uncollectible.
Accounting Shifts: Under certain circumstances, specific expenses can be converted to an asset on the balance sheet, leading to inflated EPS numbers. A common example of this phenomenon occurs in the software industry, where software engineering expenses on the income statement get converted to capitalized software assets on the balance sheet. Again, like other schemes, this practice delays the negative expense effects on reported earnings.
Artificial Income: Not only did many of the trouble banks make imprudent loans to borrowers that were unlikely to repay, but the loans were made based on assumptions that asset prices would go up indefinitely and credit costs would remain freakishly low. Based on the overly optimistic repayment and loss assumptions, banks recognized massive amounts of gains which propelled even more imprudent loans. Needless to say, investors are now more tightly questioning these assumptions. That said, recent relaxation of mark-to-market accounting makes it even more difficult to estimate the true values of assets on the bank’s balance sheets.
Like dieting, there are no easy solutions. Tearing through the financial statements is tough work and requires a lot of diligence. My process of identifying winning stocks is heavily cash flow based (see my article on cash flow investing) analysis, which although lumpier and more volatile than basic EPS analysis, provides a deeper understanding of a company’s value-creating capabilities and true cash generation powers.
As earnings season kicks into full gear, do yourself a favor and not only take a more critical” eye towards company earnings, but follow the cash to a firmer conviction in your stock picks. Otherwise, those shaky EPS numbers may lead to a tumbling house of cards.
Read Saj Karsan’s Full Article
Wade W. Slome, CFA, CFP®
Plan. Invest. Prosper.
DISCLOSURE: Sidoxia Capital Management has no direct position in MCO or MHP at the time this article was originally posted. No information accessed through the Investing Caffeine (IC) website constitutes investment, financial, legal, tax or other advice nor is to be relied on in making an investment or other decision. Please read disclosure language on IC “Contact” page.