Posts filed under ‘Stocks’
Got Growth?

Investing in the stock market can be quite stressful, especially during periods of volatility…but investing doesn’t have to be nerve-racking. Investing legend T. Rowe price captured the beneficial sentiments of growth investing beautifully when he stated the following:
“The growth stock theory of investing requires patience, but is less stressful than trading, generally has less risk, and reduces brokerage commissions and income taxes.”
What I’ve learned over my investing career is that fretting over such things as downgrades, management changes, macroeconomic data, earnings misses, geopolitical headlines, and other irrelevant transitory factors leads to more heartache than gains. If you listen to a dozen so-called pundits, talking heads, journalists, or bloggers, what you quickly realize is that all you are often left with are a dozen different opinions. Opinions don’t matter…the facts do.
Finding Multi-Baggers: The Power of Compounding
Rather than succumbing to knee-jerk reactions from the worries of the day, great long-term investors realize the benefits of compounding. We know T. Rowe Price appreciated this principle because he agreed with Nobel Prize winning physicist Albert Einstein’s view that “compounding interest” should be considered the “8th wonder of the world” – see also how Christopher Columbus can turn a penny into $121 billion (Compounding: A Penny Saved is Billions Earned).
People generally refer to Warren Buffett as a “Value” investor, but in fact, despite the Ben Graham moniker, Buffett has owned some of the greatest growth stocks of all-time. For example, Coca Cola Co (KO) achieved roughly a 20x return from 1988 – 1998, as shown below:
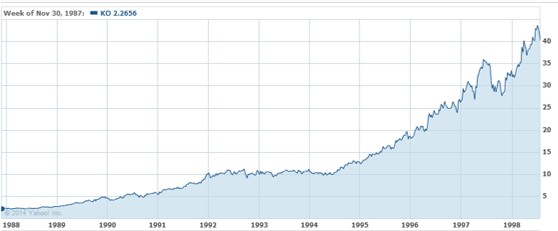
Source: Yahoo! Finance
If you look at other charts of Buffett’s long-term holdings, such as Wells Fargo & Company (WFC), American Express Co (AXP), and Procter & Gamble – Gillette (PG), the incredible compounded gains are just as astounding.
In recent decades, there is no question that stocks have benefited from P/E expansion. P/E ratios, or the average price paid for stocks, has increased from the early 1980s as long-term interest rates have declined from the high-teens to the low single-digits, but the real lifeblood for any stock is earnings growth (see also It’s the Earnings, Stupid). As growth investor extraordinaire Peter Lynch once said:
“People may bet on hourly wiggles of the market but it’s the earnings that waggle the wiggle long term.”
As Lynch also pointed out, it only takes the identification of a few great multi-bagger stocks every decade to compile a tremendous track record, while simultaneously hiding many sins:
“Fortunately the long-range profits earned from really good common stocks should more than balance the losses from a normal percentage of such mistakes.”
The Scarcity of Growth
Ever since the technology bubble burst in 2000, Growth stocks have felt the pain. Since that period, the Russell 1000 Value index – R1KV (Ticker: IWD) has almost doubled in value and outperformed the Russell 1000 Growth index – R1KG (Ticker: IWF) by more than +60% (see chart below):
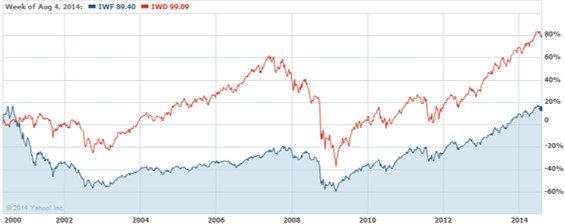
Source: Yahoo! Finance
Although the R1KG index has yet to breach its previous year 2000 highs, ever since the onset of the Great Financial Crisis (end of 2007), the R1KG index has been on the comeback trail. Now, the Russell 1000 Growth index has outperformed its Value sister index by an impressive +25% (see chart below):
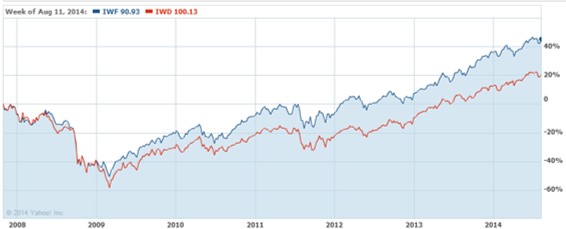
Source: Yahoo! Finance
Why such a disparity? Well, in a PIMCO “New Normal & New Neutral” world where global growth forecasts are being cut by the IMF and a paltry advance of 1.7% in U.S. GDP is expected, investors are on a feverish hunt for growth. U.S. investors are myopically focused on our 2.34% 10-Year Treasury yield, but if you look around the rest of the globe, many yields are at multi-hundred year lows. Consider 10-year yields in Germany sit at 0.96%; Japan at 0.50%; Ireland at 1.98%; and Hong Kong at 1.94% as a few examples. This scarcity of growth has led to outperformance in Growth stocks and this trend should continue until we see a clear sustainable acceleration in global growth.
If we dig a little deeper, you can see the 25% premium in the R1KG P/E ratio of 20.8x vs. 16.7x for the R1KV is well deserved. Historical 5-year earnings growth for the R1KG has been +52% higher than R1KV (17.8% vs. 11.7%, respectively). Going forward, the superior earnings performance is expected to continue. Long-term growth for the R1KG index is expected to be around 55% higher than the R1KV index (14% vs 9%).
In this 24/7, Facebook, Twitter society we live in, investing has never been more challenging with the avalanche of daily news. The ultra-low interest rates and lethargic global recovery hasn’t made my life at Sidoxia any easier. But one thing that is clear is that the investment tide is not lifting all Growth and Value stocks at the same pace. The benefits of long-term Growth investing are clear, and in an environment plagued by a scarcity of growth, it is becoming more important than ever when reviewing your investment portfolios to ask yourself, “Got Growth?”
Wade W. Slome, CFA, CFP®
Plan. Invest. Prosper.
DISCLOSURE: Sidoxia Capital Management (SCM) and some of its clients hold long positions in KO/PG (non-discretionary accounts) and certain exchange traded fund positions, but at the time of publishing SCM had no direct position in TWTR, FB, WFC, AXP, IWF, IWD or any other security referenced in this article. No information accessed through the Investing Caffeine (IC) website constitutes investment, financial, legal, tax or other advice nor is to be relied on in making an investment or other decision. Please read disclosure language on IC Contact page.
Psst…Do You Want to Join the Club?

 
#2. Don’t waste your time listening to the media.
Like dieting, the framework is simple to understand, but difficult to execute. Theoretically, if you follow Rule #1, you don’t have worry about Rule #2. Unfortunately, many people have no rules or discipline in place, and instead let their emotions drive all investing decisions. When it comes to following the media, Mark Twain stated it best:
“If you don’t read the newspaper, you are uninformed. If you do read the newspaper, you are misinformed.”
It’s fine to be informed, as long as the deluge of data doesn’t enslave you into bad, knee-jerk decision-making. You’ve seen those friends, family members and co-workers who are glued to their cell phones or TVs while insatiably devouring real-time data from CNBC, CNN, or their favorite internet blog. The grinding teeth and sweaty palms should be a dead giveaway that these habits are not healthy for investment account balances or blood pressure.
Thanks to the endless scary headlines and stream of geopolitical turmoil (fear sells), millions of investors have missed out on one of the most staggering bull market rallies in history. More specifically, the S&P 500 index (large capitalization companies) has almost tripled in value from early 2009 (666 to 1,931) and the S&P 600 index (small capitalization companies) almost quadrupled from 181 to 645.
The Challenge

Becoming a member of the Successful Investors Club (SIC) is no easy feat. As I’ve written in the past, the human brain has evolved dramatically over tens of thousands of years, but the troubling, emotionally-driven amygdala tissue mass at the end of the brain stem (a.k.a., “Lizard Brain“) still remains. The “Lizard Brain” automatically produces a genetic flight response to perceived worrisome stimuli surrounding us. In other words, our “Lizard Brain” often interprets excessively sensationalized current events as a threat to our financial security and well-being.
It’s no wonder amateur investors have trouble dealing with the incessantly changing headlines. Yesterday, investors were panicked over the P.I.I.G.S (Portugal, Italy, Ireland, Greece, Spain), the Arab Spring (Tunisia, Egypt, Iran, etc.), and Cyprus. Today, it’s Ukraine, Argentina, Israel, Gaza, Syria, and Iraq. Tomorrow…who knows? It’s bound to be another fiscally irresponsible country, terrorist group, or autocratic leader wreaking havoc upon their people or enemies.
During the pre-internet or pre-smartphone era, the average person couldn’t even find Ukraine, Syria, or the Gaza Strip on a map. Today, we are bombarded 24/7 with frightening stories over these remote regions that have dubious economic impact on the global economy.
Take the Ukraine for example, which if you think about it is a fiscal pimple on the global economy. Ukraine’s troubled $177 billion economy, represents a mere 0.29% of the $76 trillion global GDP. Could an extended or heightened conflict in the region hinder the energy supply to a much larger and significant European region? Certainly, however, Russian President Vladimir Putin doesn’t want the Ukrainian skirmish to blow up out of control. Russia has its own economic problems, and recent U.S. and European sanctions haven’t made Putin’s life any easier. The Russian leader has a vested economic interest to keep its power hungry European customers happy. If not, the U.S.’s new found resurgence in petroleum supplies from fracking will allow our country to happily create jobs and export excess reserves to a newly alienated EU energy buyer.
The Solution

 
Rather than be hostage to the roller coaster ride of rising and falling economic data points, it’s better to follow the sage advice of investing greats like Peter Lynch, who averaged a +29% return per year from 1977 – 1990.
Here’s what he had to say about news consumption:
“If you spend more than 13 minutes analyzing economic and market forecasts, you’ve wasted 10 minutes.”
 
“Far more money has been lost by investors preparing for corrections, or trying to anticipate corrections, than has been lost in corrections themselves.”
Rather than fret about the direction of the market, at Sidoxia Capital Management we are focused on identifying the best available opportunities, given any prevailing economic environment (positive or negative). We assume the market will go nowhere and invest our client assets (and personal assets) accordingly by focusing on those areas we see providing the most attractive risk-adjusted returns. Investors who try to time the market, fail miserably over the long-run. If timing the market were easy, you would see countless people’s names at the tops of the Forbes billionaire list – regrettably that simply is not the case.
Since “fear” sells in the media world, it’s always important to sift through the deluge of data to gain a balanced perspective. During panic periods, it’s important to find the silver linings. When everyone is euphoric, it’s vital to discover reasons for caution.
While a significant amount of geopolitical turmoil occurred last month, it’s essential to remember the underlying positive fundamentals propelling the stock market to record highs. The skeptics of the recovery and record stock market point to the Federal Reserve’s unprecedented, multi-trillion dollar money printing scheme (Quantitative Easing – QE) and the inferior quality of the jobs created. Regarding the former point, if QE has been so disastrous, I ask where is the run-away inflation (see chart below)? While the July jobs report may show some wage pressure, you can see we’re still a long ways away from the elevated pricing levels experienced during the 1970s-1980s.

Source: Calafia Beach Pundit
A final point worth contemplating as it relates to the unparalleled Fed Policy actions was highlighted by strategist Scott Grannis. If achieving real economic growth through money printing was so easy, how come Zimbabwe and Argentina haven’t become economic powerhouses? The naysayers also fail to acknowledge that the Fed has already reversed the majority of its stimulative $85 billion monthly bond buying program (currently at $25 billion per month). What’s more, the Federal Open Market Committee has already signaled a rate hike to 1.13% in 2015 and 2.50% in 2016 (see chart below).

Source: Financial Times
The rise in interest rates from generationally low levels, especially given the current status of our improving economy, as evidenced by the recent robust +4.0% Q2-GDP report, is inevitable. It’s not a matter of “if”, but rather a matter of “when”.
On the latter topic of job quality, previously mentioned, I can’t defend the part-time, underemployed nature of the employment picture, nor can I defend the weak job participation rate. In fact, this economic recovery has been the slowest since World War II. With that said, about 10 million private sector jobs have been added since the end of the Great Recession and the unemployment rate has dropped from 10% to 6.1%. However you choose to look at the situation, more paychecks mean more discretionary dollars in the wallets and purses of U.S. workers. This reality is important because consumer spending accounts for 70% of our country’s economic activity.
While there is a correlation between jobs, interest rates, and the stock market, less obvious to casual observers is the other major factor that drives stock prices…record corporate profits. That’s precisely what you see in the chart below. Not only are trailing earnings at record levels, but forecasted profits are also at record levels. Contrary to all the hyped QE Fed talk, the record profits have been bolstered by important factors such as record manufacturing, record exports, and soaring oil production …not QE.

Join the Club
Those who have been around the investing block a few times realize how challenging investing is. The deafening information noise instantaneously accessed via the internet has only made the endeavor of investing that much more challenging. But the cause is not completely lost. If you want to join the bull market and the SIC (Successful Investors Club), all you need to do is follow the two top secret rules. Creating a plan and sticking to it, while ignoring the mass media should be easy enough, otherwise find an experienced, independent investment advisor like Sidoxia Capital Management to help you join the club.
Wade W. Slome, CFA, CFP®
Plan. Invest. Prosper.
DISCLOSURE: Sidoxia Capital Management (SCM) and some of its clients hold long positions in certain exchange traded funds ans securities, but at the time of publishing SCM had no direct position in any other security referenced in this article. No information accessed through the Investing Caffeine (IC) website constitutes investment, financial, legal, tax or other advice nor is to be relied on in making an investment or other decision. Please read disclosure language on IC Contact page.
NVEC: A Cash Plump Activist Target…For Icahn?

Some might call Carl Icahn a greedy capitalist, but at the core, the 78 year old activist has built his billions in fortunes by unlocking shareholder value in undervalued companies. His targets have come in many shapes and sizes, but one type of target is cash bloated companies without defined capital allocation strategies. A recent high profile example of a cash ballooned target of Icahn was none other than the $591+ billion behemoth Apple Inc. (AAPL).
His initial tweet on August 13, 2013 announced his “large position” in the “extremely undervalued shares” of Apple ($67 split adjusted). We have been long-term shareholders of Apple ourselves and actually beat Carl to the punch three years earlier when the shares were trading at $35 – see Jobs: The Gluttonous Cash Hog. Icahn doesn’t just nonchalantly make outrageous claims…he puts his money where his mouth is. After Icahn’s initial proclamation, he went onto build a substantial $3.6 billion Apple position by January 2014.
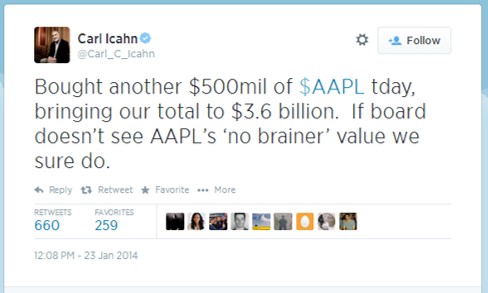
Icahn initially demanded Apple’s CEO Tim Cook to execute a $150 billion share repurchase program before downgrading his proposal to a $50 billion buyback. After receiving continued resistance, Icahn eventually relented in February 2014. But Icahn’s blood, sweat, and tears did not go to waste. His total return in Apple from his initial announcement approximates +50%, in less than one year. And although Icahn wanted more action taken by the company’s management team, Apple has repurchased about $50 billion in stock and paid out $14 billion in dividends to investors over the last five quarters. Despite the significant amount of capital returned to shareholders over the last year, Apple still holds a gargantuan net cash position of $133.5 billion, up approximately $3 billion from the 2013 fiscal third quarter.
Icahn’s Next Cash Plump Target?
Mr. Icahn is continually on the prowl for new targets, and if he played in the small cap stock arena, NVE Corp. (NVEC) certainly holds the characteristics of a cash bloated company without a defined capital allocation strategy. Although I rarely write about my hedge fund stock holdings, followers of my Investing Caffeine blog may recognize the name NVE Corp. More specifically, in 2010 I picked NVEC as my top stock pick of the year (see NVEC: Profiting from Electronic Eyes, Nerves & Brains). The good news is that NVEC outperformed the market by approximately +25% that year (+36% vs 11% for the S&P 500). Over the ensuing years, the performance has been more modest – the +42% return from early 2010 has underperformed the overall stock market.
Rather than rehash my whole prior investment thesis, I would point you to the original article for a summary of NVE’s fundamentals. Suffice it to say, however, that NVE’s prospects are just as positive (if not more so) today as they were five years ago.
Here are some NVE data points that Mr. Icahn may find interesting:
- 60% operating margins (achieved by < 1% of all non-financial companies FINVIZ)
- 0% debt
- 15% EPS growth over the last seven years ($1.00 to $2.29)
- Cutting edge, patent protected, market leading spintronic technology
- +7% Free Cash Flow yield ($13m FCF / $194 adjusted market value) $294m market cap minus $100m cash.
- $100 million in cash on the balance sheet, equal to 34% of the company’s market value ($294m). For comparison purposes to NVE, Apple’s $133 billion in cash currently equates to about 23% of its market cap.
Miserly Management
As I noted in my previous NVE article, my beef with the management team has not been their execution. Despite volatile product sales in recent years, it’s difficult to argue with NVE CEO Dan Baker’s steering of outstanding bottom-line success while at the helm. Over Baker’s tenure, NVE has spearheaded meteoric earnings growth from EPS of $.05 in 2009 to $2.29 in fiscal 2013. Nevertheless, management not only has a fiduciary duty to prudently manage the company’s operations, but it also has a duty to prudently manage the company’s capital allocation strategy, and that is where NVE is falling short. By holding $100 million in cash, NVE is being recklessly conservative.
Is there a reason management is being so stingy with their cash hoard? Even with cash tripling over the last five years ($32m to $100m) and operating margins surpassing an incomprehensibly high threshold (60%), NVE still has managed to open their wallets to pursue these costly actions:
- Double Capacity: NVE doubled their manufacturing capacity in fiscal 2013 with minimal investment ($2.8 million);
- Defend Patents: NVE fought and settled an expensive patent dispute against Motorola spinoff (Everspin) as it related to the company’s promising MRAM technology;
- R&D Expansion: The company shored up its research and development efforts, as evidenced by the +39% increase in fiscal 2014 R&D expenditures, to $3.6 million.
The massive surge in cash after these significant expenditures highlights the indefensible logic behind holding such a large cash mound. How can we put NVE’s pile of cash into perspective? Well for starters, $100 million is enough cash to pay for 110 years of CAPEX (capital expenditures), if you simply took the company’s five year spending average. Currently, the company is adding to the money mountain at a clip of $13,000,000 annually, so the amount of cash will only become more ridiculous over time, if the management team continues to sit on their hands.
To their credit, NVE dipped half of a pinky toe in the capital allocation pool in 2009 with a share repurchase program announcement. Since the share repurchase was approved, the cash on the balance sheet has more than tripled from the then $32 million level. To make matters worse, the authorization was for a meaningless amount of $2.5 million. Over a five year period since the initial announcement, the company has bought an irrelevant 0.5% of shares outstanding (or a mere 25,393 shares).
A Prudent Proposal
The math does not require a Ph.D. in rocket science. With interest rates near a generational low, management is destroying value as inflation eats away at the growing $100 million cash hoard. I believe any CFO, including NVE’s Curt Reynders, can be convinced that earning +7% on NVE shares (or +15% if earnings compound at historical rates for the next five years) is better than earning +2% in the bank. Or in other words, buying back stock by NVE would be massively accretive to EPS growth. Conceptually, if NVE used all $100 million of its cash to buy back stock at current prices, NVE’s current EPS of $2.59 would skyrocket to $3.63 (+40%).
A more reasonable proposal would be for NVE management to buy back 10% of NVE’s stock and simultaneously implement a 2% dividend. At current prices, these actions would still leave a healthy balance of about $75 million in cash on the balance sheet by the end of the fiscal year, which would arguably still leave cash at levels larger than necessary.
Despite the capital allocation miscues, NVE has incredibly bright prospects ahead, and the recently reported quarterly results showing +37% revenue growth and +57% EPS growth is proof positive. As a fellow long-term shareholder, I share management’s vision of a bright future, in which NVE continues to proliferate its unique and patented spintronic technology. With market leadership in nanotechnology sensors, couplers, and MRAM memory, NVE is uniquely positioned to take advantage of game changing growth in markets such as nanotechnology biosensors, electric drive vehicles (EDVs), consumer electronic compassing, and next generation MRAM technology. If NVE can continue to efficiently execute its business plan and couple this with a consistent capital allocation discipline, there’s no reason NVE shares can’t reach $100 per share over the next three to five years.
While NVE continues to execute on their growth vision, they can do themselves and their shareholders a huge favor by implementing a shareholder enhancing capital return plan. Carl Icahn is all smiles now after his successful investments in Apple and Herbalife (HLF), but impatient investors and other like-minded activists may be lurking and frowning, if NVE continues to irresponsibly ignore its swelling $100 million cash hoard.
Wade W. Slome, CFA, CFP®
Plan. Invest. Prosper.
DISCLOSURE: Sidoxia Capital Management (SCM) and some of its clients hold long positions in Apple Inc. (AAPL), NVE Corp. (NVEC), and certain exchange traded funds, but at the time of publishing SCM had no direct position in TWTR, MOT, Everspin, HLF, or any other security referenced in this article. No information accessed through the Investing Caffeine (IC) website constitutes investment, financial, legal, tax or other advice nor is to be relied on in making an investment or other decision. Please read disclosure language on IC Contact page.
Sports & Investing: Why Strong Earnings Can Hurt Stock Prices

With the World Cup in full swing and rabid fans rooting for their home teams, one may notice the many similarities between investing in stocks and handicapping in sports betting. For example, investors (bettors) have opposing views on whether a particular stock (team) will go up or down (win or lose), and determine if the valuation (point spread) is reflective of the proper equilibrium (supply & demand). And just like the stock market, virtually anybody off the street can place a sports bet – assuming one is of legal age and in a legal betting jurisdiction.
Soon investors will be poring over data as part of the critical, quarterly earnings ritual. With some unsteady GDP data as of late, all eyes will be focused on this earnings reporting season to reassure market observers the bull advance can maintain its momentum. However, even positive reports may lead to unexpected investor reactions.
So how and why can market prices go down on good news? There are many reasons that short-term price trends can diverge from short-run fundamentals. One major reason for the price-fundamental gap is this key factor: “expectations”. With such a large run-up in the equity markets (up approx. +195% from March 2009) come loftier expectations for both the economy and individual companies. For instance, just because corporate earnings unveiled from companies like Google (GOOG/GOOGL), J.P. Morgan (JPM), and Intel (INTC) exceed Wall Street analyst forecasts does not mean stock prices automatically go up. In many cases a stock price correction occurs due to a large group of investors who expected even stronger profit results (i.e., “good results, but not good enough”). In sports betting lingo, the sports team may have won the game this week, but they did not win by enough points (“cover the spread”).
Some other reasons stock prices move lower on good news:
- Market Direction: Regardless of the underlying trends, if the market is moving lower, in many instances the market dip can overwhelm any positive, stock- specific factors.
- Profit Taking: Many times investors holding a long position will have price targets or levels, if achieved, that will trigger selling whether positive elements are in place or not.
- Interest Rates: Certain valuation techniques (e.g. Discounted Cash Flow and Dividend Discount Model) integrate interest rates into the value calculation. Therefore, a climb in interest rates has the potential of lowering stock prices – even if the dynamics surrounding a particular security are excellent.
- Quality of Earnings: Sometimes producing winning results is not enough (see also Tricks of the Trade article). On occasion, items such as one-time gains, aggressive revenue recognition, and lower than average tax rates assist a company in getting over a profit hurdle. Investors value quality in addition to quantity.
- Outlook: Even if current period results may be strong, on some occasions a company’s outlook regarding future prospects may be worse than expected. A dark or worsening outlook can pressure security prices.
- Politics & Taxes: These factors may prove especially important to the market this year, since this is a mid-term election year. Political and tax policy changes today may have negative impacts on future profits, thereby impacting stock prices.
- Other Exogenous Items: Natural disasters and security attacks are examples of negative shocks that could damage price values, irrespective of fundamentals.
Certainly these previously mentioned issues do not cover the full gamut of explanations for temporary price-fundamental gaps. Moreover, many of these factors could be used in reverse to explain market price increases in the face of weaker than anticipated results.
If you’re traveling to Las Vegas to place a wager on the World Cup, betting on winning favorites like Germany and Argentina may not be enough. If expectations are not met and the hot team wins by less than the point spread, don’t be surprised to see a decline in the value of your bet.
Wade W. Slome, CFA, CFP®
Plan. Invest. Prosper.
DISCLOSURE: Sidoxia Capital Management (SCM) and some of its clients own certain exchange traded funds, GOOG, and GOOGL, but at the time of publishing had no direct positions in JPM and INTC. No information accessed through the Investing Caffeine (IC) website constitutes investment, financial, legal, tax or other advice nor is to be relied on in making an investment or other decision. Please read disclosure language on IC “Contact” page.
The Only Thing to Fear is the Unknown Itself

Martin Luther King, Jr. famously stated, “The only thing we have to fear is fear itself,” but when it comes to the stock market, the only thing to fear is the “unknown.” As much as people like to say, “I saw that crisis coming,” or “I knew the bubble was going to burst,” the reality is these assertions are often embellished, overstated, and/or misplaced.
How many people saw these events coming?
- 1987 – Black Monday
- Iraqi War
- Thai Baht Currency Crisis
- Long-Term Capital Management Collapse & Bailout
- 9/11 Terrorist Attack
- Lehman Brothers Bankruptcy / Bear Stearns Bailout
- Flash Crash
- U.S. Debt Downgrade
- Arab Spring
- Sequestration Cuts
- Cyprus Financial Crisis
- Federal Reserve (QE1, QE2, QE3, Operation Twist, etc.)
Sure, there will always be a prescient few who may actually get it right and profit from their crystal balls, but to assume you are smart enough to predict these events with any consistent accuracy is likely reckless. Even for the smartest and brightest minds, uncertainty and doubt surrounding such mega-events leads to inaction or paralysis. If profiting in advance of these negative outcomes was so easy, you probably would be basking in the sun on your personal private island…and not reading this article.
Coming to grips with the existence of a never-ending series of future negative financial shocks is the price of doing business in the stock market, if you want to become a successful long-term investor. The fact of the matter is with 7 billion people living on a planet orbiting the sun at 67,000 mph, the law of large numbers tells us there will be many unpredictable events caused either by pure chance or poor human decisions. As the great financial crisis of 2008-2009 proved, there will always be populations of stupid or ignorant people who will purposely or inadvertently cause significant damage to economies around the world.
Fortunately, the power of democracy (see Spreading the Seeds of Democracy) and the benefits of capitalism have dramatically increased the standards of living for hundreds of millions of people. Despite horrific outcomes and unthinkable atrocities perpetrated throughout history, global GDP and living standards continue to positively march forward and upward. For example, consider in my limited lifespan, I have seen the introduction of VCRs, microwave ovens, mobile phones, and the internet, while experiencing amazing milestones like the eradication of smallpox, the sequencing of the human genome, and landing space exploration vehicles on Mars, among many other unimaginable achievements.
Despite amazing advancements, many investors are paralyzed into inaction out of fear of a harmful outcome. If I received a penny for every negative prediction I read or heard about over my 20+ years of investing, I would be happily retired. The stock market is never immune from adverse events, but chances are a geopolitical war in Ukraine/Iraq; accelerated Federal Reserve rate tightening; China real estate bubble; Argentinian debt default; or other current, worrisome headline is unlikely to be the cause of the next -20%+ bear market. History shows us that fear of the unknown is more rational than the fear of the known. If you can’t come to grips with fear itself, I fear your long-term results will lead to a scary retirement.
Wade W. Slome, CFA, CFP®
Plan. Invest. Prosper.
DISCLOSURE: Sidoxia Capital Management (SCM) and some of its clients hold long positions in certain exchange traded funds, but at the time of publishing SCM had no direct position in any other security referenced in this article. No information accessed through the Investing Caffeine (IC) website constitutes investment, financial, legal, tax or other advice nor is to be relied on in making an investment or other decision. Please read disclosure language on IC Contact page.
Stocks Winning vs. Weak Competitors

This article is an excerpt from a previously released Sidoxia Capital Management complementary newsletter (June 2, 2014). Subscribe on the right side of the page for the complete text.
Winning at any sport is lot easier if you can compete without an opponent. Imagine an NBA basketball MVP LeBron James driving to the basket against no defender, or versus a weakling opponent like a 44-year-old investment manager. Under these circumstances, it would be pretty easy for James and his team, the Miami Heat, to victoriously dominate without even a trace of sweat.
Effectively, stocks have enjoyed similar domination in recent years, while steamrolling over the bond competition. To put the stock market’s winning streak into perspective, the S&P 500 index set a new all-time record high in May, with the S&P 500 advancing +2.1% to 1924 for the month, bringing the 2013-2014 total return to about +38%. Not too shabby results over 17 months, if you consider bank deposits and CDs are paying a paltry 0.0-1.0% annually, and investors are gobbling up bonds yielding a measly 2.5% (see chart below).
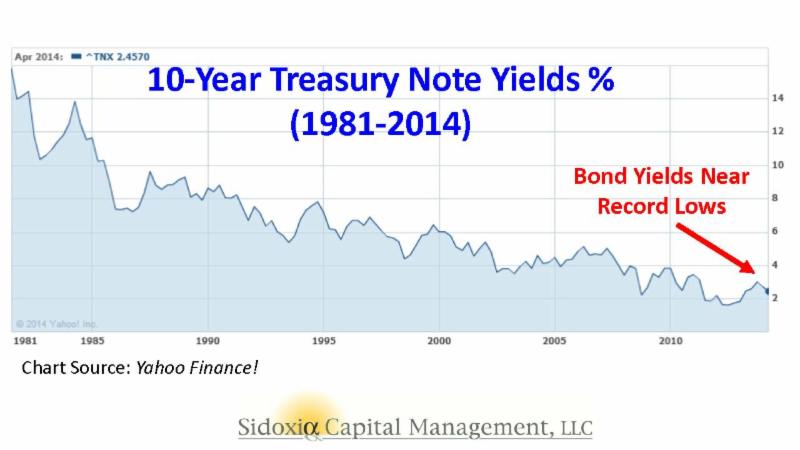
The point, once again, is that even if you are a skeptic or bear on the outlook for stocks, the stock market still offers the most attractive opportunities relative to other asset classes and investment options, including bonds. It’s true, the low hanging fruit in stocks has been picked, and portfolios can become too equity-heavy, but even retirees should have some exposure to equities.
As I wrote last month in Buy in May and Dance Away, why would investors voluntarily lock in inadequate yields at generational lows when the earnings yield on stocks are so much more appealing. The approximate P/E (Price-Earnings) ratio for the S&P 500 currently averages approximately +6.2% with a rising dividend yield of about +1.8% – not much lower than many bonds. Over the last five years, those investors willing to part ways with yield-less cash have voted aggressively with their wallets. Those with confidence in the equity markets have benefited massively from the approximate +200% gains garnered from the March 2009 S&P 500 index lows.
For the many who have painfully missed the mother of all stock rallies, the fallback response has been, “Well, sure the market has tripled, but it’s only because of unprecedented printing of money at the QE (Quantitative Easing) printing presses!” This argument has become increasingly difficult to defend ever since the Federal Reserve announced the initiation of the reduction in bond buying (a.k.a., “tapering”) six months ago (December 18th). Over that time period, the Dow Jones Industrial Average has increased over 800 points and the S&P 500 index has risen a healthy 8.0%.
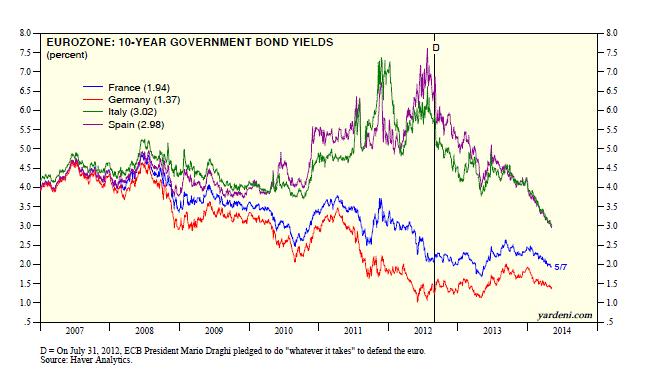
As much as everyone would like to blame (give credit to) the Fed for the bull market, the fact is the Federal Reserve doesn’t control the world’s interest rates. Sure, the Fed has an influence on global interest rates, but countries like Japan may have something to do with their own 0.57% 10-year government bond yield. For example, the economic/political policies and demographics in play might be impacting Japan’s stock market (Nikkei), which has plummeted about -62% over the last 25 years (about 39,000 to 15,000). Almost as shocking as the lowly rates in Japan and the U.S. and Japan, are the astonishingly low interest rates in Europe. As the chart below shows, France and Germany have sub-2% 10-year government bond yields (1.76% and 1.36%, respectively) and even economic basket case countries like Italy and Spain have seen their yields pierce below the 3% level.
 Source: Dr. Ed’s Blog
Suffice it to say, yield is not only difficult to find on our shores, but it is also challenging to find winning bond returns globally.
Well if low interest rates and the Federal Reserve aren’t the only reasons for a skyrocketing stock market, then how come this juggernaut performance has such long legs? The largest reason in my mind boils down to two words…record profits. Readers of mine know I follow the basic tenet that stock prices follow earnings over the long-term. Interest rates and Fed Policy will provide headwinds and tailwinds over different timeframes, but ultimately the almighty direction of profits determines long-run stock performance. You don’t have to be a brain surgeon or rocket scientist to appreciate this correlation. Scott Grannis (Calafia Beach Pundit) has beautifully documented this relationship in the chart below.
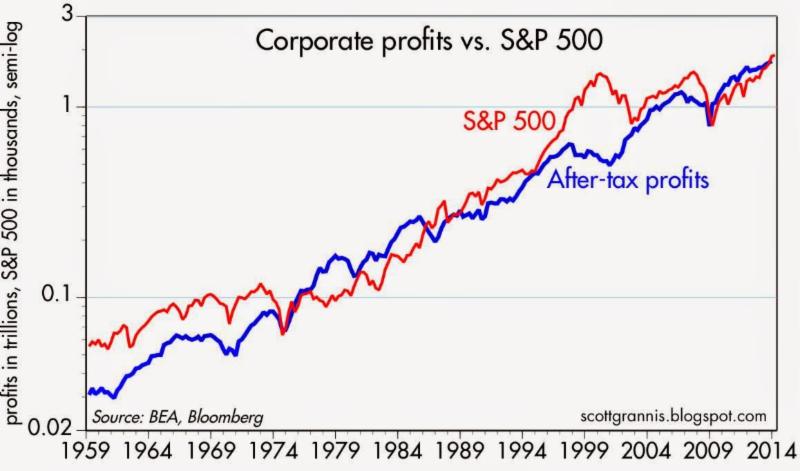
Supporting this concept, profits help support numerous value-enhancing shareholder activities we have seen on the rise over the last five years, which include rising dividends, share buybacks, and M&A (Mergers & Acquisitions) activity. Eventually the business cycle will run its course, and during the next recession, profits and stock prices will be expected to decline. A final contributing factor to the duration of this bull market is the abysmally slow pace of this economic recovery, which if measured in job creation terms has been the slowest since World War II. Said differently, the slower a recovery develops, the longer the recovery will last. Bill McBride at Calculated Risk captured this theme in the following chart:
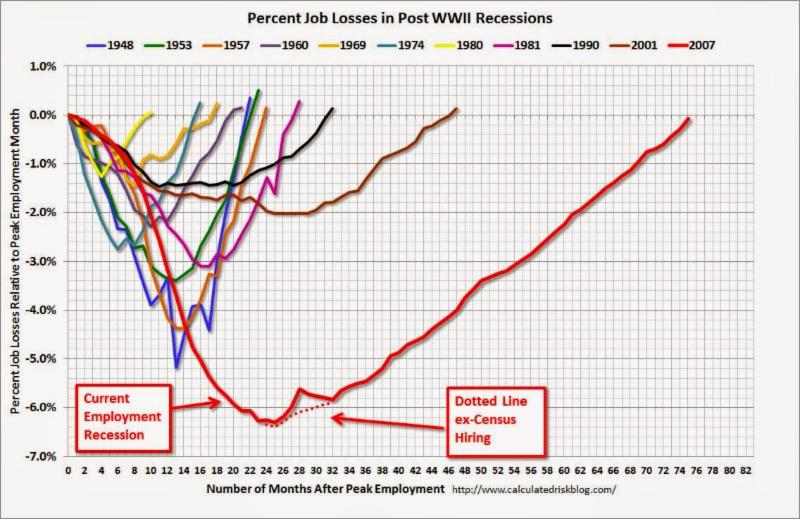
Despite the massive gains and new records set, skeptics abound as evidenced by the nearly -$10 billion of withdrawn money out of U.S. stock funds over the last month (most recent data).
I’ve been labeled a perma-bull by some, but over my 20+ years of investing experience I understand the importance of defensive positioning along with the benefits of shorting expensive, leveraged stocks during bear markets, like the ones in 2000-2001 and 2008-2009. When will I reverse my views and become bearish (negative) on stocks? Here are a few factors I’m tracking:
- Inverted Yield Curve: This was a good precursor to the 2008-2009 crash, but there are no signs of this occurring yet.
- Overheated Fund Inflows: When everyone piles into stocks, I get nervous. In the last four weeks of domestic ICI fund flow data, we have seen the opposite…about -$9.5 billion outflows from stock funds.
- Peak Employment: When things can’t get much better is the time to become more worried. There is still plenty of room for improvement, especially if you consider the stunningly low employment participation rate.
- Fed Tightening / Rising Bond Yields: The Fed has made it clear, it will be a while before this will occur.
- When Housing Approaches Record Levels: Although Case-Shiller data has shown housing prices bouncing from the bottom, it’s clear that new home sales have stalled and have plenty of head room to go higher.
- Financial Crisis: Chances of experiencing another financial crisis of a generation is slim, but many people have fresh nightmares from the 2008-2009 financial crisis. It’s not every day that a 158 year-old institution (Lehman Brothers) or 85 year-old investment bank (Bear Stearns) disappear, but if the dominoes start falling again, then I guess it’s OK to become anxious again.
- Better Opportunities: The beauty about my practice at Sidoxia is that we can invest anywhere. So if we find more attractive opportunities in emerging market debt, convertible bonds, floating rate notes, private equity, or other asset classes, we have no allegiances and will sell stocks.
Every recession and bear market is different, and although the skies may be blue in the stock market now, clouds and gray skies are never too far away. Even with record prices, many fears remain, including the following:
- Ukraine: There is always geopolitical instability somewhere on the globe. In the past investors were worried about Egypt, Iran, and Syria, but for now, some uncertainty has been created around Ukraine.
- Weak GDP: Gross Domestic Product was revised lower to -1% during the first quarter, in large part due to an abnormally cold winter in many parts of the country. However, many economists are already talking about the possibility of a 3%+ rebound in the second quarter as weather improves.
- Low Volatility: The so-called “Fear Gauge” is near record low levels (VIX index), implying a reckless complacency among investors. While this is a measure I track, it is more confined to speculative traders compared to retail investors. In other words, my grandma isn’t buying put option insurance on the Nasdaq 100 index to protect her portfolio against the ramifications of the Thailand government military coup.
- Inflation/Deflation: Regardless of whether stocks are near a record top or bottom, financial media outlets in need of a topic can always fall back on the fear of inflation or deflation. Currently inflation remains in check. The Fed’s primary measure of inflation, the Core PCE, recently inched up +0.2% month-to-month, in line with forecasts.
- Fed Policy: When are investors not worried about the Federal Reserve’s next step? Like inflation, we’ll be hearing about this concern until we permanently enter our grave.
In the sport of stocks and investing, winning is never easy. However, with the global trend of declining interest rates and the scarcity of yields from bonds and other safe investments (cash/money market/CDs), it should come as no surprise to anyone that the winning streak in stocks is tied to the lack of competing investment alternatives. Based on the current dynamics in the market, if LeBron James is a stock, and I’m forced to guard him as a 10-year Treasury bond, I think I’ll just throw in the towel and go to Wall Street. At least that way my long-term portfolio has a chance of winning by placing a portion of my bets on stocks over bonds.
Wade W. Slome, CFA, CFP®
Plan. Invest. Prosper.
DISCLOSURE: Sidoxia Capital Management (SCM) and some of its clients hold positions in certain exchange traded funds (ETFs), but at the time of publishing SCM had no direct position in any other security referenced in this article. No information accessed through the Investing Caffeine (IC) website constitutes investment, financial, legal, tax or other advice nor is to be relied on in making an investment or other decision. Please read disclosure language on IC Contact page.
Hunting for Tennis Balls and Dead Cats

When it comes to gravity, people understand what goes up, must come down. But the reverse is not always true for stocks. What goes down, does not necessarily need to come back up. Since the 2008-09 financial crisis there have been a large group of multi-billion dollar behemoth stocks that have defied gravity, but over the last few months, many of these highfliers have come back to earth. Despite the pause in some of these major technology, consumer, and internet stocks, the overall stock market appears relatively calm. In fact, the Dow Jones Industrials index is currently sitting at all-time record highs and the S&P 500 index is hovering around -1% from its peak. But below the surface, there is a large undercurrent resulting in an enormous rotation out of pricier momentum and growth stocks into more defensive and yield-heavy sectors of the market, like utilities and real estate.
To expose this concealed trend I have highlighted a group of 20 stocks below, valued at close to half a trillion dollars. Over the last 12 months, this selective group of technology, consumer, and internet stocks have lost over -$200,000,000,000 from their peak values. Here’s a look at the highlighted stocks:
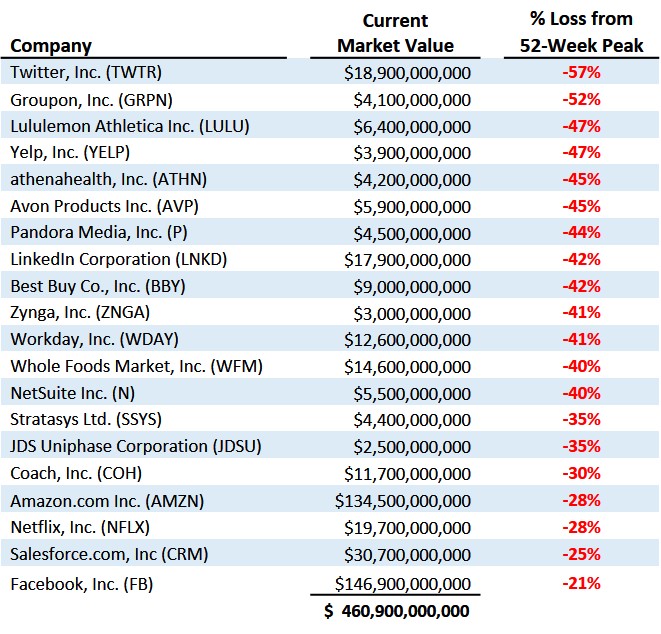
With respect to all the punished stocks, the dilemma for investors amidst this depreciating price carnage is how to profitably hunt for the bouncing tennis balls while avoiding the dead cat bounces. By hunting bouncing tennis balls, I am referring to the identification of those companies that have crashed from indiscriminate selling, even though the companies’ positive business fundamentals remain fully intact. The so-called dead cats reflect those overpriced companies that lack the earnings power or trajectory to support a rebounding stock price. Like a cat falling from a high-rise building, there may exist a possibility of a small rebound, but for many severely broken momentum stocks, minor bounces are often short-lived.
For long-term investors, much of the recent rotation is healthy. Some of the froth I’ve been writing about in the biotech, internet, and technology has been mitigated. As a result, in many instances, outrageous or rich stock valuations have now become fairly priced or attractive.
Profiting from Collapses
Many investors do not realize that some of the greatest stocks of all-time have suffered multiple -50% drops before subsequently doubling, tripling, quadrupling or better. History provides many rebounding tennis ball examples, but let’s take a brief look at the Apple Inc. (AAPL) chart from 1980 – 2005 to drive home the point:
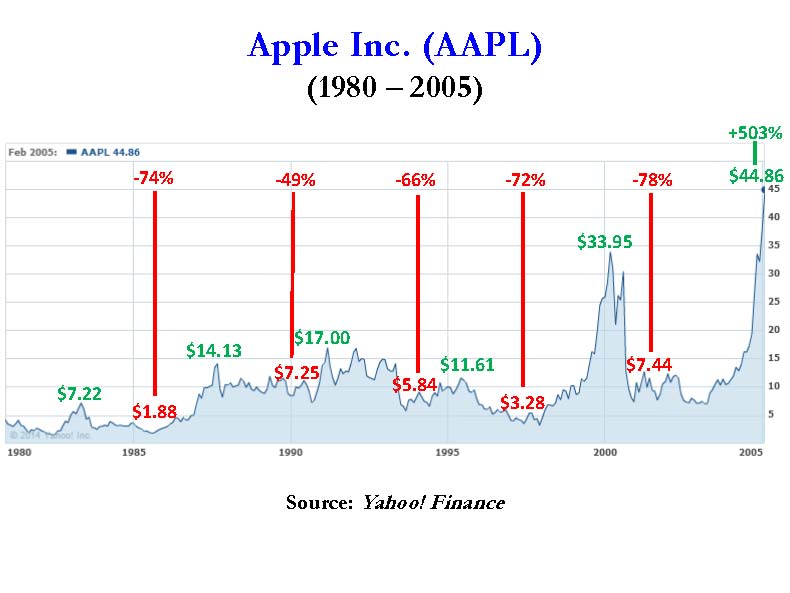
As you can see, there were at least five occasions when the stock got chopped in half (or worse) over the selected timeframe and another five occasions when the stock doubled (or better), including a +935% explosion in the 1997–2000 period, and a +503% advance from 2002–2005 when shares reached $45. The numbers get kookier when you consider Apple’s share price eventually reached $700 and closed early last week above $600.
These feast and famine patterns can be discovered for virtually all of the greatest all-time stocks. The massive volatility explains why it’s so difficult to stick with theses long-term winners. A more recent example of a tennis ball bounce would be Facebook Inc (FB). The -58% % plummet from its $42 IPO peak has been well-documented, and despite the more recent -21% pullback, the stock is still up +223% from its $18 lows.
On the flip side, an example of a dead cat bounce would include Cisco Systems Inc (CSCO). After the bursting of the 2000 technology bubble, Cisco has never fully recovered from its $82 peak value. There have been many fits and starts, including some periods of 50% declines and 100% gains, but due to excessive valuations in the late 1990s and changing competitive trends, Cisco still sits at $23 today (see chart below).
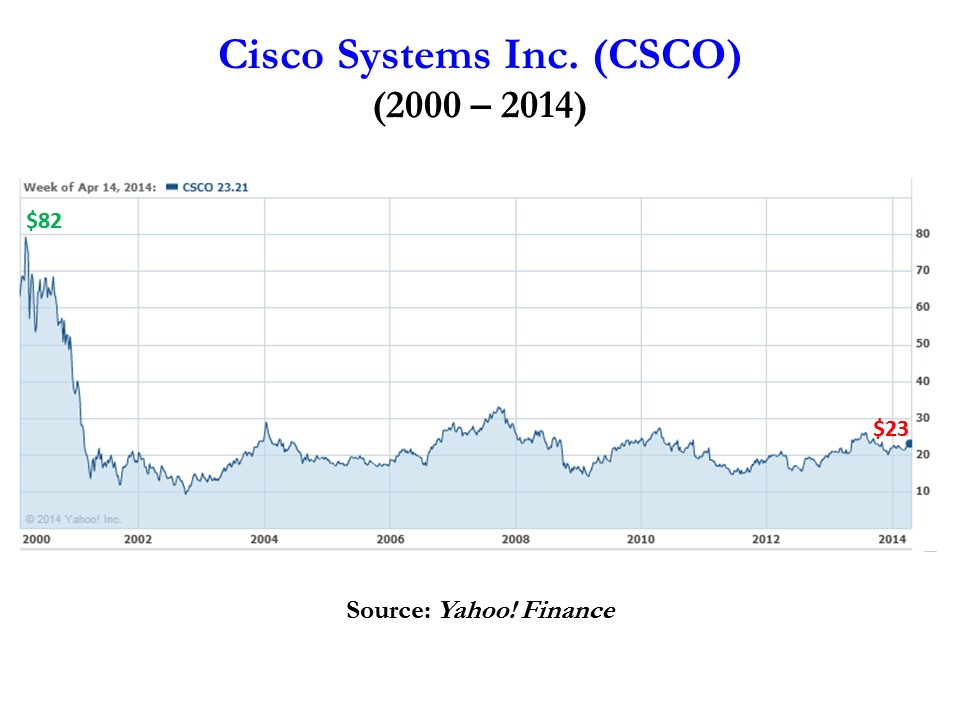
It is important to remember that just because a stock goes down -50% in value doesn’t mean that it’s going to double or triple in value in the future. Price momentum can drive a stock in the short run, but in the long run, the important variables to track closely are cash flows and earnings (see It’s the Earnings, Stupid) . The level and direction of these factors ultimately correlate best with the ultimate fair value of stock prices. Therefore, if you are fishing in the growth or momentum stock pond, make sure to do your homework after a stock price collapses. It’s imperative that you carefully hunt down rebounding tennis balls and avoid the dead cat bounces.
Wade W. Slome, CFA, CFP®
Plan. Invest. Prosper.
DISCLOSURE: Sidoxia Capital Management (SCM) and some of its clients hold long positions in certain exchange traded funds (ETFs), AMZN, long NFLX bond, short NFLX stock, short LULU, and long CSCO (in a non-discretionary account), but at the time of publishing SCM had no direct position in TWTR, GRPN, YELP, ATHN, AVP, P, LNKD, BBY, ZNGA, WDAY, WFM, N, SSYS, JDSU, COH, CRM, FB or any other security referenced in this article. No information accessed through the Investing Caffeine (IC) website constitutes investment, financial, legal, tax or other advice nor is to be relied on in making an investment or other decision. Please read disclosure language on IC Contact page.
Buy in May and Tap Dance Away

This article is an excerpt from a previously released Sidoxia Capital Management complementary newsletter (May 1, 2014). Subscribe on the right side of the page for the complete text.
The proverbial Wall Street adage that urges investors to “Sell in May, and go away” in order to avoid a seasonally volatile period from May to October has driven speculative trading strategies for generations. The basic premise behind the plan revolves around the idea that people have better things to do during the spring and summer months, so they sell stocks. Once the weather cools off, the thought process reverses as investors renew their interest in stocks during November. If investing was as easy as selling stocks on May 1 st and then buying them back on November 1st, then we could all caravan in yachts to our private islands while drinking from umbrella-filled coconut drinks. Regrettably, successful investing is not that simple and following naïve strategies like these generally don’t work over the long-run.
Even if you believe in market timing and seasonal investing (see Getting Off the Market Timing Treadmill ), the prohibitive transaction costs and tax implications often strip away any potential statistical advantage.
Unfortunately for the bears, who often react to this type of voodoo investing, betting against the stock market from May – October during the last two years has been a money-losing strategy. Rather than going away, investors have been better served to “Buy in May, and tap dance away.” More specifically, the S&P 500 index has increased in each of the last two years, including a +10% surge during the May-October period last year.
Nervous? Why Invest Now?
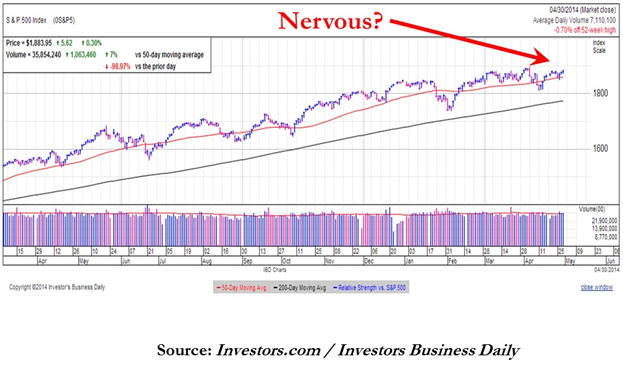
With the weak recent economic GDP figures and stock prices off by less than 1% from their all-time record highs, why in the world would investors consider investing now? Well, for starters, one must ask themselves, “What options do I have for my savings…cash?” Cash has been and will continue to be a poor place to hoard funds, especially when interest rates are near historic lows and inflation is eating away the value of your nest-egg like a hungry sumo wrestler. Anyone who has completed their income taxes last month knows how pathetic bank rates have been, and if you have pumped gas recently, you can appreciate the gnawing impact of escalating gasoline prices.
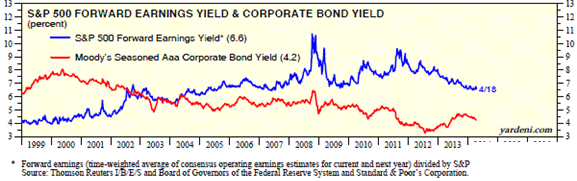
While there are selective opportunities to garner attractive yields in the bond market, as exploited in Sidoxia Fusion strategies, strategist and economist Dr. Ed Yardeni points out that equities have approximately +50% higher yields than corporate bonds. As you can see from the chart below, stocks (blue line) are yielding profits of about +6.6% vs +4.2% for corporate bonds (red line). In other words, for every $100 invested in stocks, companies are earning $6.60 in profits on average, which are then either paid out to investors as growing dividends and/or reinvested back into their companies for future growth.
Source: Dr. Ed’s Blog
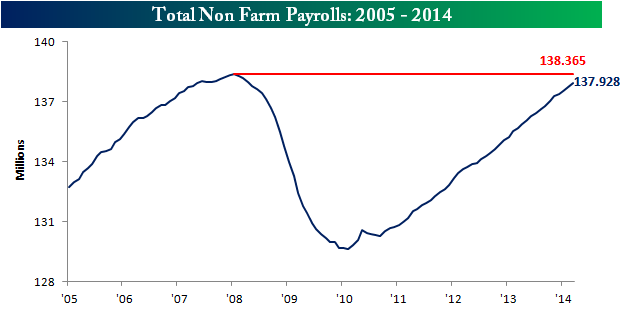
Hefty profit streams have resulted in healthy corporate balance sheets, which have served as ammunition for the improving jobs picture. At best, the economic recovery has moved from a snail’s pace to a tortoise’s pace, but nevertheless, the unemployment rate has returned to a more respectable 6.7% rate. The mended economy has virtually recovered all of the approximately 9 million private jobs lost during the financial crisis (see chart below) and expectations for Friday’s jobs report is for another +220,000 jobs added during the month of April.
Source: Bespoke
Wondrous Wing Woman
Investing can be scary for some individuals, but having an accommodative Fed Chair like Janet Yellen on your side makes the challenge more manageable. As I’ve pointed out in the past (with the help of Scott Grannis), the Fed’s stimulative ‘Quantitative Easing’ program counter intuitively raised interest rates during its implementation. What’s more, Yellen’s spearheading of the unprecedented $40 billion bond buying reduction program (a.k.a., ‘Taper’) has unexpectedly led to declining interest rates in recent months. If all goes well, Yellen will have completed the $85 billion monthly tapering by the end of this year, assuming the economy continues to expand.
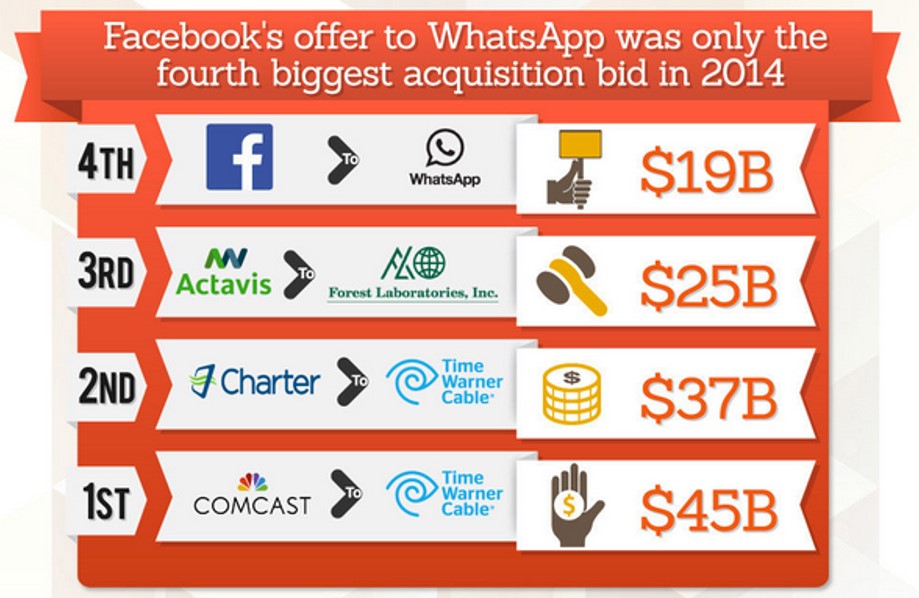
In the meantime, investors and the broader financial markets have begun to digest the unwinding of the largest, most unprecedented monetary intervention in financial history. How can we tell this is the case? CEO confidence has improved to the point that $1 trillion of deals have been announced this year, including offers by Pfizer Inc. – PFE ($100 billion), Facebook Inc. – FB ($19 billion), and Comcast Corp. – CMCSA ($45 billion).
Source: Entrepreneur
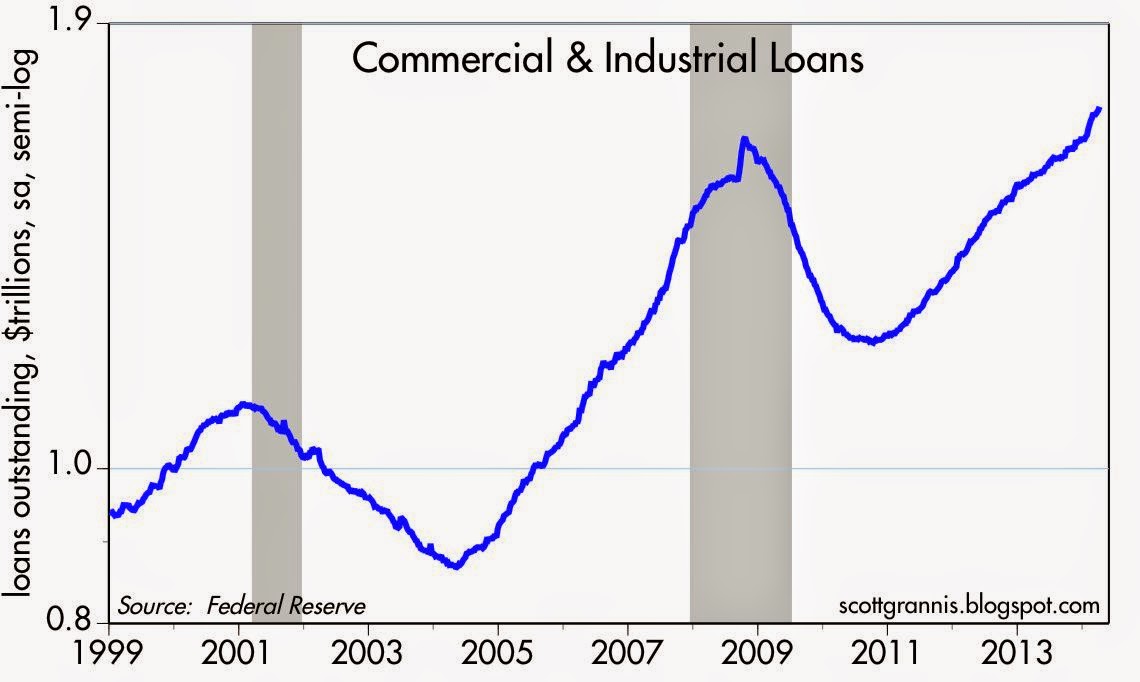
Banks are feeling more confident too, and this is evident by the acceleration seen in bank loans. After the financial crisis, gun-shy bank CEOs fortified their balance sheets, but with five years of economic expansion under their belts, the banks are beginning to loosen their loan purse strings further (see chart below).
The coast is never completely clear. As always, there are plenty of things to worry about. If it’s not Ukraine, it can be slowing growth in China, mid-term elections in the fall, and/or rising tensions in the Middle East. However, for the vast majority of investors, relying on calendar adages (i.e., selling in May) is a complete waste of time. You will be much better off investing in attractively priced, long-term opportunities, and then tap dance your way to financial prosperity.
Wade W. Slome, CFA, CFP®
Plan. Invest. Prosper.
DISCLOSURE: Sidoxia Capital Management (SCM) and some of its clients hold positions in PFE, CMCSA, and certain exchange traded funds (ETFs), but at the time of publishing SCM had no direct position in FB or any other security referenced in this article. No information accessed through the Investing Caffeine (IC) website constitutes investment, financial, legal, tax or other advice nor is to be relied on in making an investment or other decision. Please read disclosure language on IC Contact page.
You Can’t Kiss Every Pretty Girl (…or Handsome Boy)

There are a lot of pretty girls in the world, and there are a lot of sexy stocks in the stock market, but not even the most eligible bachelor (or bachelorettes) are able to kiss all the beautiful people in the world. The same principle applies to the stock market. The most successful investors have a disciplined process of waiting for the perfect mate to cross their path, rather than chasing every tempting mistress.
Happily married to my current portfolio, I continually bump into attractive candidates that try to seduce me into buying. For me, these sexy equities typically come in the shape of high P/E ratios (Price/Earnings) and rapid sales growth rates. It’s fun to date (or rent) these sexy stocks, but the novelty often wears off quickly and the euphoric sensation can disappear rapidly – just like real-world dating. Case in point is the reality dating shows, the Bachelor and Bachelorette. Over 27 combined seasons, of which I sheepishly admit seeing a few, only five of the couples remain together today. While it may be enjoyable to vicariously watch bevies of beautiful people hook-up, the harsh reality is that the success rate is abysmal, similar to the results in chasing darling stocks (see also Riding the Wave).
Well-known strategist and investor Barton Biggs once said, “A bull market is like sex. It feels best just before it ends.” The same goes with chasing pricey momentum stocks – what looks pretty in the short-run can turn ugly in a blink of the eye. For example, if you purchased the following basket of top 10 performing stocks of 2012 (+118% average return excluding dividends), you would have underperformed the market by -16% if you owned until today.

Warren Buffett understands hunting for short-term relationships may be thrilling, but this strategy often leads to tears and heartbreak. Buffett summarized the importance of selectivity here:
“I could improve your ultimate financial welfare by giving you a ticket with only twenty slots in it so that you had twenty punches – representing all the investments that you got to make in a lifetime. And once you’d punched through the card, you couldn’t make any more investments at all. Under those rules, you’d really think carefully about what you did, and you’d be forced to load up on what you’d really thought about. So you’d do so much better.”
Rather than hungering for the spiciest stocks, it’s best to find a beauty before she becomes Miss America, because at that point, everybody wants to date her and the price is usually way too expensive. If you stay selective and patient while realizing you can’t kiss every pretty girl, then you can prevent the stock market from breaking your heart.
Wade W. Slome, CFA, CFP®
Plan. Invest. Prosper.
DISCLOSURE: Sidoxia Capital Management (SCM) and some of its clients hold long positions in certain exchange traded funds (ETFs), but at the time of publishing SCM had no direct position in PHM, MHO, CVI, EXPE, HFS, DDS, LEN, MPC. TSO, GPS, BRKA/B, or any other security referenced in this article. No information accessed through the Investing Caffeine (IC) website constitutes investment, financial, legal, tax or other advice nor is to be relied on in making an investment or other decision. Please read disclosure language on IC Contact page.
Passive vs. Active Investing: Darts, Monkeys & Pros

Bob Turner is founder of Turner Investments and a manager of several funds at the investment company. In a recent article he reintroduces the all-important, longstanding debate of active management (“hands-on”) versus passive management (“hands off”) approaches to investing. Mr. Turner makes some good arguments for the active management camp, however some feel differently – take for example Burton Malkiel. The Princeton professor theorizes in his book A Random Walk Down Wall Street that “a blindfolded monkey throwing darts at a newspaper’s stock page could select a portfolio that would do just as well as one carefully selected by experts.” In fact, The Wall Street Journal manages an Investment Dartboard contest that stacks up amateur investors’ picks against the pros’ and random stock picks selected by randomly thrown darts. In many instances, the dartboard picks outperform the professionals. Given the controversy, who’s right…the darts, monkeys, or pros? Distinguishing between the different categorizations can be difficult, but we will take a stab nevertheless.
Arguments for Active Management
Turner contends, active management outperforms in periods of high volatility and he believes the industry will be entering such a phase:
“Active managers historically have tended to perform best in a market in which the performance of individual stocks varies widely.”
He also acknowledges that not all active managers outperform and admits there are periods where passive management will do better:
“The reason why most active investors fail to outperform is because they in fact constitute most of the market. Even in the best of times, not all active managers can hope to outperform…The business of picking stocks is to some degree a zero-sum game; the results achieved by the best managers will be offset at least somewhat by the subpar performance of other managers.”
Buttressing his argument for active management, Turner references data from Advisor Perspectives showing an inconclusive percentage (40.5%-67.8%) of the actively managed funds trailing the passively managed indexes from 2000 to 2008.
The Case for Passive Management
Turner cites one specific study to support his active management cause. However, my experience gleaned from the vast amounts of academic and industry data point to approximately 75% of active managers underperforming their passively managed indexes, over longer periods of time. Notably, a recent study conducted by Standard & Poor’s SPIVA division (S&P Indices Versus Active Funds) discovered the following conclusions over the five year market cycle from 2004 to 2008:
- S&P 500 outperformed 71.9% of actively managed large cap funds;
- S&P MidCap 400 outperformed 79.1% of mid cap funds;
- S&P SmallCap 600 outperformed 85.5% of small cap funds.
Read more about the dirty secrets shrinking your portfolio. According to the Vanguard Group and the Investment Company Institute, about 25% of institutional assets and about 12% of individual investors’ assets are currently indexed (passive strategies). If you doubt the popularity of passive investment strategies, then look no further than the growth of Exchange Traded Funds (ETFs – see chart), index funds, or Vanguard Groups more than $1 trillion dollars in assets under management.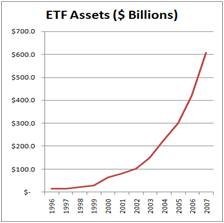
Although I am a firm believer in passive investing, one of its shortcomings is mean reversion. This is the idea that upward or downward moving trends tend to revert back to an average or normal level over time. Active investing can take advantage of mean reversion, conversely passive investing cannot. Indexes can get very top-heavy in weightings of outperforming sectors or industries, meaning theoretically you could be buying larger and larger shares of an index in overpriced glamour stocks on the verge of collapse. We experienced these lopsided index weightings through the technology bubbles in the late 1990s and financials in 2008. Some strategies may be better than other over the long run, but every strategy, even passive investing, has its own unique set of deficiencies and risks.
Professional Sports and Investing
As I discuss in my book, there are similarities that can be drawn between professional sports and investing with respect to active vs. passive management. Like the scarce number of .300 hitters in baseball, I believe there are a select few investment managers who can consistently outperform the market. In 2007, AssociatedContent.com did a study that showed there were only 22 active career .300 hitters in Major League Baseball. I recognize in the investing world there can be a larger role for “luck,” which is difficult, if not impossible, to measure (luck won’t help me much in hitting a 100 mile per hour fastball thrown by Nolan Ryan). Nonetheless, in the professional sports arena, there are some Hall of Famers (prospects) that have proved they could (can) consistently outperform their peers for extended durations of time. Experience is another distinction I would highlight in comparing sports and investing. Unlike sports, in the investment world I believe there is a positive correlation between age and ability. The more experience an investor gains, generally the better long-term return achieved. Like many professions, the more experience you gain, the more valuable you become. Unfortunately, in many sports, ability deteriorates and muscles atrophy over time.
Size Matters
Experience alone will not make you a better investor. Some investors are born with an innate gift or intellect that propels them ahead of the pack. However, most great investors eventually get cursed by their own success thanks to accumulating assets. Warren Buffet knows the consequences of managing large amounts of dollars, “gravity always wins.” Having managed a $20 billion fund, I fully appreciate the challenges of investing larger sums of money. Managing a smaller fund is similar to navigating a speed boat – not too difficult to maneuver and fairly easy to dodge obstacles. Managing heftier pools of money can be like captaining a supertanker, but unfortunately the same rapid u-turn expectations of the speedboat remain. Managing large amounts of capital can be crippling, and that’s why captaining a supertanker requires the proper foresight and experience.
Room for All
As I’ve stated before, I believe the market is efficient in the long run, but can be terribly inefficient in the short-run, especially when the behavioral aspects of emotion (fear and greed) take over. The “wait for me, I want to play too” greed from the late 1990s technology craze and the credit-based economic collapse of 2008-2009 are further examples of inefficient situations that can be exploited by active managers. However, due to multiple fees, transaction costs, taxes, not to mention the short-term performance/compensation pressures to perform, I believe the odds are stacked against the active managers. For those experienced managers that have played the game for a long period and have a track record of success, I feel active management can play a role. At Sidoxia Capital Management, I choose to create investment portfolios that blend a mixture of passive and active investment strategies. Although my hedge fund has outperformed the S&P 500 in 4 of the last 5 years, that fact does not necessarily mean it’s the appropriate sole approach for all clients. As Warren Buffet states, investors should stick to their “circle of competence” so they can confidently invest in what they know. That’s why I generally stick to the areas of my expertise when I’m actively investing in stocks, and fill in the remainder of client portfolios with transparent, low-cost, tax-efficient equity and fixed income products (i.e., Exchange Traded Funds). Even though the actively managed Turner Funds appear to have a mixed-bag of performance numbers relative to passively managed strategies, I appreciate Bob Turner’s article for addressing this important issue. I’m sure the debate will never fully be resolved. In the meantime, my client portfolios will aim to mix the best of both worlds within active and passive management strategies in the eternal quest of outwitting the darts, monkeys, and other pros.
Read the full Bob Turner article on Morningstar.com
Wade W. Slome, CFA, CFP®
Plan. Invest. Prosper.
DISCLOSURE: Sidoxia Capital Management (SCM) and some of its clients own certain exchange traded funds but had no direct position in stocks mentioned in this article. No information accessed through the Investing Caffeine (IC) website constitutes investment, financial, legal, tax or other advice nor is to be relied on in making an investment or other decision. Please read disclosure language on IC “Contact” page.