Posts filed under ‘Education’
Forecasting Recipe: Trend Analysis & Sustainability

Forecasting financial performance of a company requires a fairly simple recipe: one part trend analysis and one part determining sustainability. On the surface, forecasting sounds pretty easy. While discovering certain financial trends can be straightforward, the ability to ascertain the durability of a trend can become endlessly complex.
Before you become Nostradamus and spreadsheet your way to the Wall Street Hall of Fame, an accurate forecaster must first build a firm understanding of a company and the underlying industry. Unfortunately for the predictor, not all companies and industries are created equally. Evaluating the profit dynamics of Cheesecake Factory Inc. (CAKE), an upscale casual chain of restaurants, is quite different from deciphering the financials of 3SBio (SSRX), a Chinese biotech company focused on recombinant products. Regardless of the thorniness of the company or industry, before you can truly look out into the future, the investor should learn the language of the company. For example, learning the importance of “comparable store sales” and “sales per square foot” for CAKE may be just as important as learning about the “Phase III FDA trial endpoint” and “pipeline” for SSRX.
Because you could spend a lifetime following just one company – for instance General Electric Co. (GE) or Microsoft Corp. (MSFT) – and never make an investment, you would probably be better served by applying a framework that allows you to research and analyze multiple industries and companies. There are various tools, whether you consider Harvard professor Michael Porter’s Five Forces or SWOT analysis (Strengths Weaknesses Opportunities Threats), and each provides a template or process to use when tearing apart specific companies and industries.
Nuts & Bolts of Forecasting
Before you can identify a trend, you first need to gather the data. For all companies I examine, I first compile a quarterly and annual income statement, balance sheet, and cash flow statement – those that have followed me know the extreme importance I place on the cash flows of a business. In general a good start is to create common size financial statements for the income statement and balance sheet. Basically, this exercise creates an income statement and balance sheet in percentage terms – usually expressed as a percentage of net sales (income statement) and as a percentage of total assets (balance sheet). Earnings forecasts are often used as a logical starting point for driving the shape of future results across the financials, but further insight can be gleaned by comparing year-over-year (this year vs. last) and sequential (this quarter vs. last quarter) growth rates for key figures.
These common statements will then serve as the foundation of identifying the trends, and force the forecaster to seek answers to random questions like these?
- Why is depreciation expense going down even though the company is expanding retail stores?
- Gross margins increased for seven consecutive quarters for a total of 250 basis points (2.5%), however in the recent quarter margins declined by 175 basis points…why?
- Long-term debt increased by $200 million in the current quarter, but if the company just issued $325 million in equity last quarter, then why do they need new capital?
Many of these types of questions may have logical explanations, but by getting answers the analyst will be in a position to better understand the business issues affecting financial performance and to better forecast future economic values.
Forecasting Your Way to Wrongness
A lot can go wrong with forecasting, principally in the assumptions used for the forecast. As the character Felix Unger from the Odd Couple stated, “You should never “assume.” You see, when you “assume,” you make an “ass”… out of “you”… and “me.”” Often assumptions do not consider the inclusion of important economic shocks or unexpected factors, such as recessions, currency fluctuations, management turnover, lawsuits, accounting changes, new products, restructurings, acquisitions, divestitures, flash crashes, Greek debt downgrades, regulatory reform…yada…yada…yada (you get the idea). To get a better sense for a range of outcomes, sensitivity analysis can be employed to determine a “base case” outcome in conjunction with a rosier “upside case” and more conservative “downside case.” Worth noting is the impact debt levels can have on the variance of outcomes – I think Bear Stearns and Lehman Brothers would concur with this point.
Pinpointing variable financial figures is quite difficult. Different companies and industries inherently have more or less predictable attributes. Predicting when the sun will rise and set is quite a bit more predictable than predicting what Intel Corp’s (INTC) gross margins will be on a quarterly basis. As mentioned earlier, layering on debt can increase the volatility of earnings forecasts as well.
Forecasting is essential in the investment world, but even if you were the best forecaster in the world, investors cannot disregard the importance of valuation skills. The art of valuation is just as important, if not more important than being right on your financial scenarios.
All in all, the recipe of forecasting sounds simple if you look at the basic ingredients of trend and sustainability analysis. However, before the ultimate forecast comes out of the oven, this straightforward recipe requires a lot of preparation, whether it is slicing and dicing cash flow figures, whipping up some margin trends, or measuring up sales growth. Any way you cut it, systematically following a recipe of trend and sustainability analysis is a non-negotiable requirement if you want to heat up superior financial results.
Wade W. Slome, CFA, CFP®
Plan. Invest. Prosper.
*DISCLOSURE: Sidoxia Capital Management (SCM) and some of its clients own certain exchange traded funds, but at the time of publishing SCM had no direct positions in GE, MSFT, CAKE, SSRX, INTC, JPM/Bear Stearns, Lehman Brothers, or any other security referenced in this article. No information accessed through the Investing Caffeine (IC) website constitutes investment, financial, legal, tax or other advice nor is to be relied on in making an investment or other decision. Please read disclosure language on IC “Contact” page.
Ray Allen, the VIX, and the Rule of 16

Photo Source: Babble.com
Ray Allen gets paid a lot of money for running into people and bouncing an orange ball around a wooden floor, but even his game can appreciate the importance volatility can play in a high stakes game. First, Allen set an NBA Final’s basketball record of eight three-pointers made (including seven in a row) in Game 2, and then followed up in the next game with an astonishingly dismal “O” for thirteen performance – the second worst shooting performance during a Final’s game in 32 years. The emotional rollercoaster ride for the Celtics fans resembles a volatility chart of the VIX (Volatility Index) in recent weeks.
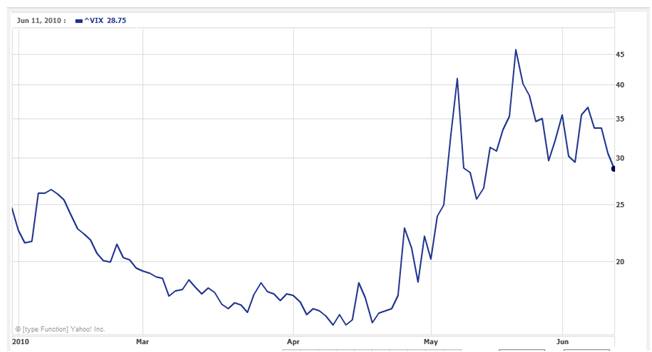
Chart Source: Yahoo! Finance
In the last 40 trading days the VIX has moved more than +/- 5% on 30 different trading sessions (75% of the time), including seventeen +/- 10% trading days. The +32% spike in the VIX on the day of the “Flash Crash” (May 6, 2010) would have even generated a smirk on the face of Ray Allen, not to mention the face changing impact of the other three +/- 30% move days that occurred within a month of the Flash Crash trading debacle. Even though the VIX has settled down from a short-term peak last month (48.20 on May 21st) to a lower level (28.79), the fear gauge still stands at almost double the rate of the multi-year low just a few months ago (15.23 on April 12th).
The VIX and the Rule of 16
No, this VIX is not the same as the Vicks vapor rub medication placed on your chest to relieve cough symptoms, rather this VIX indicator calculates inputs from various call and put options to create an approximation of the S&P 500 index implied volatility for the next 30 days. Put simply, when fear is high, the price of insurance catapults upwards as measured by the VIX – just like we saw when the VIX spiked above 80 during the 2008 financial crisis and above 40 during the more fresh Greek debt disaster. I’m not in the position to bust out some differential calculus to explain the nuances of a complex VIX formula, but what I can do is regurgitate a helpful formula relating to the VIX, called the Rule of 16. What the Rule of 16 allows laymans to do is understand the relationship between the VIX and daily volatility.
This is how Jeff Luby of Green Faucet describes the Rule of 16:
• VIX of 16 – 1/3 of the time the SPX will have a daily change of at least 1%
• VIX of 32 – 1/3 of the time the SPX will have a daily change of at least 2%
• VIX of 48 – 1/3 of the time the SPX will have a daily change of at least 3%
To put these VIX numbers in perspective, industry citations put the long-term VIX average around a level of 20. With a VIX hovering around 30 now, we are approaching the 2nd bucket of expectations (2%+ moves in the market 1/3 of the time). The price moves don’t correlate directly with the Dow Jones Industrial Average index, but I think about the current VIX levels equating to about a +/- 200 point move in the Dow one or two times per week…uggh.
Generally, I would prefer lower volatility, but I continually remind myself volatility is not necessarily a bad thing – volatility creates opportunities. I’m not sure if I can apply the Rule of 16 to Ray Allen’s scoring output, however based on last night’s 5-10 shooting performance, perhaps volatility in the market and Ray Allen’s shooting game will begin to normalize toward historical ranges.
Wade W. Slome, CFA, CFP®
Plan. Invest. Prosper.
*DISCLOSURE: Sidoxia Capital Management (SCM) and some of its clients own certain exchange traded funds (including S&P 500-like positions), but at the time of publishing SCM had no direct positions in SPX, VIX-related securities, or any other security referenced in this article. No information accessed through the Investing Caffeine (IC) website constitutes investment, financial, legal, tax or other advice nor is to be relied on in making an investment or other decision. Please read disclosure language on IC “Contact” page.
The Annuity Trap

Like the infamous Roach Motel, annuities allow investors to check-in while making it very difficult to check out. In many instances, getting out of annuities can be cost prohibitive (fees, charges, commissions, expenses, etc.), even if escaping these fee-laden products is in the investors’ best financial interest.
In an article dated April 13th, 2010, Jay Peroni warned others by outlining a typical annuity fee structure as follows:
- Mortality and Expense Charge 1.50%
- Sub Account Management Fees 1.00%
- Unreported trading costs 0.78%
- Annual Administrative Expenses 0.15%
TOTAL ANNUAL EXPENSES 3.43%
What aren’t included in these numbers above are the surrender charges, which effectively can lock you into the annuity if you are averse to paying hefty surrender charges. Normally, the surrender charges vary from up to a 10% charge for large withdrawals in year one, decreasing to something like 1% in year 10. Worth noting, steep sales commissions can be layered on top of the previous charges or mysteriously embedded in the fee structure categories above.
The Big Sell

Driving the push for these 3%+ annual fees are lucrative financial institutions hiring aggressive salespeople. Typically annuities are sold under the guise of safe tax shelter investments. What the broker won’t tell you is that only a fraction (“exclusion ratio”) of the annuity payments is shielded from taxes, and the rest of the payments are taxed at the higher, unfavorable ordinary income tax rate (relative to qualified dividends and capital gains from other securities). Much of the time, many of the salespeople, who call themselves “financial advisors,” know little about these complex annuity products (see Financial Sharks article). What these brokers do understand are the big, fat commissions they stand to collect upon fleecing unsuspecting investors.
Scores of these so-called advisors are actually “registered representatives” who do not carry a fiduciary duty (meaning they are NOT required to make investment decisions in the best interest of their clients). Certainly, there are some situations where annuities might be appropriate, but from my experience there are very few cases where the egregious charges and expenses outweigh the benefits. I believe the vast majority of brokers/registered reps/salespeople are more concerned about padding their wallets than building and protecting client portfolios.
The Alternatives
If safety and tax advantages are features you are looking for then I encourage you to look at more efficient options such as the following:
- 401k Defined Contribution Retirement Plan (or other “Qualified Plan”): Allows you to achieve tax deferral often with free money given to you in the form of a match to your contributions.
- IRA (Individual Retirement Account): Whether you consider a traditional or Roth IRA, there are tax deferral advantages with lower fees.
- Low Turnover, High Dividend Portfolios: Using a tax efficient management strategy with better tax treatment of income is another approach that I firmly believe will outperform most annuities.
- Tax-Exempt Muni Bonds or Corporates: The tax-exempt status of municipal bonds affords investors a tax advantaged status. The after-tax yield on corporate bonds can be compared to the returns promised on annuities (AFTER all fees, charges, and commissions). Holding individual bonds until maturity can help avoid interest rate risk.
- Ladder Zero Coupon Bonds: If safe fixed payments are what you are looking for, then staggered purchases of zero coupon bonds can be purchased as well.
These are only a few options that could and should be considered when reviewing your personal objectives and circumstances. With regard to the insurance component of an annuity contract, there are more cost effective ways of paying for insurance – most notably, term insurance.
At the end of the day, no matter the financial product, it is important you understand the underlying fees charged on any strategy, along with how the person selling you stuff is compensated. If you don’t do your homework on these extremely complex products (many not regulated by the NASD or SEC), then you may find yourself checking into the annuity hotel, but unable to check out.
Wade W. Slome, CFA, CFP®
Plan. Invest. Prosper.
*DISCLOSURE: Sidoxia Capital Management (SCM) and some of its clients own certain exchange traded funds, but at the time of publishing SCM had no direct positions in any other security referenced in this article. No information accessed through the Investing Caffeine (IC) website constitutes investment, financial, legal, tax or other advice nor is to be relied on in making an investment or other decision. Please read disclosure language on IC “Contact” page.
Stocks…Bonds on Steroids

With all the spooky headlines in the news today, it’s no wonder everyone is piling into bonds. The Investment Company Institute (ICI), which tracks mutual fund data, showed -88% of the $14 billion in weekly outflows came from equity funds relative to bonds and hybrid securities. With the masses flocking to bonds, it’s no wonder yields are hovering near multi-decade historical lows. Stocks on the other hand are the Rodney Dangerfield (see Doug Kass’s Triple Lindy attempt) of the investment world – they get “no respect.” By flipping stock metrics upside down, we will explore how hated stocks can become the beloved on steroids, if viewed in the proper context.
Davis on Debt Discomfort
Chris Davis, head of the $65 billion in assets at the Davis Funds, believes like I do that navigating the “bubblicious” bond market will be a treacherous task in the coming years. Davis directly states, “The only real bubble in the world is bonds. When you look out over a 10-year period, people are going to get killed.” In the short-run, inflation is not a real worry, but it if you consider the exploding deficits coupled with the exceedingly low interest rates, bond investors are faced with a potential recipe for disaster. Propping up the value of the dollar due to sovereign debt concerns in Greece (and greater Europe) has contributed to lower Treasury rates too. There’s only one direction for interest rates to go, and that’s up. Since the direction of bond prices moves the opposite way of interest rates, mean reversion does not bode well for long-term bond holders.
Earnings Yield: The Winning Formula
Average investors are freaked out about the equity markets and are unknowingly underestimating the risk of bonds. Investors would be in a better frame of mind if they listened to Chris Davis. In comparing stocks and bonds, Davis says, “If people got their statement and looked at the dividend yield and earnings yield, they might do things differently right now. But you have to be able to numb yourself to changes in stock prices, and most people can’t do that.” Humans are emotional creatures and can find this a difficult chore.
What us finance nerds learn through instruction is that a price of a bond can be derived by discounting future interest payments and principle back to today. The same concept applies for dividend paying stocks – the value of a stock can be determined by discounting future dividends back to today.
A favorite metric for stock jocks is the P/E (Price-Earnings) ratio, but what many investors fail to realize is that if this common ratio is flipped over (E/P) then one can arrive at an earnings yield, which is directly comparable to dividend yields (annual dividend per share/price per share) and bond yields (annual interest/bond price).
Earnings are the fuel for future dividends, and dividend yields are a way of comparing stocks with the fixed income yields of bonds. Unlike virtually all bonds, stocks have the ability to increase dividends (the payout) over time – an extremely attractive aspect of stocks. For example, Procter & Gamble (PG) has increased its dividend for 54 consecutive years and Wal-Mart (WMT) 37 years – that assertion cannot be made for bonds.
As stock prices drop, the dividend yields rise – the bond dynamics have been developing in reverse (prices up, yields down). With S&P 500 earnings catapulting upwards +84% in Q1 and the index trading at a very reasonable 13x’s 2010 operating earnings estimates, stocks should be able to outmuscle bonds in the medium to long-term (with or without steroids). There certainly is a spot for bonds in a portfolio, and there are ways to manage interest rate sensitivity (duration), but bonds will have difficulty flexing their biceps in the coming quarters.
Read the full article on Chris Davis’s bond and earnings yield comments
Wade W. Slome, CFA, CFP®
Plan. Invest. Prosper.
*DISCLOSURE: Sidoxia Capital Management (SCM) and some of its clients own certain exchange traded funds and WMT, but at the time of publishing SCM had no direct positions in PG, or any other security referenced in this article. No information accessed through the Investing Caffeine (IC) website constitutes investment, financial, legal, tax or other advice nor is to be relied on in making an investment or other decision. Please read disclosure language on IC “Contact” page.
Avoiding Automobile and Portfolio Crashes

Personal opinions of oneself don’t always mirror reality. Self perceptions relating to both driving and investing can be inflated. For example, the National Highway Traffic Safety Administration (NHTSA) reports that 95% of crashes are caused by human error, but 75% of drivers say they are better drivers than most.
Contributing factors to crashes include: 1) Distractions; 2) Alcohol; 3) Unsafe behavior (i.e., speeding); 4) Time of day (fatality rate is 3x higher at night); 5) Lack of safety belt; 6) Weather; and 7) Time of week (weekends are worst crash days).
A spokesman for the Insurance Institute for Highway Safety is quick to point out that driving behind the wheel is the riskiest activity most people engage in on a daily basis – more than 40,000 driving related fatalities occur each year. Careful common sense helps while driving, but driving sober at 4 a.m. (very few drivers on the road) on a weekday with your seatbelt on won’t hurt either.
Avoiding a Portfolio Crash
Another dangerous activity frequently undertaken by Americans is investing, despite people’s inflated beliefs of their money management capabilities. Investing, however, does not have to be harmful if proper precautions are taken.
Here is some of the hazardous behaviors that should be avoided by those maneuvering an investment portfolio:
1) Trading Too Much: Excessive trading leads to undue commissions, transaction costs, bid-ask spread, impact costs. Many of these costs are opaque or invisible and won’t necessarily be evident right away. But like a leaky boat, direct and indirect trading costs have the potential of sinking your portfolio.
2) Worrying about the Economy Too Much: The country experiences about two recessions a decade, nonetheless our economy continues to grow. If macroeconomics still worry you, then look abroad for even healthier growth – considerable international exposure should aid the long-term success of your portfolio and assist you in sleeping better at night.
3) Emotionally Reacting – Not Objectively Planning: News is bad, so sell. News is good, so buy. This type of conduct is a recipe for portfolio disaster. Better to do as Warren Buffett says, “Be fearful when others are greedy, and be greedy when others are fearful.” The long-term fundamental prospects for any investment are much more important than the daily headlines that get the emotional juices flowing.
4) Hostage to Short-term Time Horizon: Rather than worry about the next 10 days, you should be focused on the next 10 years. The further out you can set your time horizon, the better off you will be. Patience is a virtue.
5) Incongruent Portfolio with Risk: Many retirees got caught flat-footed in the midst of the global financial crisis of 2008-09 with investment portfolios heavy in equities and real estate. Diversified portfolios including fixed-income, commodities, international exposure, cash, and alternative investments should be optimized to meet your specific objectives, constraints, risk tolerance, and time horizon.
6) Timing the Market: Attempting to time the market can be hazardous to your investment health (see Market Timing article). If you really want to make money, then avoid the masses – the grass is greener and the eating better away from the herd.
Driving and investing can both be dangerous activities that command responsible behavior. Do yourself a favor and protect yourself and your portfolio from crashing by taking the appropriate precautions and avoiding the common hazardous mistakes.
Read Full Forbes Article on Driving Dangers
Wade W. Slome, CFA, CFP®
Plan. Invest. Prosper.
*DISCLOSURE: Sidoxia Capital Management (SCM) and some of its clients own certain exchange traded funds, but at the time of publishing SCM had no direct positions in any security referenced in this article. No information accessed through the Investing Caffeine (IC) website constitutes investment, financial, legal, tax or other advice nor is to be relied on in making an investment or other decision. Please read disclosure language on IC “Contact” page.
EBITDA: Sniffing Out the Truth

Financial analysts are constantly seeking the Holy Grail when it comes to financial metrics, and to some financial number crunchers EBITDA (Earnings Before Interest Taxes Depreciation and Amortization – pronounced “eebit-dah”) fits the bill. On the flip side, Warren Buffett’s right hand man Charlie Munger advises investors to replace EBITDA with the words “bullsh*t earnings” every time you encounter this earnings metric. We’ll explore the good, bad, and ugly attributes of this somewhat controversial financial metric.
The Genesis of EBITDA
The origin of the EBITDA measure can be traced back many years, and rose in popularity during the technology boom of the 1990s. “New Economy” companies were producing very little income, so investment bankers became creative in how they defined profits. Under the guise of comparability, a company with debt (Company X) that was paying interest expense could not be compared on an operational profit basis with a closely related company that operated with NO debt (Company Z). In other words, two identical companies could be selling the same number of widgets at the same prices and have the same cost structure and operating income, but the company with debt on their balance sheet would have a different (lower) net income. The investment banker and company X’s answer to this apparent conundrum was to simply compare the operating earnings or EBIT (Earnings Before Interest and Taxes) of each company (X and Z), rather than the disparate net incomes.
The Advantages of EBITDA
Although there is no silver bullet metric in financial statement analysis, nevertheless there are numerous benefits to using EBITDA. Here are a few:
- Operational Comparability: As implied above, EBITDA allows comparability across a wide swath of companies. Accounting standards provide leniency in the application of financial statements, therefore using EBITDA allows apples-to-apples comparisons and relieves accounting discrepancies on items such as depreciation, tax rates, and financing choice.
- Cash Flow Proxy: Since the income statement traditionally is the financial statement of choice, EBITDA can be easily derived from this statement and provides a simple proxy for cash generation in the absence of other data.
- Debt Coverage Ratios: In many lender contracts certain debt provisions require specific levels of income cushion above the required interest expense payments. Evaluating EBITDA coverage ratios across companies assists analysts in determining which businesses are more likely to default on their debt obligations.
The Disadvantages of EBITDA
While EBITDA offers some benefits in comparing a broader set of companies across industries, the metric also carries some drawbacks.
- Overstates Income: To Charlie Munger’s point about the B.S. factor, EBITDA distorts reality. From an equity holder’s standpoint, in most instances, investors are most concerned about the level of income and cash flow available AFTER all expenses, including interest expense, depreciation expense, and income tax expense.
- Neglects Working Capital Requirements: EBITDA may actually be a decent proxy for cash flows for many companies, however this profit measure does not account for the working capital needs of a business. For example, companies reporting high EBITDA figures may actually have dramatically lower cash flows once working capital requirements (i.e., inventories, receivables, payables) are tabulated.
- Poor for Valuation: Investment bankers push for more generous EBITDA valuation multiples because it serves the bankers’ and clients’ best interests. However, the fact of the matter is that companies with debt or aggressive depreciation schedules do deserve lower valuations compared to debt-free counterparts (assuming all else equal).
Wading through the treacherous waters of accounting metrics can be a dangerous game. Despite some of EBITDA’s comparability benefits, and as much as bankers and analysts would like to use this very forgiving income metric, beware of EBITDA’s shortcomings. Although most analysts are looking for the one-size-fits-all number, the reality of the situation is a variety of methods need to be used to gain a more accurate financial picture of a company. If EBITDA is the only calculation driving your analysis, I urge you to follow Charlie Munger’s advice and plug your nose.
Wade W. Slome, CFA, CFP®
Plan. Invest. Prosper.
*DISCLOSURE: Sidoxia Capital Management (SCM) and some of its clients own certain exchange traded funds, but at the time of publishing had no direct positions in any security referenced in this article. No information accessed through the Investing Caffeine (IC) website constitutes investment, financial, legal, tax or other advice nor is to be relied on in making an investment or other decision. Please read disclosure language on IC “Contact” page.
Shanking Your Way to Success: Tiger Woods & Roger McNamee

Spring has sprung and that means golf is back in full swing with the Masters golf tournament kicking off next week in Augusta, Georgia. Next week also marks the return of Tiger Woods in his first competition since news of Tiger’s sex scandal and car crash originally broke. As an avid golf fan (and occasional frustrated player), I must admit I do find a devilish sense of guilty pleasure every time I see a pro golfer shank a ball into the thick of the woods or plop one in the middle of the drink. I mean, how many hundreds of balls have I donated to golf courses across this great nation? Let’s face it, no matter how small, people derive some satisfaction from seeing others commit similar mistakes…misery loves company. Even the world’s elite, including Tiger Woods, slip up periodically.
For quite possibly the worst, nightmarish, meltdown classic of all-time, you may recall Frenchman John van de Velde’s 18th hole collapse at the 1999 British Open in Carnoustie, Scotland.
Investment Pros Shank Too
Investment legend Peter Lynch (see Investment Caffeine profile on Lynch), who trounced the market with a +29% annual return average from 1977-1990, correctly identified the extreme competitiveness of the stock-picking world when he stated, “If you’re terrific in this business you’re right six times out of ten.” Even with his indelible record, Lynch had many disastrous stocks, including American International Airways, which went from $11 per share down to $0.07 per share. Famous early 20th Century trader Jesse Livermore puts investment blundering into context by adding, “If a man didn’t make mistakes he’d own the world in a month.”
Mistakes, plain and simply, are a price of playing the investment game. Or as the father of growth investing Phil Fisher noted (see Investment Caffeine profile on Fisher), “Making mistakes is an inherent cost of investing just like bad loans are for the finest lending institutions.”
McNamee’s Marvelous Misfortune
Since the investment greats operate under the spotlight, many of their poor decisions cannot be swept under the rug. Take Roger McNamee, successful technology investor and co-founder of Elevation Partners (venture capital) and Silver Lake Partners (private equity). His personal purchase of 2.3 million shares ($37 million) in smartphone and handheld computer manufacturer Palm Inc. (PALM) has declined by more than a whopping -75% since his personal purchase just six months ago at $16.25 share price (see also The Reformed Broker). McNamee is doing his best to recoup some of his mojo with his hippy-esque band Moonalice – keep an eye out for tour dates and locations.
Lessons Learned
More important than making repeated mistakes is what you do with those mistakes. “Insanity is doing the same thing over and over again, and expecting different results,” observed Albert Einstein. Learning from your mistakes is the most important lesson in hopes of mitigating the same mistakes in the future. Phil Fisher adds, “I have always believed that the chief difference between a fool and a wise man is that the wise man learns from his mistakes, while the fool never does.” As part of my investment process, I always review my errors. By explicitly shaming myself and documenting my bad trades, I expect to further reduce the number of poor investment decisions I make in the future.
With the Masters just around the corner, I must admit I eagerly wait to see how Tiger Woods will perform under extreme pressure at one of the grandest golf events of the year. I will definitely be rooting for Tiger, although you may see a smirk on my face if he shanks one into the trees.
Wade W. Slome, CFA, CFP®
Plan. Invest. Prosper.
*DISCLOSURE: Sidoxia Capital Management (SCM) and some of its clients own certain exchange traded funds, but at the time of publishing had no direct positions in PALM or any security referenced in this article. No information accessed through the Investing Caffeine (IC) website constitutes investment, financial, legal, tax or other advice nor is to be relied on in making an investment or other decision. Please read disclosure language on IC “Contact” page.
Simmons Wants to Kiss Life Insurance Worries Away

The Makeup Master
Gene Simmons, lead singer of rock group Kiss, was born as Chaim Witz in Israel 60 years ago. After 40 years of rocking & rolling, the band is still alive and well and touring this spring in the U.K. I am no stranger to Gene Simmons – as a matter of fact, Kiss was the first concert I attended as a kid at the San Francisco Cow Palace in the 1970s. Despite his early professional career success, all the limelight and money was not enough for Gene Simmons, so he put his entrepreneurial skills to the test and aggressively added a broad Kiss merchandising line (over 3,000 licensed/merchandise items), including everything from Kiss baby clothing and Kiss wine to Kiss dart boards and Kiss caskets. Yep, soup to nuts, from the cradle to the grave, and you can even purchase the merchandise with your Kiss Visa credit card!
All Aboard the Premium Financing Train
Now, Mr. Simmons has expanded his business interests to a broader set of financial services. Specifically, Simmons has co-founded a company (Cool Springs Life) that sells premium finance life insurance targeted at high net worth individuals. Simmons and CEO Samuel Watson stopped off at Bloomberg to spread the premium finance gospel:
Premium financing arrangements set up for life insurance are primarily designed for wealthy individuals with large, multi-million dollar estates. This explains a little about whom are the prime targets for life insurance premium financing, but why would wealthy individuals potentially want this financing tool?
Premium Financing Benefits:
- Pay for Estate Taxes: The primary advantage of life insurance for the wealthy is to provide liquidity to beneficiaries (in the form of a death benefit) at the death of the “insured” to fund future estate taxes. Estate tax legislation is still up in the air, but in my view will likely increase to a hefty 45% to 55% rate over the next year. The tax-free liquidity (see a knowledgeable CPA to confirm tax status) provided to the surviving beneficiary by the insurance policy can be especially important if the deceased person’s assets are tied up in illiquid assets like real estate. The government is impatient in regards to tax collections, so gaining immediate access to the death benefit proceeds is a more attractive alternative than forced sales of illiquid assets (potentially at fire-sale prices).
- Other People’s Money: Some people prefer to purchase things with other people’s money. The cost of the financing can be another benefit to the strategy. The interest rate owed on a premium financing deal may be lower than the return a client can earn on alternative investments. If the investment strategy proves successful, the borrower will earn a positive spread on the loan (borrow low, invest high).
- Lower Estate Value: By gifting life insurance assets to a trust (e.g., an Irrevocable Life Insurance Trust – ILIT), there are ways for a wealthy donor to lower his estate value by employing gifting strategies and other estate planning structures. These estate planning tactics often preserve asset values for designated beneficiaries, rather than forking over unnecessarily high taxes to the IRS (Internal Revenue Service). In some cases a knowledgeable attorney can structure premium payments in such a fashion that exemption allowances alleviate any potential gift tax consequence.
Normally nothing in life comes risk-free and the same principle applies to life insurance premium financing.
Premium Financing Risks:
- Interest Rate Risk: Many of these contracts are constructed based on a floating interest rate structure like LIBOR (London Interbank Offered Rate) , therefore if interest rates rise, the borrowers could expose themselves to higher interest payments.
- Credit Risk of Lender: Heaven forbid we go through another financial crisis of the same scale as 2008-2009, but insurance players such as AIG were large players in the premium financing market during this period and caused significant disruption to all relevant participants in the premium financing food chain. Failure of a lender could compromise the integrity of the life insurance and estate planning strategy.
- Risk of Deteriorating Borrower Assets: Depending on the circumstances and facts surrounding the premium financing structure, the lender may require different forms of borrower collateral (i.e., stocks, bonds, real estate, letter of credit, etc.) on top of the cash value/surrender value of the life insurance policy. If the borrower’s collateral value decreases below a certain threshold, the borrower may be forced to supply additional collateral.
For those people who want to rock and roll all night and party every day, perhaps life insurance premium financing is not for you. However, if you got a lot of dough and want to preserve the value of your estate, maybe you should give Gene Simmons a call. With a signed contract, he might even include a Kiss casket for your future funeral plans.
Wade W. Slome, CFA, CFP®
Plan. Invest. Prosper.
DISCLOSURE: Sidoxia Capital Management (SCM) and some of its clients own certain exchange traded funds and a derivative security of an AIG insurance subsidiary, but at time of publishing had no direct positions in AIG. No information accessed through the Investing Caffeine (IC) website constitutes investment, financial, legal, tax or other advice nor is to be relied on in making an investment or other decision. Please read disclosure language on IC “Contact” page.
Markowitz’s Five Dimensions of Risk

Eighty-two year old Harry Markowitz, 1990 Nobel Prize winner, is best known for his creation of Modern Portfolio Theory (MPT) in the 1950s. MPT elegantly combines mathematical variables such that investors can theoretically maximize returns while minimizing risk with the aid of diversification. Markowitz’s Efficient Frontier research eventually led to the future breakthrough of the Capital Asset Pricing Model (CAPM).
The Different Faces of Risk
Before we dive further into Markowitz’s dimensions of risk, let’s explore the definitions of the word “risk.” Just like the word “love” is interpreted differently by different people, so too does risk. To some, risk is defined as the probability of loss. To mathematicians, risk often means the historical volatility in returns as measured by standard deviation or Beta. For many individual investors, risk is frequently mischaracterized by emotions – risk is believed to be high after market collapse and low after extended market rallies (see also Wobbling Risk Tolerances article).
The Five Dimensions of Risk
With the procedural definitions of risk behind us, we can take a deeper look at risk from the eyes of Markowitz. Beyond the complex mathematical equations, Markowitz also understands risk from the practical investor’s standpoint. In a recent Financial Advisor magazine article Markowitz reviews the five dimensions of risk exposure:
1) Time Horizon
2) Liquidity Needs
3) Net Income
4) Net Worth
5) Investing Knowledge/Attitudes on Risk
Rather than pay attention to these practical dimensions of individual risk tolerance, countless investors adjust their risk exposure (equity allocation) by speculating on the direction of the stock market, which usually means buying high and selling low at inopportune times. Although it can be entertaining to guess the direction of the market, we all know market timing is a loser’s game in the long-run (see also Market Timing Treadmill article). Markowitz’s first four risk exposures are fairly straightforward, measurable factors, however the fifth exposure (“knowledge and attitude”) is much more difficult to measure. Determining risk attitude can be an arduous process if risk tolerance constantly wavers through the winds of market volatility.
The Double Whammy
Rather than becoming a nervous Nelly, constantly chomping on your finger nails, your investment focus should be on action, and the things you can control. The number one goal is simple….SAVE. How does one save? All one needs to do is spend less than they take in. Like dieting, saving is easy to understand, but difficult to execute. You can either make more money, spend less, or better yet… do both.
The Baby Boomers are not completely out of the woods, but the next generations (X, Y, Z, etc.) is even worse off because they face the “Double Whammy.” Not only are life expectancies continually increasing but the Social Security safety net is becoming bankrupt. Consider the average life expectancy was roughly 30 years old in 1900 and in developed countries today we stand at about 78 years. Some actuarial tables are peaking out at 120 years now (see also Brutal Reality to Aging Demographics). So when considering Markowitz’s risk exposure #1 (time horizon), it behooves you to calibrate your risk tolerance to match a realistic life expectancy (with some built-in cushion if modern medicine does a better job).
Taming the Wild Beast
Every investor’s risk profile is multi-dimensional and constantly evolving due to changes in Markowitz’s five risk exposures (time horizon, liquidity needs, net income, net worth, and knowledge/attitude). Risk can be a wild animal difficult to tame, but if you can create a disciplined, systematic investment plan, you too can reach your financial goals without getting bitten by the numerous retirement hazards.
Read the complete Financial Advisor article on Harry Markowitz
Wade W. Slome, CFA, CFP®
Plan. Invest. Prosper.
*DISCLOSURE: Sidoxia Capital Management (SCM) and some of its clients own certain exchange traded funds, but at the time of publishing had no direct positions in any security mentioned in this article. No information accessed through the Investing Caffeine (IC) website constitutes investment, financial, legal, tax or other advice nor is to be relied on in making an investment or other decision. Please read disclosure language on IC “Contact” page.
Bankruptcy: Where are You on the Capital Structure Totem Pole?
 The media likes to focus in on the microscopic universe of 30 stocks we like to call the Dow Jones Industrial Average, or the “market.” The reality is the Dow is like a drop in the ocean if you consider the global opportunity set across the capital structure. What is the capital structure? Well, you can think of the capital structure like a totem pole. The actual universe of investment opportunities spans everything from Blue Chip dividend paying stocks to illiquid international convertible preferred securities. The selection of the security type will determine where you sit on the capital structure (totem pole), and the location is especially important when the topic shifts to the dreaded word…B-A-N-K-R-U-P-T-C-Y.
Opening the Chapter Book on Bankruptcy
From a security or safety standpoint, the preferred investor location is at the top of the totem pole (capital structure). Why? Because once an entity declares Chapter 7 and begins asset liquidation, the bondholders/creditors at the top of the structure get paid first – whereas the equity holders at the bottom of the pole get paid last (if there are any asset proceeds remaining to be distributed). Here is a general ranking, from top to bottom, of the major security categories along the capital structure (more specialized hybrid security versions can fit in between the listed items):
1) Secured Bonds
2) Unsecured Bonds
3) Convertible Bonds
4) Preferred Stocks
5) Common Stock/Equity
Bankruptcy is a legal process that provides relief to many individuals who can no longer pay all of their debts. A potential outcome in the bankruptcy process is “debtor discharge,” which wipes away some or all of an individual’s debt. Here is a brief synopsis of the bankruptcy flavors:
Chapter 11: Designed primarily for businesses, Chapter 11 bankruptcy law allows financially distressed businesses to remain in business as debt payments are reorganized under the supervision of the courts. Technically, individuals can also choose to file for Chapter 11 bankruptcy, however practically speaking, individuals generally choose other paths. High profile examples of Chapter 11 bankruptcies include Lehman Brothers, Enron Corp., WorldCom Inc., General Motors Co., and Chrysler Group.
Chapter 7 & 13: These segments of the bankruptcy code are principally constructed for individuals. A means test reviewing an individual’s financial situation will determine which plan is most feasible. Here are brief descriptions:
- Chapter 7 is often referred to as the liquidating bankruptcy. This bankruptcy strategy is often used by individuals to save assets like a home and/or car. Although non-exempt assets will be liquidated by the owner to pay off creditors, many of a debtors assets are categorized as exempt – meaning the owner will not be forced to sell assets and creditors are held at bay.
- Chapter 13 allows individuals to retain assets by following a court sanctioned payment plan. Typically debt payments are made by the individual over years, and as long as payments remain current, the owner can retain assets.
More to Gain, More to Lose at the Bottom
Being at the bottom of the capital structure totem pole (owning stocks) involves relatively more price volatility. If you combine the wild swings with the fact that about 50% of households own stock in some shape or form (Edward N. Wolff at New York University – 2009), then you create a recipe of intrigue. Theoretically, stocks have unlimited profit potential (not the case for most bonds). The media loves to report on the daily fortunes won and lost on the global stock exchanges, in addition to following the bigwig billionaires.
More Boredom, Less to Lose at the Top
Being at the top of the capital structure totem pole (owning bonds) comes with more security (less volatility), but also more boredom (less profit potential). That’s not to say healthy returns cannot be achieved in the bond market. We saw firsthand, during the financial crisis, how bankruptcy fears rocked certain areas of the bond market (e.g., high yield bonds), creating extraordinary investment opportunities. With liquidity returning to the market, and signs of economic stability coming back, investors will need to climb much higher up the tree to grab the hanging fruit.
Although there is plenty of room for optimism given certain macroeconomic and corporate indicators, the global economy is certainly not out of the woods. Business bankruptcies remain elevated, just as investors are piling into the perceived safe arms of corporate bonds. Interest rates, along with industry and company-specific factors will obviously impact the price performance of corporate bonds. If the economy hits choppy waters again, it behooves investors in higher yielding bonds to get a better understanding of where they sit on the capital structure totem pole. If not, those bond investors will slide down the capital structure, left commiserating about losses with their neighboring risk-loving stockholders.
Wade W. Slome, CFA, CFP®
Plan. Invest. Prosper.
*DISCLOSURE: Sidoxia Capital Management (SCM) and some of its clients own certain exchange traded funds, but at the time of publishing had no direct positions in Lehman Brothers, Enron Corp., WorldCom Inc., General Motors Co., and Chrysler Group or any security mentioned in this article. No information accessed through the Investing Caffeine (IC) website constitutes investment, financial, legal, tax or other advice nor is to be relied on in making an investment or other decision. Please read disclosure language on IC “Contact” page.