Posts filed under ‘Education’
Time for Your Retirement Physical

This article is an excerpt from a previously released Sidoxia Capital Management complementary newsletter (October 1, 2014). Subscribe on the right side of the page for the complete text.
As a middle-aged man, I’ve learned the importance of getting my annual physical to improve my longevity. The same principle applies to the longevity of your retirement account. With the fourth quarter of the calendar year officially underway, there is no better time to probe your investment portfolio and prescribe some recommendations relating to your financial goals.
A physical is especially relevant given all the hypertension raising events transpiring in the financial markets during the third quarter. Although the large cap biased indexes (Dow Jones Industrials and S&P 500) were up modestly for the quarter (+1.3% and +0.6%, respectively), the small and mid-cap stock indexes underperformed significantly (-8.0% [IWM] and -4.2% [SPMIX], respectively). What’s more, all the daunting geopolitical headlines and uncertain macroeconomic data catapulted the Volatility Index (VIX – aka, “Fear Gauge”) higher by a whopping +40.0% over the same period.
- What caused all the recent heartburn? Pick your choice and/or combine the following:
- ISIS in Iraq
- Bombings in Syria
- End of Quantitative Easing (QE) – Impending Interest Rate Hikes
- Mid-Term Elections
- Hong Kong Protests
- Tax Inversions
- Security Hacks
- Rising U.S. Dollar
- PIMCO’s Bill Gross Departure
(See Hot News Bites in Newsletter for more details)
As I’ve pointed out on numerous occasions, there is never a shortage of issues to worry about (see Series of Unfortunate Events), and contrary to what you see on TV, not everything is destruction and despair. In fact, as I’ve discussed before, corporate profits are at record levels (see Retail Profits chart below), companies are sitting on trillions of dollars in cash, the employment picture is improving (albeit slowly), and companies are finally beginning to spend (see Capital Spending chart below):
Retail Profits

Source: Dr. Ed’s Blog
Capital Spending

Source: Calafia Beach Pundit
Even during prosperous times, you can’t escape the dooms-dayers because too much of a good thing can also be bad (i.e., inflation). Rather than getting caught up in the day-to-day headlines, like many of us investment nerds, it is better to focus on your long-term financial goals, diversification, and objective financial metrics. Even us professionals become challenged by sifting through the never-ending avalanche of news headlines. It’s better to stick with a disciplined, systematic approach that functions as shock absorbers for all the inevitable potholes and speed bumps. Investment guru Peter Lynch said it best, “Assume the market is going nowhere and invest accordingly.” Everyone’s situation and risk tolerance is different and changing, which is why it’s important to give your financial plan a recurring physical.
Vacation or Retirement?
Keeping up with the Joneses in our instant gratification society can be a taxing endeavor, but ultimately investors must decide between 1) Spend now, save later; or 2) Save now, spend later. Most people prefer the more enjoyable option (#1), however these individuals also want to retire at a young age. Often, these competing goals are in conflict. Unless, you are Oprah or Bill Gates (or have rich relatives), chances are you must get into the practice of saving, if you want a sizeable nest egg…before age 85. The problem is Americans typically spend more time planning their vacation than they do planning for retirement. Talking about finances with an advisor, spouse, or partner can feel about as comfortable as walking into a cold doctor’s office while naked under a thin gown. Vulnerability may be an undesirable emotion, but often it is a necessity to reach a desired goal.
Ignorance is Not Bliss – Avoid Procrastination
Many people believe “ignorance is bliss” when it comes to healthcare and finance, which we all know is the worst possible strategy. Normally, individuals have multiple IRA, 401(k), 529, savings, joint, trust, checking and other accounts scattered around with no rhyme or reason. As with healthcare, reviewing finances most often takes place whenever there is a serious problem or need, which is usually at a point when it’s too late. Unfortunately, procrastination typically wins out over proactiveness. Just because you may feel good, or just because you are contributing to your employer’s 401(k), doesn’t mean you shouldn’t get an annual physical for your health and finances. I’m the perfect example. While I feel great on the outside, ignoring my high cholesterol lab results would be a bad idea.
And even for the DIY-ers (Do-It-Yourself-ers), rebalancing your portfolio is critical. In the last fifteen years, overexposure to technology, real estate, financials, and emerging markets at the wrong times had the potential of creating financial ruin. Like a boat, your investment portfolio needs to remain balanced in conjunction with your goals and risk tolerance, or your savings might tip over and sink.
Financial markets go up and down, but your long-term financial well-being does not have to become hostage to the daily vicissitudes. With the fourth quarter now upon us, take control of your financial future and schedule your retirement physical.

Wade W. Slome, CFA, CFP®
Plan. Invest. Prosper.
DISCLOSURE: Sidoxia Capital Management (SCM) and some of its clients hold positions in certain exchange traded funds (ETFs), but at the time of publishing SCM had no direct position in IWM, SPMIX, or any other security referenced in this article. No information accessed through the Investing Caffeine (IC) website constitutes investment, financial, legal, tax or other advice nor is to be relied on in making an investment or other decision. Please read disclosure language on IC Contact page.
Mathematics 101: The Cheap Money Printing Machine

Like many other bloggers and pundits, I have amply pontificated on the relative attractiveness of the stock market. For years, cash and gold hoarding bears have clung to the distorted, money-losing Shiller CAPE P/E ratio (see CAPE Smells Like B.S.), which has incorrectly signaled investors to stay out of stocks and miss trillions of dollars in price appreciation. Apparently, the ironclad Shiller CAPE device has been temporarily neutralized by the Federal Reserve’s artificially cheapening money printing press policies, just like Superman’s strength being stripped by the nullifying powers of kryptonite. The money printing logic seems so elegantly sound, I felt compelled to encapsulate this powerful relationship in an equation:
Interests Rate Cuts + Printing Press On = Stocks Go Higher
Wow, amazing…this is arithmetic any investor (or 3rd grader) could appreciate! Fortunately for me, I have a child in elementary school, so I became emboldened to share my new found silver bullet equation. I initially received a few raised eyebrows from my child when I introduced the phrase “Quantitative Easing” but it didn’t take long before she realized Rate Cuts + QE = Fat Piggy Bank.
After the intensive tutorial, I felt so very proud. With a smile on my face, I gave myself a big pat on the back, until I heard my child say, “Daddy, after looking at this squiggly S&P 500 line from 2007-2014, can you help my brain understand because I have some questions.”
Here is the subsequent conversation:
Me: “Sure kiddo, go ahead shoot…what can I answer for you?”
Child: “Daddy, if the Federal Reserve is so powerful and you should “not fight the Fed,” how come stock prices went down by -58% from 2007 – 2009, even though the Fed cut rates from 5.25% to 0%?”
Me: “Uhhhh….”
Child: “Daddy, if stock prices went down so much after massive rate cuts, does that mean stock prices will go up when the Fed increases rates?”
Me: “Uhhhh….”
Child: “Daddy, if Quantitative Easing is good for stock prices, how come after the QE1 announcement in November 2008, stock prices continued to go down -25%?”
Me: “Uhhhh….”
Child: “Daddy, if QE makes stocks go up, how come stock prices are at all-time record highs after the Fed has cut QE by -$70 billion per month and is completely stopping QE by 100% next month?”
Me: “Uhhhh….”
Child: “Daddy, everyone is scared of rate increases but when the Fed increased interest rates by 250 basis points in 1994, didn’t stock prices stay flat for the year?”
Me: “Uhhhh….” (See also 1994 Bond Repeat)
What started as a confident conversation about my bullet-proof mathematical equation ended up with me sweating bullets.
Math 101A: Low Interest Rates = Higher Asset Prices
As my previous conversation highlights, the relationship between rate cuts and monetary policy may not be as clear cut as skeptics would like you to believe. Although I enjoy the widely covered Shiller CAPE discussions on market valuations, somehow the media outlets fail to make the all-important connection between interest rates and P/E ratios.
One way of framing the situation is by asking a simple question:
Would you rather have $100 today or $110 a year from now?
The short answer is…”it depends.” All else equal, the level of interest rates will ultimately determine your decision. If interest rates are offering 20%, a rational person would select the $100 today, invest the money at 20%, and then have $120 a year from now. On the other hand, if interest rates were 0.5%, a rational person would instead select the option of receiving $110 a year from now because collecting a $100 today and investing at 0.5% would only produce $100.50 a year from now.
The same time-value-of-money principle applies to any asset, whether you are referring to gold, cars, houses, private businesses, stocks, or other assets. The mathematical fact is, all else equal, a rational person will always pay more for an asset when interest rates are low, and pay less when interest rates are high. As the 200-year interest chart below shows, current long-term interest rates are near all-time lows.
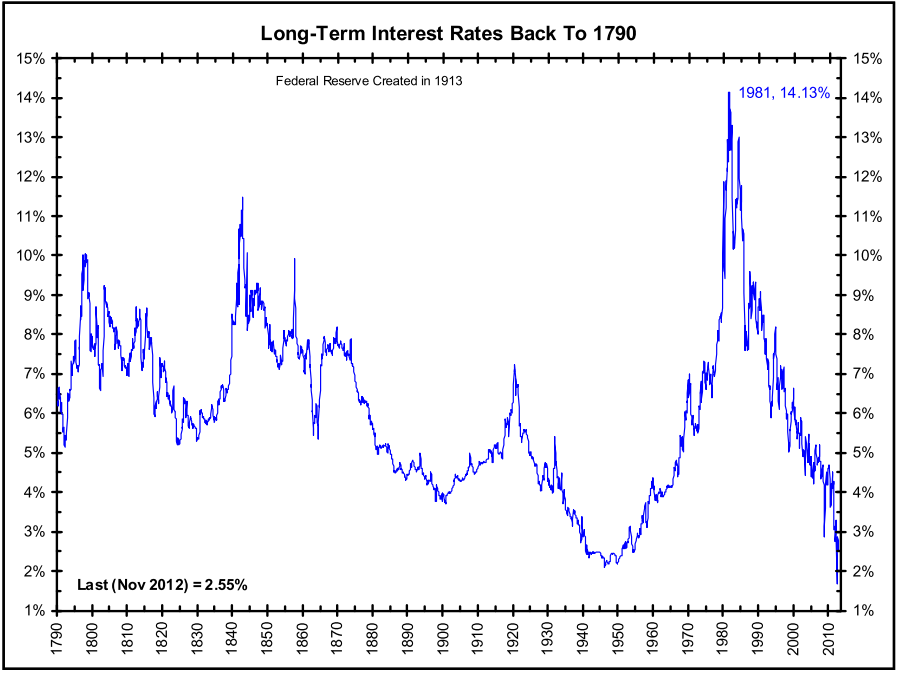
Source: The Big Picture
The peak in interest rates during the early 1980s correlated with a single digit P/E ratio (~8x). The current P/E ratio is deservedly higher (~16x), but it is dramatically lower than the 30x+ P/E ratio realized in the 2000 year timeframe. If none of this discussion makes sense, consider the simple Rule of 20 (see also The Rule of 20 Can Make You Plenty), which states as a simple rule-of-thumb, the average market P/E ratio should be equal to 20 minus the level inflation. With inflation currently averaging about 2%, the Rule of 20 implies an equilibrium of ~18x. If you assume this P/E multiple and factor in a 7-8% earnings growth rate, you could legitimately argue for 20% appreciation in the market to S&P 2,400 over a 12-month period. It’s true, a spike in interest rates, combined with a deceleration in earnings would justify a contraction in stock prices, but even under this scenario, current index values are nowhere near the bubble levels of 2000.
After six long years, the QE train is finally grinding to a halt, and a return towards Fed policy normalcy could be rapidly approaching. Many investors and skeptical bears have tried to rationalize the tripling in the market from early 2009 as solely due to the cheap Fed money printing machine. Unfortunately, history and mathematics don’t support that assertion. If you don’t believe me, perhaps a child may be able to explain it to you better.
Wade W. Slome, CFA, CFP®
Plan. Invest. Prosper.
DISCLOSURE: Sidoxia Capital Management (SCM) and some of its clients own a range of positions in certain exchange traded fund positions, but at the time of publishing SCM had no direct position in any other security referenced in this article. No information accessed through the Investing Caffeine (IC) website constitutes investment, financial, legal, tax or other advice nor is to be relied on in making an investment or other decision. Please read disclosure language on IC Contact page.
Investing with Crayons

At one level, investing can be extremely challenging if you consider the plethora of diverse and unpredictable factors such as monetary policy, fiscal policy, wars, banking crises, natural disasters, currency crises, geopolitical turmoil, Ebola, Scottish referendums, etc. On the other hand, investing (not trading or speculating) should be quite simple…like drawing stick figures with a crayon. However, simplicity does not mean laziness. Successful stock research requires rigorous due diligence without cutting corners. Once the heavy research lifting is completed, concise communication is always preferred.
In order to be succinct, investors need to understand the key drivers of stock performance. In the short run, investors may not be able to draw the directional path of stock prices, but over the long run, Peter Lynch described stock predictions best (see Inside the Investing Genius) when he stated:
“People may bet on hourly wiggles of the market but it’s the earnings that waggle the wiggle long term.”
In other words, if revenues, earnings, and most importantly cash flows go up over the long-term, then it is highly likely that stock prices will follow. Besides profits, interest rates and sentiment are other key contributing factors affecting the trajectory of future stock prices.
In high school and college, students often cram as much information into a paper with the goal of layering pages as high as possible. Typically, the heaviest papers got A’s and the lightest papers got C’s or D’s. However, as it relates to stock analysis, the opposite holds true – brevity reigns supreme.
American psychologist and philosopher William James noted, “The art of being wise is the art of knowing what to overlook.”
In our digital world of informational overload, knowing what to overlook is quite a challenge. I experienced this dynamic firsthand early on in my professional career when I was an investment analyst. When asked to research a new stock by my portfolio manager, often my inclination was to throw in the data kitchen sink into my report. Rather than boil down the report to three or four critical stock-driving factors, I defaulted to a plan of including every possible risk factor, competitor, and valuation metric. This strategy was designed primarily as a defense mechanism to hedge against a wide range of possible outcomes, whether those outcomes were probable or very unlikely. Often, stuffing irrelevant information into reports resulted in ineffectual, non-committal opinions, which could provide cosmetic wiggle room for me to rationalize any future upward or downward movement in the stock price.
Lynch understood as well as anyone that stock investing does not have to be complex rocket science:
“Everyone has the brainpower to follow the stock market. If you made it through fifth-grade math, you can do it.”
In fact, when Lynch worked with investment analysts, he ran a three-minute timer and forced the analysts to pitch stock ideas in basic terms before the timer expired.
If you went back further in time, legendary Value guru Benjamin Graham also understood brain surgery is not required to conduct successful equity analysis:
“People don’t need extraordinary insight or intelligence. What they need most is the character to adopt simple rules and stick to them.”
Similarly, Warren Buffett hammers home the idea that a gargantuan report or extravagant explanation isn’t required in equity research:
“You should be able to explain why you bought a stock in a paragraph.”
Hedge fund veteran manager Michael Steinhardt held the belief that a stock recommendation should be elegant in its simplicity as well. In his book No Bull – My Life In and Out of Markets he states that an analyst “should be able to tell me in two minutes, four things: 1) the idea; 2) the consensus view; 3) his variant perception; and 4) a trigger event.
All these previously mentioned exceptional investors highlight the basic truth of equity investing. A long, type-written report inundated with confusing charts and irrelevant data is counterproductive to the investment and portfolio management process. Outlining a stock investment thesis is much more powerful when succinctly written with a crayon.
Wade W. Slome, CFA, CFP®
Plan. Invest. Prosper.
DISCLOSURE: Sidoxia Capital Management (SCM) and some of its clients own a range of positions in certain exchange traded fund positions, but at the time of publishing SCM had no direct position in any other security referenced in this article. No information accessed through the Investing Caffeine (IC) website constitutes investment, financial, legal, tax or other advice nor is to be relied on in making an investment or other decision. Please read disclosure language on IC Contact page.
Back to the Future: Mag Covers (Part I)
Magazine Covers Part II – – – Magazine Covers Part III
I’m not referring to the movie, Back to the Future, about a plutonium-powered DeLorean time machine that finds Marty McFly (played by Michael J. Fox) traveling back in time. Rather, I am shining the light on the uncanny ability of media outlets (specifically magazines) to mark key turning points in financial markets – both market bottoms and market tops. This will be the first in a three part series, providing a few examples of how magazines have captured critical periods of maximum fear (buying opportunities) and greed (selling signals).
People tend to have short memories, especially when it comes to the emotional rollercoaster ride we call the stock market. Thanks to globalization, the internet, and the 24/7 news cycle, we are bombarded with some fear factor to worry about every day. Although I might forget what I had for breakfast, I have been a student of financial market history and have experienced enough cycles to realize as Mark Twain famously stated, “History never repeats itself, but it often rhymes” (read previous market history article). In that vein, let us take a look at a few covers from the 1970s:

Newsweek’s “The Big Bad Bear” issue came out on September 9, 1974 when the collapse of the so-called “Nifty Fifty” (the concentrated set of glamour stocks or “Blue Chips”) was in full swing. This group of stocks, like Avon, McDonalds, Polaroid, Xerox, IBM and Disney, were considered “one-decision” stocks investors could buy and hold forever. Unfortunately, numerous of these hefty priced stocks (many above a 50 P/E) came crashing down about 90% during the1973-74 period.
Why the glum sentiment? Here are a few reasons:
- Exiting Vietnam War
- Undergoing a Recession
- 9% Unemployment
- Arab Oil Embargo
- Watergate: Presidential Resignation
- Franklin National Failure

A cartoon from the same bearish 1974 cover article.
Not a rosy backdrop, but was this scary and horrific phase the ideal time to sell, as the magazine cover may imply? No, actually this was a shockingly excellent time to purchase equities. The Dow Jones Industrial Average, priced at 627 when the magazine was released, is now trading around 10,247…not too shabby a return considering the situation looked pretty darn bleak at the time.
Reports of the Market’s Death Greatly Exaggerated

Sticking with the Mark Twain theme, the reports of the market’s demise was greatly exaggerated too – much the same way we experienced the overstated reaction to the financial crisis early in 2009. BusinessWeek’s August 13, 1979 magazine captured the essence of the bearish mood in the article titled, “The Death of Equities.” This article came out, of course, about 18 months before a multi-decade upward explosion in prices that ended in the “Dot-com” crash of 2000. In the late 1970s, inflation reached double digit levels; gold and oil had more than doubled in price; Paul Volcker became the Federal Reserve Chairman and put on the economic brakes via a tough, anti-inflationary interest rate program; and President Jimmy Carter was dealing with an Iranian Revolution that led to the capture of 63 U.S. hostages. Like other bear market crashes in our history, this period also served as a tremendous time to buy stocks. As you can see from the chart above, the Dow was at 833 at the time of the magazine printing – in the year 2000, the Dow peaked at over 14,000.
This walk down memory lane is not complete. Conveniently, the Back to the Future story was designed as a trilogy (just like my three-part magazine review). You can relive Parts II & III here: Magazine Covers Part II – – – Magazine Covers Part III
Wade W. Slome, CFA, CFP®
Plan. Invest. Prosper.
DISCLOSURE: Sidoxia Capital Management (SCM) has a short position in MCD at the time this article was originally posted. SCM owns certain exchange traded funds, IBM, and DIS, but currently has no direct position in Avon (AVP), Polaroid, Xerox (XRX). No information accessed through the Investing Caffeine (IC) website constitutes investment, financial, legal, tax or other advice nor is to be relied on in making an investment or other decision. Please read disclosure language on IC “Contact” page.
Stock Talk: The Value of Media in Finance

I recently caught up with 50-year investment veteran Bill Kort to answer his questions regarding the media’s impact on the financial industry. After working for Kidder Peabody, A.G. Edwards, Wachovia, and Wells Fargo, Bill called it quits and decided to retire. Besides enjoying retirement with his wife, children, and grandchildren, Bill now also devotes considerable time to his blog Kort Sessions (www.KortSessions.com).
In a recent interview published on his Kort Sessions blog (KS), here’s what we discussed:
KS: Today, when you recommend a client take on, or increase equity exposure, what are the most common push-backs that you get? Have these changed in the past few years? If so, could you explain.
Wade Slome: “Given the events that have transpired over the last 15 years, I expect to receive a healthy dosage of pushback. Many investors have naturally been scarred from the 2008-2009 Financial Crisis, so convincing certain people that the 100-year flood will not occur every 100 days can be challenging. Regardless of the skepticism I receive, I feel it’s my duty to provide the best possible advice I can to existing clients and prospective clients. I can lead a horse to water, but I believe it’s not my job to force clients into a single investment option. At Sidoxia, we customize investment plans that meet clients’ risk tolerances, time horizons, and overall objectives.
With regard to sentiment changes in recent years, it is true that the tripling in equity market values since early 2009 has changed investor moods. Risk appetites have definitely increased. Nevertheless, cynicism is still rampant. Surveys done by Gallup show that stock ownership is near 15-year lows and despite stocks at or near record highs, ICI fund flow data shows money fleeing U.S. stock funds in 2014. With generational low interest rates, I see many long-term investors being too imprudently conservative. However, on the other hand, my responsibility is to also prevent other clients from taking on too much risk, especially if they have shorter investment time horizons or have limited funds in retirement.”
KS: When you speak with clients today, what are prominent worries do they have about their investments: The general level of the market, valuation, the economic backdrop, U.S. political issues or geopolitical concerns (all of the above)? Could you rank or tell me which concerns seem to be paramount.
Wade Slome: “In this 24-hour news cycle society we live in, an avalanche of real-time data gets crammed down our throats daily through our smartphones and Twitter-Facebook pages. As a result, the overwhelming barrage of news gets disseminated instantaneously, which in turn spreads fear like wildfire by word of mouth. In this type of environment it comes as no surprise to me that the general public is on edge. Every molehill is made into a mountain by media outlets for a simple reason…fear sells! Before the internet 20 years ago, virtually no one could find the location of Cyprus, Syria, Ukraine, or Gaza on a map – now we have Google and Wikipedia to show us or the Twitter feed scrolling at the bottom of our television sets reminds us. As far as concerns go, it’s tough to rank which ones are paramount. One day it’s the elections or Iran, and then the other day it’s the stock market crashing or the Ebola virus. Eventually the emotional pendulum will swing from fear and pessimism to optimism and euphoria, it always does. Like a lot of different professions, one of best strengths to have as an investment manager is the experience in knowing what noise to filter out and the ability to identify the relevant factors that drive outperformance.”
KS: Could you share the short-form responses that you might give to your clients when addressing the aforementioned issues.
Wade Slome: “The best advice I can give investors is to ignore the headlines. This principle is just as true today as it was a century or two ago. Mark Twain famously said, “If you don’t read the newspaper, you are uninformed. If you do read the newspaper, you are misinformed.” This is obviously presented a little tongue-in-cheek, but the main point being is headlines should not drive your investment decisions. It’s perfectly fine to be informed about the economy and politics, but people must realize the stock market often moves independently and in contrarian directions to prevailing media stories. Rather than emotionally react to news flow, it is much more important to create an objective, long-term investment plan that takes advantage of market noise, hype, and volatility.”
KS: Finally, this is a little bit of a leading question that I hope you might run with. Do you find any useful purpose being served by the financial, general or political media that might aid an individual’s investment process?
Wade Slome: “In my view of the financial markets, there are a few underlying principles that drive stock prices over the long-term, and they include such basic factors as earnings, valuations, interest rates, and market psychology. What I would objectively try to argue is that the financial, general, or political media have little to no impact on the first three factors and only modest influence on the last one (market psychology). Part of the reason I have been so constructive on the markets on my Investing Caffeine blog over the last five years is because all these factors have generally pointed in the right direction. I will become nervous when earnings decline, valuations get stretched, interest rates spike, and/or psychology turns euphoric. Right now, I don’t think we are seeing any of that occurring.
With that said, I do believe there are exceptions to the rule that the “media is evil.” If you have the time, interest, and patience to stagger through the endless desert of financial media, you can find a few rare flowers. Although I do consume mass amounts of media, 99% of it ends up in the trash or ignored. I do my best to reserve my media consumption to those successful investors who have lived through multiple market cycles and have a winning track record to back it up. It is possible to find sage investment bloggers; Warren Buffett interviews on CNBC; or newspaper interviews of thriving venture capitalists, if you properly dine on a healthy media diet. Unfortunately there is a lot of junk food financial content out in media land. What should generally be avoided at all costs are rants from economists, journalists, analysts, commentators, and talking heads. No matter how eloquent or articulate they may sound, the vast majority of the people you see on television have not invested a professional dime in their careers, so all you are getting from them are worthless, vacillating opinions. I choose to stick to commentary from the tried and true investment veterans.”
Bill, thanks again for the thoughtful interview questions, and continued success with your Kort Sessions blog!
Wade W. Slome, CFA, CFP®
Plan. Invest. Prosper.
DISCLOSURE: Sidoxia Capital Management (SCM) and some of its clients own GOOG/GOOGL, and a range of positions in certain exchange traded fund positions, but at the time of publishing SCM had no direct position in TWTR, FB, WFC, or any other security referenced in this article. No information accessed through the Investing Caffeine (IC) website constitutes investment, financial, legal, tax or other advice nor is to be relied on in making an investment or other decision. Please read disclosure language on IC Contact page.
Is the Stock Market Rigged? Yes…In Your Favor

Is the Market Rigged? The short answer is “yes”, but unlike gambling in Las Vegas, investing in the stock market rigs the odds in your favor. How can this be? The market is trading at record highs; the Federal Reserve is artificially inflating stocks with Quantitative easing (QE); there is global turmoil flaring up everywhere; and author Michael Lewis says the stock market is rigged with HFT – High Frequency Traders (see Lewis Sells Flash Boys Snake Oil). I freely admit the headlines have been scary, but scary headlines will always exist. More importantly for investors, they should be more focused on factors like record corporate profits (see Halftime Adjustments); near generationally-low interest rates; and reasonable valuation metrics like the price-earnings (P/E) ratios.
Even if you were to ignore these previously mentioned factors, one can use history as a guide for evidence that stocks are rigged in your favor. In fact, if you look at S&P 500 stock returns from 1928 (before the Great Depression) until today, you will see that stock prices are up +72.1% of the time on average.
If the public won at such a high rate in Las Vegas, the town would be broke and closed, with no sign of pyramids, Eiffel Towers, or 46-story water fountains. There’s a reason Las Vegas casinos collected $23 billion in 2013 – the odds are rigged against the public. Even Shaquille O’Neal would be better served by straying away from Vegas and concentrating on stocks. If Shaq could have improved his 52.7% career free-throw percentage to the 72.1% win rate for stocks, perhaps he would have earned a few more championship rings?
Considering a 72% winning percentage, conceptually a “Buy-and-Hold” strategy sounds pretty compelling. In the current market, I definitely feel this type of strategy could beat most market timing and day trading strategies over time. Even better than this strategy, a “Buy Winners-and-Hold Winners” strategy makes more sense. In other words, when investing, the question shouldn’t revolve around “when” to buy, but rather “what” to buy. At Sidoxia Capital Management we are primarily bottom up investors, so the appreciation potential of any security in our view is largely driven by factors such as valuation, earnings growth, and cash flows. With interest rates near record lows and a scarcity of attractive alternatives, the limited options actually make investing decisions much easier.
Scarcity of Alternatives Makes Investing Easier
U.S. investors moan and complain about our paltry 2.42% yield on the 10-Year Treasury Note, but how appetizing, on a risk-reward basis, does a 2.24% Irish 10-year government bond sound? Yes, this is the same country that needed a $100 billion+ bailout during the financial crisis. Better yet, how does a 1.05% yield or 0.51% yield sound on 10-year government treasury bonds from Germany and Japan, respectively? Moreover, what these minuscule yields don’t factor in is the potentially crippling interest rate risk investors will suffer when (not if) interest rates rise.
Fortunately, Sidoxia’s client portfolios are diversified across a broad range of asset classes. The quantitative results from our proprietary 5,000 SHGR (“Sugar”) security database continue to highlight the significant opportunities in the equities markets, relative to the previously discussed “bubblicious” parts of the fixed income markets. Worth noting, investors need to also remove their myopic blinders centered on U.S. large cap stocks. These companies dominate media channel discussions, however there are no shortage of other great opportunities in the broader investment universe, including such areas as small cap stocks, floating-rate bonds, real estate, commodities, emerging markets, alternative investments, etc.
I don’t mind listening to the bearish equity market calls for stock market collapses due to an inevitable Fed stimulus unwind, mean reverting corporate profit margins, or bubble bursting event in China. Nevertheless, when it comes to investing, there is always something to worry about. While there is always some uncertainty, the best investors love uncertainty because those environments create the most opportunities. Stocks can and eventually will go down, but rather than irresponsibly flailing around in and out of risk-on and risk-off trades to time the market (see Market Timing Treadmill), we will continue to steward our clients’ money into areas where we see the best risk-reward prospects.
For those other investors sitting on the sidelines due to market fears, I commend you for coming to the proper conclusion that stock markets are rigged. Now you just need to understand stocks are rigged for you (not against you)…at least 72% of the time.
Wade W. Slome, CFA, CFP®
Plan. Invest. Prosper.
DISCLOSURE: Sidoxia Capital Management (SCM) and some of its clients hold a range of exchange traded fund positions, but at the time of publishing SCM had no direct position in any other security referenced in this article. No information accessed through the Investing Caffeine (IC) website constitutes investment, financial, legal, tax or other advice nor is to be relied on in making an investment or other decision. Please read disclosure language on IC Contact page.
Day Trading Your House

By several measures, this economic recovery has been the slowest, most-challenging expansion since World War II. Offsetting the painfully slow recovery has been a massive bull market in stocks, now hovering near all-time record highs, after about tripling in value since early 2009. Unfortunately, many investors have missed the boat (see Markets Soar – Investors Snore and Gallup Survey) with stock ownership near a 15-year low.
But it’s not too late for the “sideliners” to get in…is it? (see Get out of Stocks!*). Milfred and Buford are asking themselves that same question (see Investor Wake-Up Call). Milfred and Buford are like many other individuals searching for the American Dream and are looking for ways to pad their retirement nest egg. The seasoned couple has been around the block a few times and are somewhat familiar with one get-rich-quick strategy…day trading stocks. Thankfully, they learned that day trading stocks didn’t work out too well once the technology boom music ended in the late 1990s. Here’s what the SEC has to say about day trading on their government site:
Be prepared to suffer severe financial losses. Day traders typically suffer severe financial losses in their first months of trading, and many never graduate to profit-making status. Given these outcomes, it’s clear: day traders should only risk money they can afford to lose. They should never use money they will need for daily living expenses, retirement, take out a second mortgage, or use their student loan money for day trading.
Milfred & Buford Day Trade House
Milfred: “Now, Buford, I know we lost of our IRA retirement money day trading tech stocks, but if technical analysis works and all the financial news shows and talking babies on TV say it will make us a lot of cabbage, maybe we should try day trading our house?”
Buford: “Now I know why I married you 60 years ago – it’s that brilliant mind of yours that complements that sexy figure!”
Veteran readers of Investing Caffeine know I’ve been a skeptic of technical analysis (see Technical Analysis: Astrology or Lob Wedge), but a successful investor has to be open to new ideas, correct? So, if technical analysis works for stocks, then why not for houses? The recovery in housing prices hasn’t been nearly as robust as we’ve seen in stocks, so perhaps there’s more upside in housing. If I can get free stock charting technicals from my brokerage firm or online, there’s no reason I couldn’t access free charting technicals from Zillow (or Trulia) to make my fortunes. Case in point, I think I see a double-bottom and reverse head-and-shoulders pattern on the home price chart of Kim Kardashian’s house:
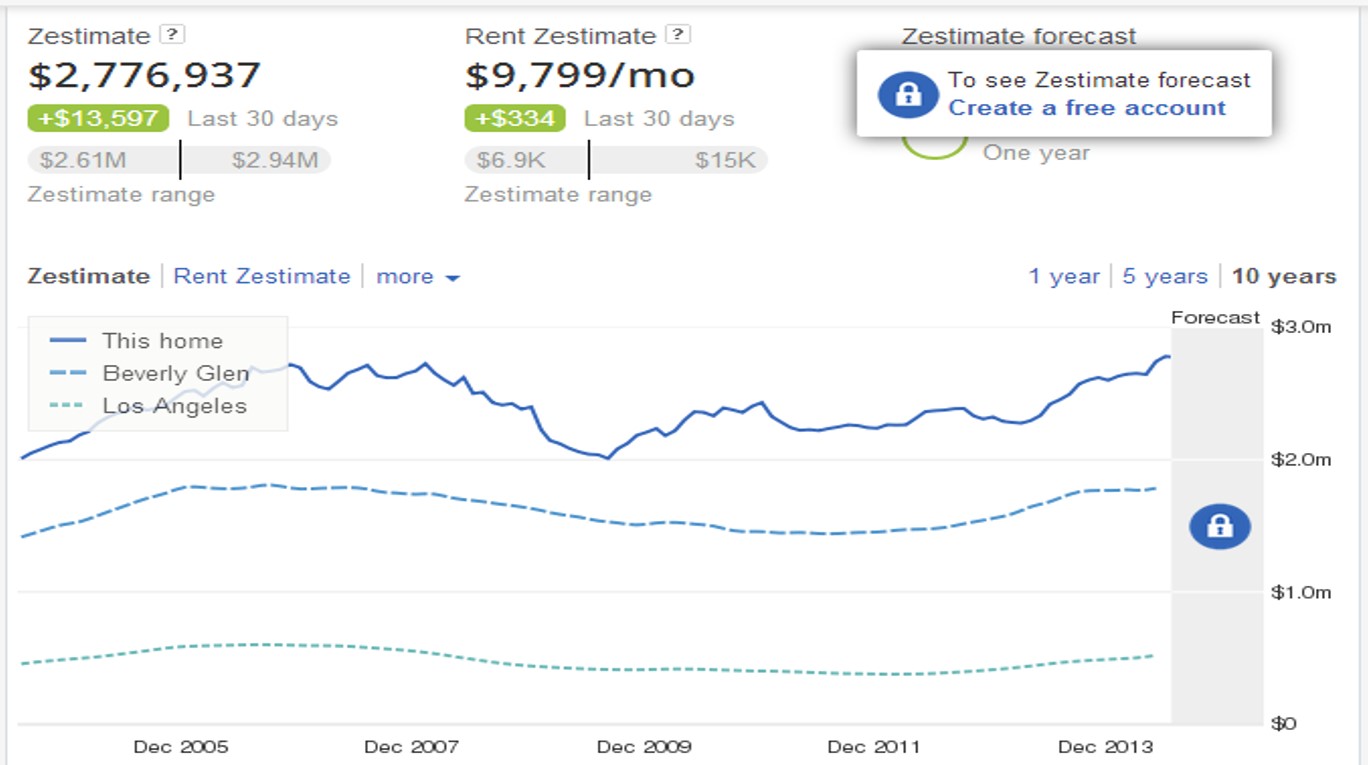
Source: Zillow
Of course, day trading isn’t solely dependent on random chart part patterns. Pundits, bloggers, and brokerage firms would also have you believe instant profits are attainable by trading based on the flow of news headlines. This is how Milfred and Buford would make their millions:
Milfred: “Snookums, it’s time for you to pack up all our stuff.”
Buford: “Huh? What are you talking about honey buns?”
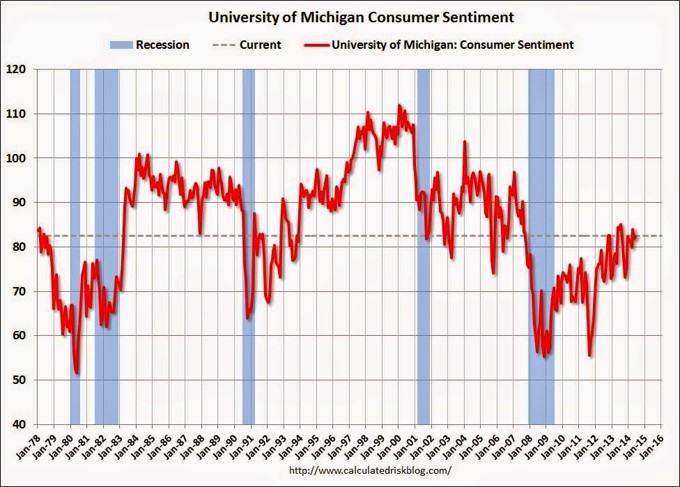
Milfred: “Didn’t you see?! The University of Michigan consumer confidence index fell to a level of 81.3 vs. Wall street estimates of 83.0, bringing this measure to a new 4-month low.”
Buford: “I can’t believe I missed that. Nice catch ‘hun’. I’ll start packing, but where will we stay after we sell the house?”
Milfred: “We can hang out at the Motel 6, but it shouldn’t be long. I’m expecting the Philly Fed Manufacturing index to come in above 23 and I also expect a cease fire in Ukraine and Gaza. We can buy a new house then.”
I obviously frame this example very tongue-in-cheek, but buying and selling a house based on squiggly lines and ever-changing news headlines is as ridiculous as it sounds for trading stocks. The basis for any asset purchase or sale should be primarily based on the cash flow dynamics (e.g., rent, dividends, interest, etc., if there are any) of the asset, coupled with the appreciation/depreciation expectations based on a rigorous long-term analysis.
When Day Trading Works
Obviously there are some differences between real estate and stocks (see Stocks & Real Estate), including the practical utility of real estate and other subjective factors (i.e., proximity to family, schools, restaurants, beach, crime rates, etc.). Real estate is also a relatively illiquid and expensive asset to buy or sell compared to stocks. – However, that dynamic is rapidly changing. Like we witness in stocks, technology and the internet is making real estate cheaper and easier to match buyers and sellers.
Does day trading a stock ever work? Sure, even after excluding the factor of luck, having a fundamental information advantage can lead to immediate profits, but one must be careful how they capture the information. Raj Rajaratnam used this strategy but suffered the consequences of his insider trading conviction. Furthermore, the information advantage game can be expensive, as proven by Steven Cohen’s agreement to pay $1.2 billion to settle criminal charges. While I remain a day trading and technical analysis skeptic, I have noted a few instances when I use it.
Whatever your views are on the topics of day trading and technical analysis, do Milfred and Buford a favor by leading by example…invest for the long-term.
Wade W. Slome, CFA, CFP®
Plan. Invest. Prosper.
DISCLOSURE: Sidoxia Capital Management (SCM) and some of its clients hold long positions in certain exchange traded funds, but at the time of publishing SCM had no direct position in Z, TRLA, or any other security referenced in this article. No information accessed through the Investing Caffeine (IC) website constitutes investment, financial, legal, tax or other advice nor is to be relied on in making an investment or other decision. Please read disclosure language on IC Contact page.
The Thrill of the Chase

Men (and arguably women to a lesser extent) enjoy the process of hunting for a mate. Chasing the seemingly unattainable event aligns with man’s innate competitive nature. But the quest for the inaccessible is not solely limited to dating. When it comes to other aspirational categories, humans also want what they cannot have because they revel in a challenge. Whether it’s a desirable job, car, romantic partner, or even an investment, people bask in the pursuit.
For many investment daters and trading speculators, 2008-2009 was a period of massive rejection. Rather than embracing the losses as a new opportunity, many wallowed in cash, CDs, bonds, and/or gold. This strategy felt OK until the massive 5-year bull market went on a persistent, upward tear beginning in 2009. Now, as the relentless bull market has continued to set new all-time record highs, the negative sentiment cycle has slowly shifted in the other direction. Back in 2009, many investors regretted owning stocks and as a result locked in losses by selling at depressed prices. Now, the regret of owning stocks has shifted to remorse for not owning stocks. Missing a +23% annual return for five years, while getting stuck with a paltry 0.25% return in a savings account or 3-4% annual return achieved in bonds, can harm the psyche and make savers bitter.
Greed hasn’t fully set in like we witnessed in the late period of the 1990s tech boom, but nevertheless, some of the previous overly cautious “sideliners” feel compelled to now get into the stock game (see Get Out of Stocks!*) or increase their equity allocation. Like a desperate, testosterone-amped teen chasing a prom date, some speculators are chasing stocks, regardless of the price paid. As I’ve noted before, the overall valuation of the stock market seems quite reasonable (see PE ratio chart in Risk Aversion Declining – S. Grannis), despite selective pockets of froth popping up in areas like biotech stocks, internet companies, and junk bonds.
Even if chasing is a bad general investment practice, in the short-run, chasing stocks (or increasing equity allocations) may work because overall prices of stocks remain about half the price they were at the 2000 bubble peak (see Siegel Bubblicious article). How can stocks be -50% off when stock prices today (S&P 500) are more than +25% higher today than the peak in 2000? Plain and simply, it’s the record earnings (see It’s the Earnings Stupid). In the latest Sidoxia newsletter we highlighted the all-time record corporate profits, which are conveniently excluded from most stock market discussions in the blogosphere and other media outlets.
The Investor’s Emotional Roller Coaster (Perceived Risk vs Actual Risk)
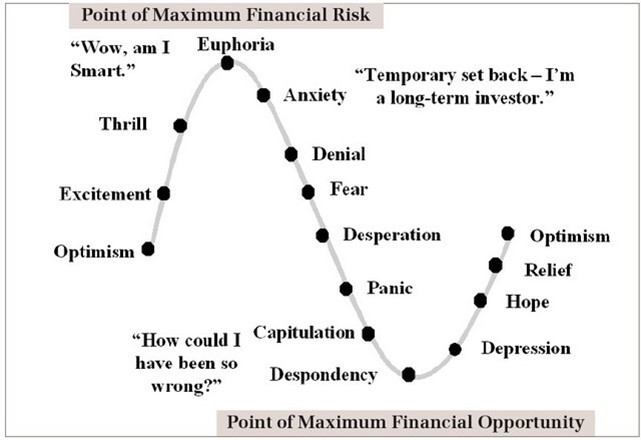
The “Thrill of the Chase” is but a single emotion on the roller coaster sentiment spectrum (see Barry Ritholtz chart in Sentiment Cycle of Fear and Greed). The problem with the above chart is many investors confuse actual risk from perceived risk. Many investors perceive the “euphoric” stage of an economic cycle (top of the chart) as low-risk, when in actuality this point reflects peak risk. One can look back to the late 1990s and early 2000 when technology shares were priced at more than 100x years in earnings and every hairdresser, cabdriver and relative were plunging their life savings into stocks. The good news from my vantage point is we are a ways from that euphoric state (asset fund flows and consumer confidence are but a few data points to support this assertion).
The key to reversing the sentiment roller coaster is to follow the thought process of investment greats who learned to avoid euphoria in up markets:
“I’m always more depressed by an overpriced market in which many stocks are hitting new highs every day than by a beaten-down market in a recession.” -Peter Lynch
“Be fearful when others are greedy, and be greedy when others are fearful.” –Warren Buffett
While the “Thrill of the Chase” can seem exciting and a rational strategy at the time, successful long-term investors are better served by remaining objective, unemotional, and numbers-driven. If you don’t have the time, interest, or emotional fortitude to be disciplined, then find an experienced investment manager or advisor to assist you. That will make your emotional roller coaster ride even more thrilling.
Wade W. Slome, CFA, CFP®
Plan. Invest. Prosper.
DISCLOSURE: Sidoxia Capital Management (SCM) and some of its clients hold long positions in certain exchange traded funds, but at the time of publishing SCM had no direct position in any other security referenced in this article. No information accessed through the Investing Caffeine (IC) website constitutes investment, financial, legal, tax or other advice nor is to be relied on in making an investment or other decision. Please read disclosure language on IC Contact page.
The Buyback Bonanza Boost

With the S&P 500 off -1% from its all-time record high, many bears have continued to wait for and talk about a looming crash. For the naysayers, the main focus has been on the distorted monetary policies instituted by the Federal Reserve, but as I pointed out in Fed Fatigue is Setting In, QE and tapering talk are not the end-all, be-all of global financial markets. One need not look further than the dozen or so countries listed in the FT that have bond yields below the abnormally low yields we are experiencing in the U.S. (10-Year Treasury +2.75%).
Although there are many who believe a freefall is coming, much like a trampoline, a naturally occurring financial mechanism has provided a relentless bid to boost stock prices higher…a buyback bonanza! How significant have corporate stock repurchases been to spring prices higher? Jason Zweig, in his Intelligent Investor column, wrote the following:
In the Russell 3000, a broad U.S. stock index, repurchased $567.6 billion worth of their own shares—a 21% increase over 2012, calculates Rob Leiphart, an analyst at Birinyi Associates, a research firm in Westport, Conn. That brings total buybacks since the beginning of 2005 to $4.21 trillion—or nearly one-fifth of the total value of all U.S. stocks today.
To further put this gargantuan buyback bonanza into perspective, a recent Fox Business article described it this way:
Companies spent an estimated $477 billion on share buybacks last year. That’s enough to buy every NFL team 12 times over, run the federal government for 50 days or host the next nine Olympic Games with several billion left to spare. This year, companies are expected to ramp up buybacks by 35%, according to Goldman Sachs.
The bears continue to scream, while purple in the face, that the Fed’s QE and zero interest rate program (ZIRP) shenanigans are artificially propping up stock prices. The narrative then states the tapering and inevitable Fed Funds rate reversal will cause the market to come crashing down. While there is some truth behind this commentary, history reminds us that not all rate rising cycles end in bloodshed (see 1994 Bond Repeat or Stock Defeat?). Even if you believe in Armageddon, this rate reversal scenario is unlikely to happen until mid-2015 or beyond.
And for those worshipping the actions of Ms. Yellen at the Fed altar, believe it or not, there are other factors besides monetary policy that cause stock prices to go up or down. In addition to stock buybacks, there are dynamics such as record corporate profits, rising dividends, expanding earnings, reasonable valuations, improving international economies, and other factors that have contributed to this robust bull market.
At the end of the day, as I have continued to argue for some time, money goes where it is treated best – and generally that is not in savings accounts earning 0.003%. There is no reason to be a perma-bull, and I have freely acknowledged the expansion of froth in areas such as social media, biotech, Bitcoin and other areas. Regardless, there is, and will always be areas of speculation, in bull and bear markets (e.g., gold in the 2008-2009 period).
Magical Math
Investing involves a mixture of art and science, but with a few exceptions (i.e., fraud), numbers do not lie, and using math when investing is a good place to start. A simple but powerful mathematical formula instituted at Sidoxia Capital Management is the “Free Cash Flow Yield”, which is a metric we integrate into our proprietary SHGR (a.k.a.,“Sugar”) quantitative model (see Investing Holy Grail).
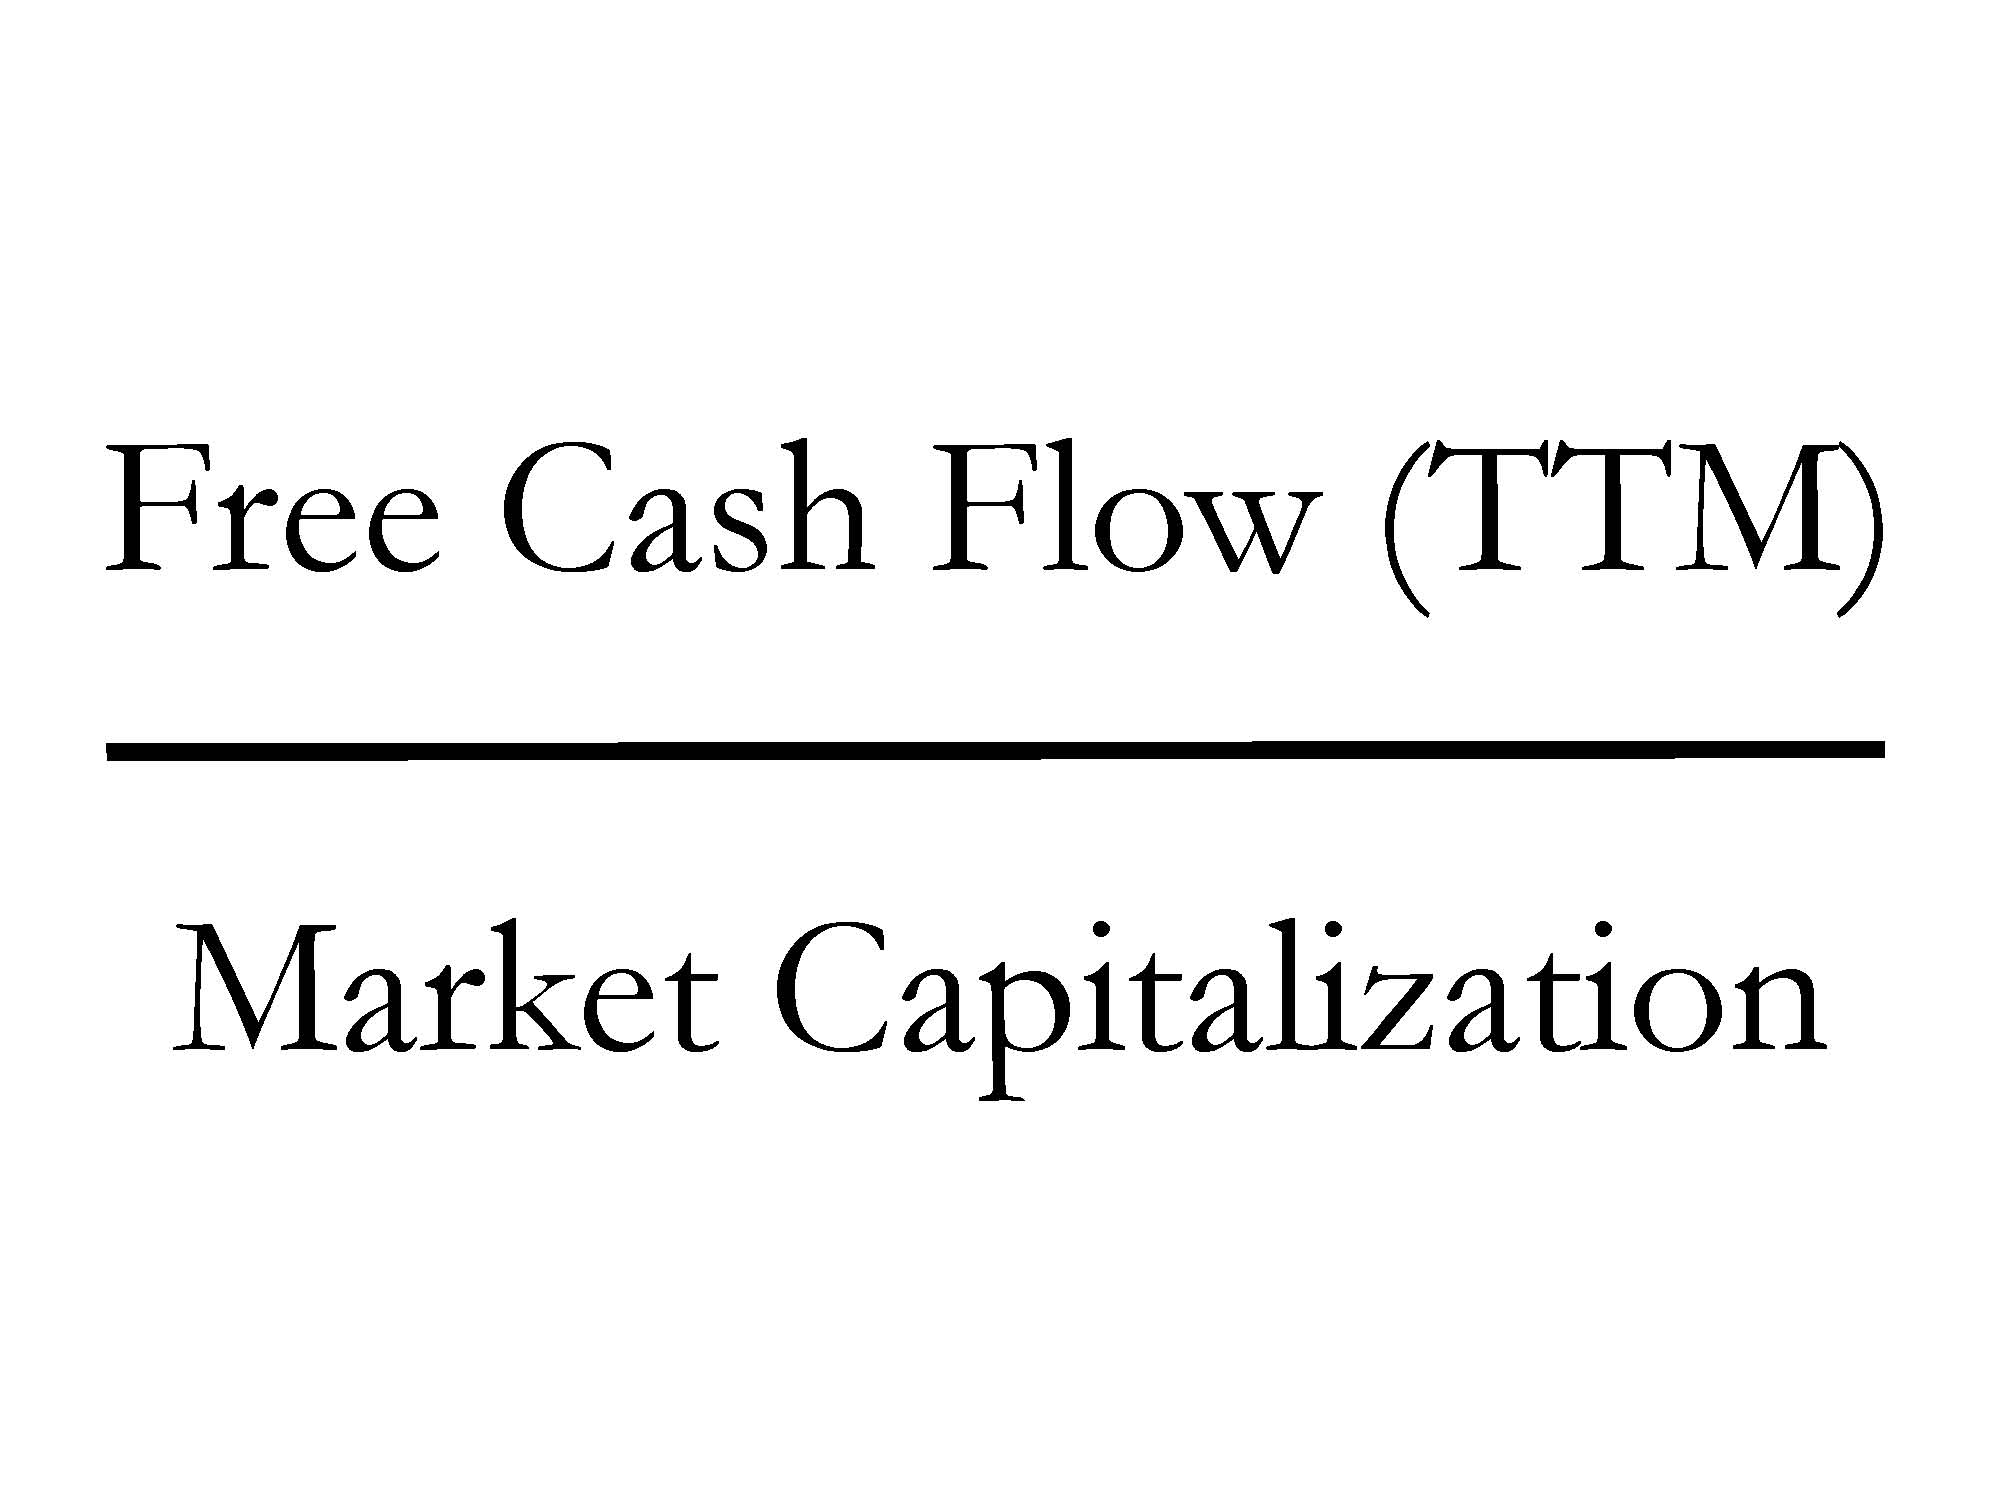
Quite simply, Free Cash Flow (FCF) is computed by taking the excess cash generated by a company after ALL expenses/expenditures (marketing, payroll, R&D, CAPEX, etc.) over a trailing twelve month period (TTM), then dividing that figure by the total equity value of a company (Market Capitalization). Mechanically, FCF is calculated by taking “Cash Flow from Operations” and subtracting “Capital Expenditures” – both figures can be found on the Cash Flow Statement. The Free Cash Flow ratio may sound complicated, but straightforwardly this is the leftover cash generated by a business that can be used for share buybacks, dividends, acquisitions, investments, debt pay-down, and/or placed in a banking account to pile up.
The great thing about FCF yields is that this ratio (%) can be compared across asset classes. For example, I can compare the FCF yield of Apple Inc – AAPL (+9.5%) versus a 10-Year Treasury (+2.75%), 1-year CD (+0.85%), Tesla Motors – TSLA (0.0%), Netflix, Inc – NFLX (-0.001%), or Twitter, Inc – TWTR (-0.003%). For growth and capital intensive companies, I can make adjustments to this calculation. However, what you quickly realize is that even if you assume massive growth in the coming years (i.e., $100s of millions in FCF), the prices for many of these momentum stocks are still astronomical.
An important insight about the current corporate buyback bonanza is that much of this price boost is being fueled by the colossal free cash flow generation of corporate America. Sure, some companies are borrowing through the debt markets to buy back stock, but if you were the Apple CFO sitting on $159,000,000,000 in cash earning 1%, it doesn’t make a lot of sense to sit on the cash earning nothing. It also doesn’t take a genius (or Carl Icahn) to figure out borrowing at record low rates (2.75% 10-year) while earning +10% on a stock buyback will increase shareholder value and earnings per share (EPS). More specifically, when Apple borrowed $17 billion at interest rates ranging from 0.5% – 3.9%, a shrewd, rational human being would borrow to the max all day long at those rates, if you could earn +10% on that investment. It is true that Apple’s profitability could drop and the numerator in our FCF ratio could decrease, but with $45 billion smackers coming in every year on top of $142 billion in net cash on the balance sheet, Apple has a healthy margin of safety to make the math work.
Where the math doesn’t compute is in insanely priced deals. For example, the recent merger in which Facebook Inc (FB) paid $19 billion (1,000 x’s the estimated 2013 annual revenues) for a 50-person, money-losing company (WhatsApp) that is offering a free service, makes zero financial sense to me. Suffice it to say, the FCF yield on WhatsApp could cause Warren Buffett to have a coronary event. Yes, diamond covered countertops would be nice to have in my kitchen, but I probably wouldn’t get much of a return on that investment.
Share buybacks are not a magical elixir to endless prosperity (see Share Buybacks & Bathroom Violators), but given the record profits and record low interest rates, basic math shows that even if stock prices correct (as should be expected), the trampolining effect of this buyback bonanza will provide support to the market.
Wade W. Slome, CFA, CFP®
Plan. Invest. Prosper.
DISCLOSURE: Sidoxia Capital Management (SCM) and some of its clients hold long positions in certain exchange traded funds (ETFs), AAPL and a short position in NFLX, but at the time of publishing SCM had no direct position in TSLA, TWTR, FB, Bitcoin, or any other security referenced in this article. No information accessed through the Investing Caffeine (IC) website constitutes investment, financial, legal, tax or other advice nor is to be relied on in making an investment or other decision. Please read disclosure language on IC Contact page.
Investing, Housing, and Speculating

We all know there was a lot of speculation going on in the housing market during 2005-2007 as risk-loving adventurists loaded up on NINJA loans (No Income, No Job, and No Assets) and subprime CDS (Credit Default Swap) securities. But there is a different kind of speculation going on now, and it isn’t tied directly to housing. Instead of buying a house with no down payment and a no interest loan, speculators are leaping into other hazardous areas of danger. Like a frog jumping from lily pad to lily pad, speculators are now hopping around onto money-chasing industries, including biotech, social media, Bitcoin, and alternative energy.
As French novelist Jean-Baptise Alphonse Karr noted, “The more things change, the more they stay the same.” Irrespective of the painful consequences of the bubble-bursting aftermaths, human behavior and psychology addictively succumb to the ever-seductive emotion of greed. Over the last 15 years, massive fortunes have been gained and lost while chasing frothy financial dreams in areas like technology, housing, and gold.
Most get-rich-quick dream chasers have no idea of how to invest in or value a stock, but they sure know a good story when they hear one. Chasing top performing stocks is lot like jumping off a bridge – anyone can do it, and it feels exhilarating until you hit the ground. However, there is a better way to create wealth. Despite rampant speculation, most individuals understand the principles behind buying a house, which if applied to stocks, can make you a superior investor, and assist you in avoiding dangerous, speculative investments.
Here are some valuable housing insights to improve your stock buying:
#1.) Price is the Almighty Variable: Successful real estate investors don’t make their fortunes by chasing properties that double or triple in value. Buying a rusty tool shed for $1 million makes about as much sense as Facebook paying $19 billion (1,000 x’s the estimated 2013 annual revenues) for a money-losing company, WhatsApp. Better to buy real estate when there is blood in the street. Like the stock market, housing is cyclical. Many traders believe that price patterns are more important than the actual price. If squiggly, technical price moving averages (see Technical Analysis article) make so much money for stock-renting speculators, then how come day traders haven’t used their same crossing-lines and Point & Figure software in the housing market? Yes, it’s true that the real estate transactions costs and illiquidity can be costly for real estate buyers, but 6% load fees, lockup periods, 20% hedge fund fees, and 9% margin rates haven’t stopped stock speculators either.
#2). Cash is King: It doesn’t take a genius to purchase a rental property – I know because practically half the people I know in Southern California own rental properties. For example, if I buy a rental property for $1 million cash, is it a good purchase? Well, it depends on how much after-tax cash I can collect by renting it out? If I can only net $3,000 per month (3.6% annualized return), and be responsible for replacing roofs, fixing toilets, and evicting tenants, then perhaps I would be better off by collecting 6.5% from a low-cost, tax-efficient exchange traded real estate fund, without having to suffer from all the headaches that physical real estate investing brings. Forecasting future asset price appreciation is tougher, but the point is, understanding the underlying cash flow dynamics of a company is just as important as it is for housing purchases.
#3). Debt/Leverage Cuts in Both Directions: Adding debt (or leverage) to a housing or stock investment can be fantastic if prices go up, and disastrous if prices go down. Putting a 20% down payment on a $1 million house works out wonderfully, if the price of the house increases to $1.2 million. My $200,000 down payment is now worth $400,000, or up +100%. The same math works in reverse. If the price of the home drops to $800,000, then my $200,000 down payment is now worth $0, or down -100% (ouch). Margin debt on an equity brokerage account works in a similar fashion, but usually a 50% down payment is needed (less risky than real estate). That’s why I always chuckle when many real estate investors tell me they steer clear of stocks because they are “too risky”.
#4). Growth Matters: If you buy a home for $1 million, is it likely to be worth more if you add a kitchen, tennis court, swimming pull, third floor, and putting green? In short, the answer is yes. The same principle applies to stocks. All else equal, if a company based in Los Angeles, establishes new offices in New York, London, Beijing, and Rio de Janeiro, and then acquires a profitable competitor at a discounted price, chances are the company will be much more valuable after the additions. The key concept here is that asset values are not static. Asset valuations are impacted in both directions, whether we are talking about positive growth opportunities or negative disruptions.
Overall, speculatively chasing performance is tempting, but if you don’t want your financial foundation to crumble, then build your successful investment future by sticking to the fundamentals and financial basics.
Wade W. Slome, CFA, CFP®
Plan. Invest. Prosper.
DISCLOSURE: Sidoxia Capital Management (SCM) and some of its clients hold long positions in certain exchange traded funds (ETFs), but at the time of publishing SCM had no direct discretionary position in FB, Bitcoin, or any other security referenced in this article. No information accessed through the Investing Caffeine (IC) website constitutes investment, financial, legal, tax or other advice nor is to be relied on in making an investment or other decision. Please read disclosure language on IC Contact page.


