Posts tagged ‘Yield Curve’
Chinese Checkers or Chess?

There’s been a high stakes economic game of trade going on between the United States and China, but it’s unclear what actual game is being played or what the rules are? Is it Chinese checkers, chess, or some other game?
Currently, the rules of the U.S.-China trade war game are continually changing. Most recently, the U.S. has implemented 15% in added tariffs (on approximately $125 billion in Chinese consumer imports) on September 1st. The president and his administration appreciate the significance of trade negotiations, especially as it relates to his second term reelection campaign, which is beginning to swing into full gear. However, game enthusiasts also understand you can’t win or truly play a game, if you don’t know the rules? In that same vein, investors have been confused about the U.S.-China trade game as the president’s Twitter account has been blowing up with tariff threats and trade discussion updates. As a negotiating tactic, the current unpredictable trade talks spearheaded by the Trump administration have been keeping investors guessing whether there will be a successful deal payoff. Until then, market participants have been sitting on the sidelines watching the stock market volatility unfold, one tweet at a time.
Here’s what the president has planned for other tariffs:
- October 1: Tariffs on $250 billion in Chinese goods rise to 30%.
- November 17: Europe auto tariff deadline.
- December 15: 15% tariffs on $160 billion in Chinese goods.
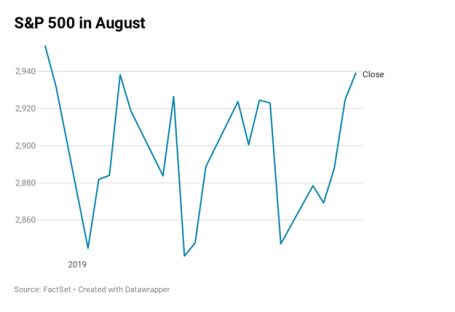
This uncertain game translated into all the major stock market averages vacillating to an eventual decline last month, with a price chart resembling a cardiogram. More specifically, after bouncing around wildly, the S&P 500 decreased -1.8% last month (see chart below), the Dow Jones Industrial Average dropped -1.7%, and the tech-heavy Nasdaq fell -2.6%.
Politically, there is bipartisan support to establish new trade rules and there is acknowledgement that China has been cheating and breaking trade rules for decades. The consensus among most constituencies is especially clear as it relates to Chinese theft of our intellectual property, forced technology transfer, and barriers for U.S. companies to invest in China.
Beyond trade talks, China has been stirring the geopolitical pot through its involvement in the political instability occurring in Hong Kong, which is a Special Administrative Region (SAR) of China. For over five months Hong Kong has had to deal with mass demonstration and clashes with police primarily over a proposed extradition bill that Hong Kong people fear would give mainland China control and jurisdiction over the region. Time will tell whether the protests will allow Hong Kong to remain relatively independent, or the Chinese Communist party will eventually lose patience and use an authoritarian response to the protesters.
Inverted Yield Curve: Fed No Longer Slamming Breaks in Front of Feared Recession
Another issue contributing to recent financial market volatility has been the so-called “inverted yield curve.” Typically, an economic recession has been caused by the Federal Reserve slamming the breaks on an overheated economy by raising short-term interest rates (Federal Funds target rate). Historically, as short-term rates rise and increase borrowing costs (i.e., slow down economic activity), long-term interest rates eventually fall amid expected weak economic activity. When declining long-term interest rates fall below short-term interest rates…voila, you have an inverted yield curve. Why is this scary? Ever since World War II, history has informed us that whenever this phenomenon has occurred, this dynamic has been a great predictor for a looming recession.
What’s different this time? Unlike the past, is it possible the next recession can be averted or delayed? One major difference is the explosion in negative interest rate yielding bonds now reaching $17 trillion.
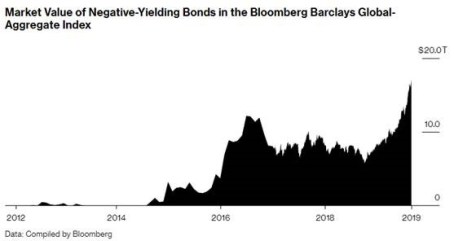
Yes, you read that correctly, investors are lining up in droves for guaranteed losses – if these bonds are held until maturity. This widespread perception as a move to perceived safety has not protected the U.S. from the global rate anchor sinking our long-term interest rates. United States interest rates have not turned negative (yet?), but rates have fallen by more than half over the last 10 months from +3.24% to +1.51% on the 10-Year Treasury Note. Will this stimulate businesses to borrow and consumers to buy homes (i.e., through lower cost mortgages), or are these negative rates a sign of a massive global slowdown? The debate continues, but in the meantime, I’m going to take advantage of a 0%-interest rate loan to buy me an 85″ big screen television for my new home!

Wade W. Slome, CFA, CFP®
Plan. Invest. Prosper.
This article is an excerpt from a previously released Sidoxia Capital Management complimentary newsletter (September 3, 2019). Subscribe on the right side of the page for the complete text.
DISCLOSURE: Sidoxia Capital Management (SCM) and some of its clients hold positions and certain exchange traded funds (ETFs), but at the time of publishing had no direct position in any other security referenced in this article. No information accessed through the Investing Caffeine (IC) website constitutes investment, financial, legal, tax or other advice nor is to be relied on in making an investment or other decision. Please read disclosure language on IC Contact page.
Glass Half Empty Becomes Record Glass Half Full

Oh my! What a difference a few months makes. Originally, what looked like an economic glass half empty in December has turned into a new record glass half full. What looked like Armageddon in December has turned into a v-shaped bed of roses to new all-time record stock market highs for the S&P 500 index (see chart below). For the recent month, the S&P 500 climbed another +3.9% to 2,945, bringing total 2019 gains to an impressive +17.5% advance. Before you get too excited, it’s worth noting stocks were down in value during 2018. When you combine 2018-2019, appreciation over the last 16 months equates to a more modest +10.2% expansion. Worth noting, since the end of 2017, profits have climbed by more than +20%, which means stocks are cheaper today as measured by Price-Earnings ratios (P/E) than two years ago (despite the historic, record levels). For any confused investors, we can revisit this topic for discussion in a future writing.

Source: Trading Economics
From Famine to Feast
As I noted in my “December to Remember” article, there were no shortage of concerns ranging from impeachment to Brexit. How do those concerns look now? Let’s take a look:
Government Shutdown: The longest government shutdown in history (35 days) ended on January 25, 2019 with minimal broad-based economic damage.
Global Trade (China): Rhetoric coming from President Trump and his administration regarding a trade deal resolution with China has been rather optimistic. In fact, a CNBC survey shows 77% of respondents believe that the U.S. and China will complete a trade deal.
Federal Reserve Interest Rate Policy: After consistently increasing interest rates nine times since the end of 2015 until late 2018, Federal Reserve Chairman Jerome Powell signaled he was effectively taking monetary policy off rate-hiking “autopilot” and would in turn become “patient” as it relates to increasing future interest rates. Interestingly, traders are now forecasting a 70% chance of a rate cut before January 29, 2020.
Mueller Investigation: Special counsel Robert Mueller released his widely anticipated report that investigated Russian collusion and obstruction allegations by the president and his administration. In Mueller’s 22-month report he could “not establish that members of the Trump Campaign conspired or coordinated with the Russian government in its election interference activities.” As it relates to obstruction, Mueller effectively stated the president attempted to obstruct justice but was not successful in achieving that goal. Regardless of your political views, uncertainty surrounding this issue has been mitigated.
New Balance of Power in Congress: Democrats took Congressional control of the House of Representatives and reintroduced gridlock. But followers of mine understand gridlock is not necessarily a bad thing.
Brexit Deal Uncertainty: After years of negotiations for Britain to exit the European Union (EU), the impending Brexit deadline of March 29th came and went. EU an UK leaders have now agreed to extend the deadline to October 31st, thereby delaying any potential negative impact from a hard UK exit from the EU.
Recession Fears: Fears of a fourth quarter global slowdown that would bleed to a recession on U.S. soil appear to have been laid to bed. The recently reported first quarter economic growth (Gross Domestic Product – GDP) figures came in at a healthy+3.2% annualized growth rate, up from fourth quarter growth of +2.2%, and above consensus forecasts of 2.0%.
Curve Concern
The other debate swirling around the investment community this month was the terrifying but wonky “inverted yield curve.” What is an inverted yield curve? This is a financial phenomenon, when interest rate yields on long-term bonds are lower than interest rate yields on short-term bonds. Essentially when these dynamics are in place, bond investors are predicting slower economic activity in the future (i.e., recession). The lower future rates effectively act as a way to stimulate prospective growth amid expected weak economic activity. Furthermore, lower future rates are a symptom of stronger demand for longer-term bonds. It’s counterintuitive for some, but higher long-term bond prices result in lower long-term bond interest rate yields. If this doesn’t make sense, please read this. Why is all this inverted yield curve stuff important? From World War II, history has informed us that whenever this phenomenon has occurred, it has been a great predictor for a looming recession.
As you can see from the chart below, whenever the yield curve (red line) inverts (goes below zero), you can see that a recession (gray vertical bar) occurs shortly thereafter. In other words, an inverted yield curve historically has been a great way to predict recessions, which normally is almost an impossible endeavor – even for economists, strategists, and investment professionals.

Source: Calafia Beach Pundit
Although the curve inverted recently (red line below 0), you can see from the chart, historically recessions (gray vertical bars) have occurred only when inflation-adjusted interest rates (blue line) have climbed above 2%. Well, the data clearly shows inflation-adjusted interest rates are still well below 1%, therefore an impending recession may not occur too soon. Time will tell if these historical relationships will hold, but rest assured this is a dynamic I will be following closely.
It has been a crazy 6-9 months in the stock market with price swings moving 20% in both directions (+/-), but it has become increasingly clear that a multitude of 2018 fears causing the glass to appear half empty have now abated. So long as economic growth continues at a healthy clip, corporate profits expand to (remain at) record levels, and the previously mentioned concerns don’t spiral out of control, then investors can credibly justify these record levels…as they peer into a glass half full.

Wade W. Slome, CFA, CFP®
Plan. Invest. Prosper.
This article is an excerpt from a previously released Sidoxia Capital Management complimentary newsletter (May 1, 2019). Subscribe on the right side of the page for the complete text.
DISCLOSURE: Sidoxia Capital Management (SCM) and some of its clients hold positions and certain exchange traded funds (ETFs), but at the time of publishing had no direct position in any other security referenced in this article. No information accessed through the Investing Caffeine (IC) website constitutes investment, financial, legal, tax or other advice nor is to be relied on in making an investment or other decision. Please read disclosure language on IC Contact page.
January a Ball After Year-End Fall

Investors were cheerfully dancing last month after the stock market posted its best January in 30 years and the best monthly performance since October 2015 (see chart below). More specifically, the S&P 500 index started the year by catapulting +7.9% higher (the best January since 1987), and the Dow Jones Industrial Average climbed 1,672 points to 25,000, or +7.2%. But over the last few months there has been plenty of heartburn and volatility. The December so-called Santa Claus rally did not occur until a large pre-Christmas pullback. From the September record high, stocks temporarily fell about -20% before the recent jolly +15% post-Christmas rebound.
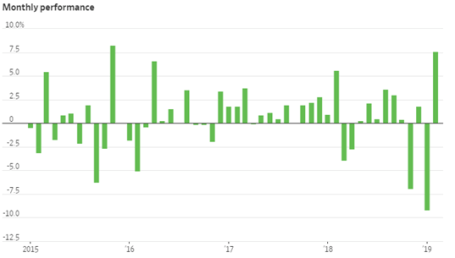
Source: FactSet via The Wall Street Journal
Although investors have been gleefully boogying on the short-run financial dance floor, there have been plenty of issues causing uncomfortable blisters. At the top of the list is China-U.S. trade. The world is eagerly watching the two largest global economic powerhouses as they continue to delicately dance through trade negotiations. Even though neither country has slipped or fallen since the 90-day trade truce, which began on December 1 in Buenos Aires, the stakes remain high. If an agreement is not reached by March 2, tariffs on imported Chinese goods would increase to 25% from 10% on $200 billion worth of Chinese goods, thereby raising prices for U.S. consumers and potentially leading to further retaliatory responses from Beijing.
When it comes to the subjects of intellectual property protection and forced technology transfers of American companies doing business in China, President Xi Jinping has been uncomfortably stepping on President Donald Trump’s toes. Nothing has been formally finalized, however Chinese officials have signaled they are willing to make some structural reforms relating to these thorny issues and have also expressed a willingness to narrow the trade deficit with our country by purchasing more of our exports. Besides procuring more American energy goods, the Chinese have also committed to buy 5,000,000 tons of our country’s soybeans to feed China’s hungry population of 1.4 billion people.
Reaching a trade settlement is important for both countries, especially in light of the slowing Chinese economy (see chart below) and the dissipating stimulus benefits of the 2018 U.S. tax cuts. Slowing growth in China has implications beyond our borders as witnessed by slowing growth in Europe as evidenced by protests we have seen in France and the contraction of German manufacturing (the first time in over four years). Failed Brexit talks of the U.K. potentially leaving the European Union could add fuel to the global slowdown fire if an agreement cannot be reached by the March 29th deadline in a couple months.
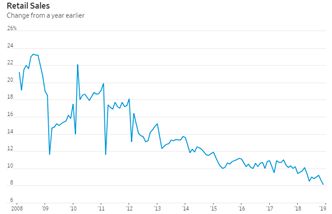
Source: Wind via The Wall Street Journal
While the temporary halt to the longest partial federal government shutdown in history (35 days) has brought some short-term relief to the 800,000 government workers/contractors who did not receive pay, the political standoff over border security may last longer than expected, which may further dampen U.S. economic activity and growth. Whether the hot-button issue of border wall funding is resolved by February 15th will determine if another shutdown is in the cards.
Despite China trade negotiations and the government shutdown deadlock placing a cloud over financial markets, brighter skies have begun to emerge in other areas. First and foremost has been the positive shift in positioning by the Federal Reserve as it relates to monetary policy. Not only has Jay Powell (Fed Chairman) communicated a clear signal of being “patient” on future interest rate target increases, but he has also taken the Fed off of “autopilot” as it relates to shrinking the Fed’s balance sheet – a process that can hinder economic growth. Combined, these shifts in strategy by the Fed have been enthusiastically received by investors, which has been a large contributor to the +15% rebound in stock prices since the December lows. Thanks to this change in stance, the inverted yield curve bogeyman that typically precedes post-World War II recessions has been held at bay as evidenced by the steepening yield curve (see chart below).
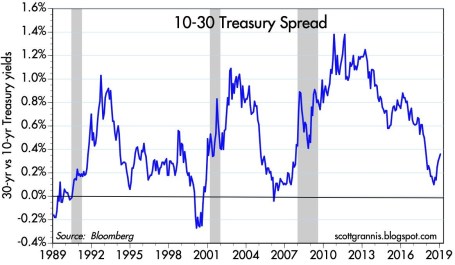
Source: Calafia Beach Pundit
Other areas of strength include the recent employment data, which showed 304,000 jobs added in January, the 100th consecutive month of increased employment. Fears of an imminent recession that penetrated psyches in the fourth quarter have abated significantly in January in part because of the notable strength seen in 4th quarter corporate profits, which so far have increased by +12% from last year, according to FactSet. The strength and rebound in overall commodity prices, including oil, seem to indicate any potential looming recession is likely further out in time than emotionally feared.
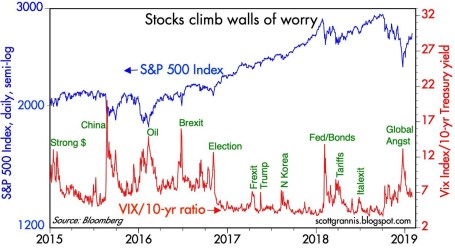
Source: Calafia Beach Pundit
As the chart above shows, over the last four years, spikes in fear (red line) have represented beneficial buying opportunities of stocks (blue line). The pace of gains in January is just as unsustainable as the pace of fourth-quarter losses were in stock prices. Uncertainties may remain on trade, shutdowns, geopolitics, and other issues but don’t throw away your investing dance shoes quite yet…the ball and music experienced last month could continue for a longer than expected period of time.

Wade W. Slome, CFA, CFP®
Plan. Invest. Prosper.
This article is an excerpt from a previously released Sidoxia Capital Management complimentary newsletter (February 1, 2018). Subscribe on the right side of the page for the complete text.
DISCLOSURE: Sidoxia Capital Management (SCM) and some of its clients hold positions and certain exchange traded funds (ETFs), but at the time of publishing had no direct position in any other security referenced in this article. No information accessed through the Investing Caffeine (IC) website constitutes investment, financial, legal, tax or other advice nor is to be relied on in making an investment or other decision. Please read disclosure language on IC Contact page.
Have Peripheral Colds Caused a U.S. Recession Flu?

At the trough of the recent correction, which was underscored by a brief but sharp -1,100 point drop in the Dow Jones Industrial Average, the Dow had temporarily corrected by -16.2% from its peak in May, earlier this year. Whether we retest or break below the 15,370 level again is debatable, but with the Dow almost reaching “bear market” (-20%) territory, it begs the question of whether the U.S. has caught a recessionary flu from the ill international markets’ colds?
Certainly, several factors have investors concerned about a potential recession, including the following: slowing growth and financial market instability in China; contraction of -0.4% in Japan’s Q2 GDP growth; and turmoil in emerging markets like Russia and Brazil. With stock prices down more than double digits, it appears investors factored in a significant chance of a recession occurring. Although the Tech Bubble of 2000 and generational Great Recession of 2008-2009 were no ordinary recessions, your more garden variety recessions like the 1980 and 1990 recessions resulted in peak to trough declines in the Dow Jones Industrial Average of -20.5% and -22.5%, respectively.
In other words, with the Dow recently down -16.2% in three months, investors were awfully close to factoring in a full blown U.S. recession. Should this be the case? In answering this question, one must certainly understand the stock market is a predicting or discounting mechanism. However, if we pull out our economic thermometers, right now there are no definitive indicators sending us to the recessionary doctor’s office. Here are a number of the indicators to review.
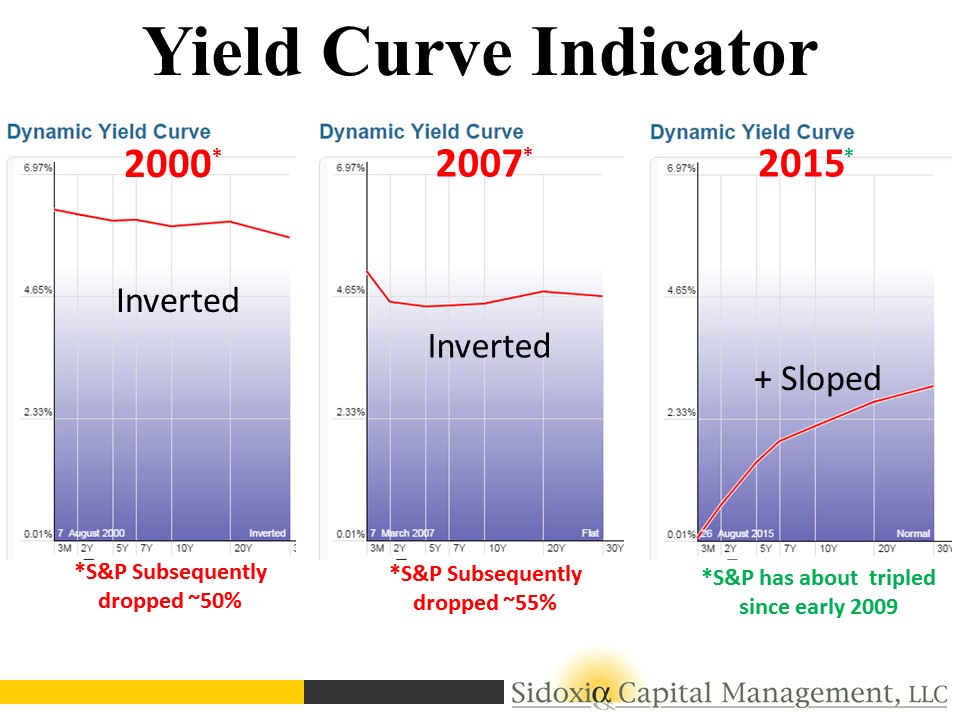
Yield Curve Indicator
For starters, let’s take a look at the yield curve. Traditionally, in a normally expanding economy, we would normally expect inflationary expectations and a term premium for holding longer maturity bonds to equate to a positively shaped yield curve (e.g., shorter term 2-Year Treasuries with interest rates lower than 30-Year Treasuries). Interestingly, historically an inverted yield curve (shorter term interest rates are higher than longer term rates) has been an excellent leading indicator and warning signal for unhealthy stock market conditions forthcoming.
As you can see in the charts below, before the two preceding recessions, in the years 2000 and 2007, we experienced an inverted yield curve that served as a tremendous warning signal in advance of significant downdrafts in stock prices. If you fast forward to today, the slope of the yield curve is fairly steeply sloped – nowhere close to inverted. When the yield curve flattens meaningfully, I will become much more cautious.
The Oil Price Indicator
There is substantial interest and focus on the recessionary conditions in the energy sector, and more specifically the high yield (junk bond) issuers that could suffer. It is true that high yield energy credit spreads have widened, but typically this sector’s pain has been the economy’s gain, and vice versa. The chart below shows that the gray shaded recessionary time periods have classically been preceded by spikes upward in oil prices. As you know, we currently are experiencing the opposite trend. Over the last 12 months, WTI oil prices have been chopped by more than half to $45 per barrel. This is effectively a massive tax for consumers, which should help support the economy.
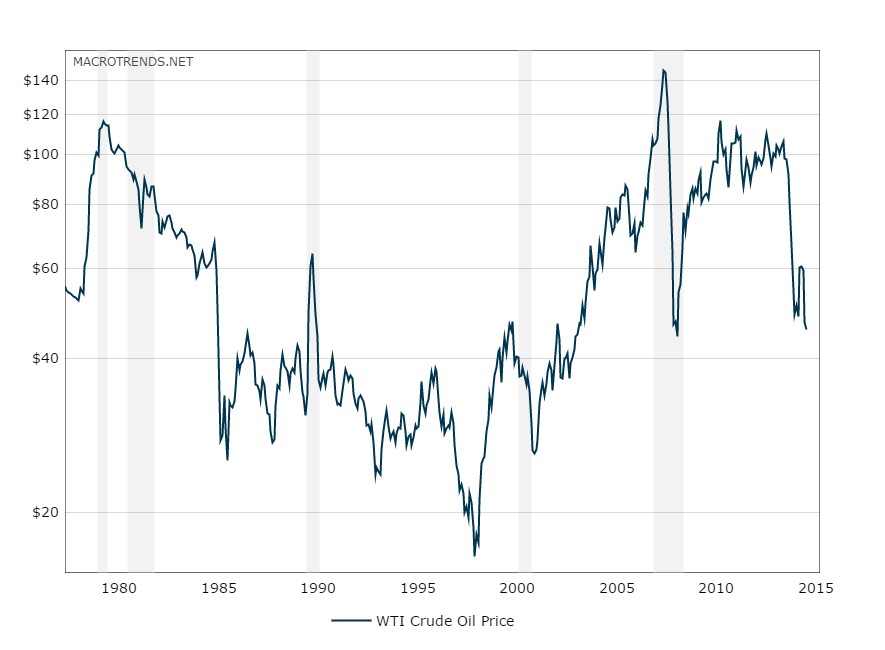
Source: MacroTrends.Net
Other Macro Statistics
Toward the top of any recession-causing, fear factor list right now is China. Slowing economic growth and an unstable Shanghai stock market has investors nervously biting their nails. Although China is the 2nd largest global economy behind the U.S., China still only accounts for about 15% of overall global economic activity, and U.S. exports to the region only account for about 0.7% of our GDP, according to veteran Value investor Bill Nygren. If on top of the China concern you layer a fairly strong U.S. labor market, an improving housing market (albeit slowly), and a recently revised higher GDP statistics, you could probably agree the economic dashboard is not signaling bright red flashing lights.
There is never a shortage of concerns to worry about, including most recently the slowing growth and stock market turbulence in China. While volatility may be implying sickness and international markets may be reaching for the Kleenex box, the yield curve, oil prices, and other macroeconomic indicators are signaling the outlook for U.S. stock remains relatively healthy.

Wade W. Slome, CFA, CFP®
Plan. Invest. Prosper.
DISCLOSURE: Sidoxia Capital Management (SCM) and some of its clients hold positions in certain exchange traded funds (ETFs) , but at the time of publishing, SCM had no direct position in any other security referenced in this article. No information accessed through the Investing Caffeine (IC) website constitutes investment, financial, legal, tax or other advice nor is to be relied on in making an investment or other decision. Please read disclosure language on IC Contact page.
Will Rising Rates Murder Market?

After an obituary of Mark Twain had been mistakenly published in the United States, Twain sent a cable from London stating, “The reports of my death have been greatly exaggerated.” Similar reports about the death of the stock market have been prematurely published as well. If you were to listen to the talking heads on TV or other self-proclaimed media pundits, the prevailing opinion is that rising interest rates will murder the stock market. In reality, the benchmark 10-Year Treasury Note has risen a whopping 0.23% so far this year. Could this be a start of a more prolonged increase in interest rates? It is certainly possible. Most investors have a very short memory because we have seen this movie before. It was just two short years ago that we witnessed a near doubling of 10-Year Treasury yields exploding from 1.76% to 3.03% in 2013. Did the stock market crater? In fact, quite the contrary. The S&P 500 index catapulted higher by a whopping +30%.
Even if we go back a litter further in recent history, interest rates were quite a bit higher. For example in early 2010, 10-Year Treasury yields breached 4.0%. Where was the Dow Jones Industrial index then? A mere 11,000 vs 17,850 today. Or in other words, when interest rates were significantly higher than today’s 2.40% yield, the stock market managed to climb +62% higher. Not too shabby, eh? As I have talked about in the past (see Don’t Be a Fool, Follow the Stool), there are other factors besides interest rates that are contributing to positive stock returns – primarily profits, valuations, and sentiment are the other key factors in determining stock prices. Suffice it to say, over the last five years, stocks have survived quite well in the face of multiple interest rate spikes; the 2013 “Taper Tantrum”; and the subsequent completion of quantitative easing – QE (see chart below).
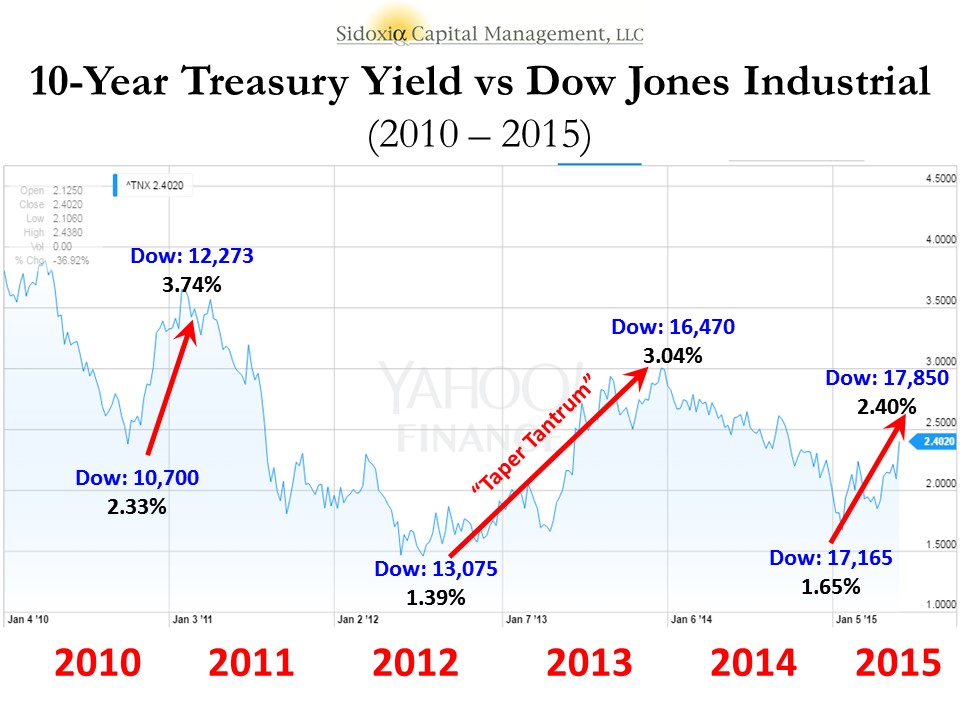
Underlying Chart: Yahoo Finance!
Yield Curve on the Side of Bulls
Despite the trepidation over a series of potential Fed rate hikes, stocks continue to grind higher. If the fears are based on the expectation of a slowing economy on the horizon, then we would generally see two things happening. First, rising short-term interest rates would cause the yield curve to flatten, and then secondly, the yield curve would invert (typically a leading indicator for a recession). Currently, there are no signs of flattening or inverting. Actually, the recent better than expected jobs report for May (280,000 jobs added vs. estimate of 226,000) created a steeper yield curve – long-term interest rates increased more than short-term interest rates. Just as I wrote in 2009 about the recovery (see Steepening Yield Curve Recovery), right now the bond market is flashing recovery…not slowdown.
In the face of the mini-interest rate spike, bank stocks are also signaling economic recovery – evidenced by the 2.75% surge in the KBW Bank Index (KBX) last week. If there were signs of dark clouds on the horizon, a flattening yield curve would squeeze bank net interest margins and profits, which ultimately would send bank investors to the exit. That phenomenon will eventually happen later in the economic cycle, but right now investors are voting in the opposite direction with their dollars.
The media, economists, strategists, and other nervous onlookers will continue fretting over the Federal Reserve’s eventual rate increases. As long as dovish Janet Yellen is at the helm of the Fed, future rate increases will be measured, and rather than murdering the stock market, the policies will merely reflect a removal of the economy from artificial life support.
Wade W. Slome, CFA, CFP®
Plan. Invest. Prosper.
DISCLOSURE: Sidoxia Capital Management (SCM) and some of its clients hold positions in certain exchange traded funds (ETFs), but at the time of publishing, SCM had no direct position in any other security referenced in this article. No information accessed through the Investing Caffeine (IC) website constitutes investment, financial, legal, tax or other advice nor is to be relied on in making an investment or other decision. Please read disclosure language on ICContact page.
Digesting Stock Gains

This article is an excerpt from a previously released Sidoxia Capital Management complementary newsletter (June 1, 2015). Subscribe on the right side of the page for the complete text.
Despite calls for “Sell in May, and go away,” the stock market as measured by both the Dow Jones Industrial and S&P 500 indexes grinded out a +1% gain during the month of May. For the year, the picture looks much the same…the Dow is up around +1% and the S&P 500 +2%. After gorging on gains of +30% in 2013 and +11% in 2014, it comes as no surprise to me that the S&P 500 is taking time to digest the gains. After eating any large pleasurable meal, there’s always a chance for some indigestion – just like last month. More specifically, the month of May ended as it did the previous six months…with a loss on the last trading day (-115 points). Providing some extra heartburn over the last 30 days were four separate 100+ point decline days. Realized fears of a Greek exit from the eurozone would no doubt have short-term traders reaching for some Tums antacid. Nevertheless, veteran investors understand this is par for the course, especially considering the outsized profits devoured in recent years.
The profits have been sweet, but not everyone has been at the table gobbling up the gains. And with success, always comes the skeptics, many of whom have been calling for a decline for years. This begs the question, “Are we in a stock bubble?” I think not.
Bubble Bites
Most asset bubbles are characterized by extreme investor/speculator euphoria. There are certainly small pockets of excitement percolating up in the stock market, but nothing like we experienced in the most recent burstings of the 2000 technology and 2006-07 housing bubbles. Yes, housing has steadily improved post the housing crash, but does this look like a housing bubble? (see New Home Sales chart)

Source: Dr. Ed’s Blog
Another characteristic of a typical asset bubble is rabid buying. However, when it comes to the investor fund flows into the U.S. stock market, we are seeing the exact opposite…money is getting sucked out of stocks like a Hoover vacuum cleaner. Over the last eight or so years, there has been almost -$700 billion that has hemorrhaged out of domestic equity funds – actions tend to speak louder than words (see chart below):
 Source: Investment Company Institute (ICI)
The shift to Exchange Traded Funds (ETFs) offered by the likes of iShares and Vanguard doesn’t explain the exodus of cash because ETFs such as S&P 500 SPDR ETF (SPY) are suffering dramatically too. SPY has drained about -$17 billion alone over the last year and a half.
With money flooding out of these stock funds, how can stock prices move higher? Well, one short answer is that hundreds of billions of dollars in share buybacks and trillions in mergers and acquisitions activity (M&A) is contributing to the tide lifting all stock boats. Low interest rates and stimulative monetary policies by central banks around the globe are no doubt contributing to this positive trend. While the U.S. Federal Reserve has already begun reversing its loose monetary policies and has threatened to increase short-term interest rates, by any objective standard, interest rates should remain at very supportive levels relative to historical benchmarks.
Besides housing and fund flows data, there are other unbiased sentiment indicators that indicate investors have not become universally Pollyannaish. Take for example the weekly AAII Sentiment Survey, which shows 73% of investors are currently Bearish and/or Neutral – significantly higher than historical averages.
The Consumer Confidence dataset also shows that not everyone is wearing rose-colored glasses. Looking back over the last five decades, you can see the current readings are hovering around the historical averages – nowhere near the bubblicious 2000 peak (~50% below).

Source: Bespoke
Recession Reservations
Even if you’re convinced there is no imminent stock market bubble bursting, many of the same skeptics (and others) feel we’re on the verge of a recession – I’ve been writing about many of them since 2009. You could choke on an endless number of economic indicators, but on the common sense side of the economic equation, typically rising unemployment is a good barometer for any potentially looming recession. Here’s the unemployment rate we’re looking at now (with shaded periods indicating prior recessions):

As you can see, the recent 5.4% unemployment rate is still moving on a downward, positive trajectory. By most peoples’ estimation, because this has been the slowest recovery since World War II, there is still plenty of labor slack in the market to keep hiring going.
An even better leading indicator for future recessions has been the slope of the yield curve. A yield curve plots interest rate yields of similar bonds across a range of periods (e.g., three-month bill, six-month bill, one-year bill, two-year note, five-year note, 10-year note and 30-year bond). Traditionally, as short-term interest rates move higher, this phenomenon tends to flatten the yield curve, and eventually inverts the yield curve (i.e., short-term interest rates are higher than long-term interest rates). Over the last few decades, when the yield curve became inverted, it was an excellent leading indicator of a pending recession (click here and select “Animate” to see amazing interactive yield curve graph). Fortunately for the bulls, there is no sign of an inverted yield curve – 30-year rates remain significantly higher than short-term rates (see chart below).

Stock market skeptics continue to rationalize the record high stock prices by pointing to the artificially induced Federal Reserve money printing buying binge. It is true that the buffet of gains is not sustainable at the same pace as has been experienced over the last six years. As we continue to move closer to full employment in this economic cycle, the rapid accumulated wealth will need to be digested at a more responsible rate. An unexpected Greek exit from the EU or spike in interest rates could cause a short-term stomach ache, but until many of the previously mentioned indicators reach dangerous levels, please pass the gravy.
Wade W. Slome, CFA, CFP®
Plan. Invest. Prosper.
DISCLOSURE: Sidoxia Capital Management (SCM) and some of its clients hold positions in SPY and other certain exchange traded funds (ETFs), but at the time of publishing, SCM had no direct position in any other security referenced in this article. No information accessed through the Investing Caffeine (IC) website constitutes investment, financial, legal, tax or other advice nor is to be relied on in making an investment or other decision. Please read disclosure language on IC Contact page.
Is Good News, Bad News?

The tug-of-war is officially on as investors try to decipher whether good news is good or bad for the stock market? On the surface, the monthly January jobs report released by the Bureau of Labor Statistics (BLS) appeared to be welcomed, positive data. Total jobs added for the month tallied +257,000 (above the Bloomberg consensus of +230,000) and the unemployment rate registered 5.7% thanks to the labor participation rate swelling during the month (see chart below). More specifically, the number of people looking for a job exceeded one million, which is the largest pool of job seekers since 2000.
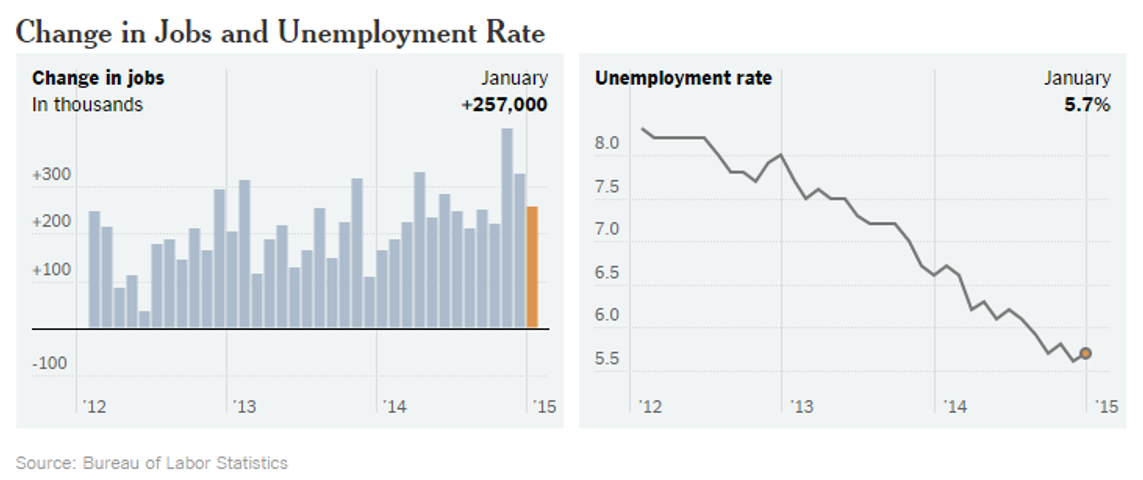
Source: BLS via New York Times
Initially the reception by stocks to the jobs numbers was perceived positively as the Dow Jones Industrial index climbed more than 70 points on Friday. Upon further digestion, investors began to fear an overheated employment market could lead to an earlier than anticipated interest rate hike by the Federal Reserve, which explains the sell-off in bonds. The yield on the 10-Year Treasury proceeded to spike by +0.13% before settling around 1.94% – that yield compares to a recent low of 1.65% reached last week. The initial euphoric stock leap eventually changed direction with the Dow producing a -180 point downward reversal, before the Dow ended the day down -62 points for the session.
Crude Confidence?
The same confusion circling the good jobs numbers has also been circulating around lower oil prices, which on the surface should be extremely positive for the economy, considering consumer spending accounts for roughly 70% of our country’s economic output. Lower gasoline prices and heating bills means more discretionary spending in the pockets of consumers, which should translate into more economic activity. Furthermore, it comes as no surprise to me that oil is both figuratively and literally the lubricant for moving goods around our country and abroad, as evidenced by the Dow Jones Transportation index that has handily outperformed the S&P 500 index over the last 18 months. While this may truly be the case, many journalists, strategists, economists, and analysts are nevertheless talking about the harmful deflationary impacts of declining oil prices. Rather than being viewed as a stimulative lubricant to the economy, many of these so-called pundits point to low oil prices as a sign of weak global activity and an omen of worse things to come.
This begs the question, as I previously explored a few years ago (see Good News=Good News?), is it possible that good news can actually be good news? Is it possible that lower energy costs for oil importing countries could really be stimulative for the global economy, especially in regions like Europe and Japan, which have been in a decade-long funk? Is it possible that healthier economies benefiting from substantial job creation can cause a stingy, nervous, and scarred corporate boardrooms to finally open up their wallets to invest more significantly?
Interest Rate Doom May Be Boom?
Quite frankly, all the incessant, never-ending discussions about an impending financial market Armageddon due to a potential single 0.25% basis point rate hike seem a little hyperbolic. Could I be naively whistling past the graveyard? From my perspective, although it is a foregone conclusion the Fed will have to increase interest rates above 0%, this is nothing new (I’m really putting my neck out there on this projection). Could this cause some volatility when it finally happens…of course. Just look at what happened to financial markets when former Federal Reserve Chairman Ben Bernanke merely threatened investors with a wind-down of quantitative easing (QE) in 2013 and investors had a taper tantrum. Sure, stocks got hit by about -5% at the time, but now the S&P 500 index has catapulted higher by more than +25%.
Looking at how stocks react in previous rate hike cycles is another constructive exercise. The aggressive +2.50% in rate hikes by former Fed Chair Alan Greenspan in 1995 may prove to be a good proxy (see also 1994 Bond Repeat?). After suffering about a -10% correction early in 1994, stocks rallied in the back-half to end the year at roughly flat.
And before we officially declare the end of the world over a single 0.25% hike, let’s not forget that the last rate hike cycle (2004 – 2006) took two and a half years and 17 increases in the targeted Federal Funds rate (1.00% to 5.25%). Before the rate increases finally broke the stock market’s back, the bull market moved about another +40% higher…not too shabby.
Lastly, before writing the obituary of this bull market, it’s worth noting the yield curve has been an incredible leading indicator and currently this gauge is showing zero warnings of any dark clouds approaching on the horizon (see chart below). As a matter of fact, over the last 50 years or so, the yield curve has turned negative (or near 0%) before every recession.
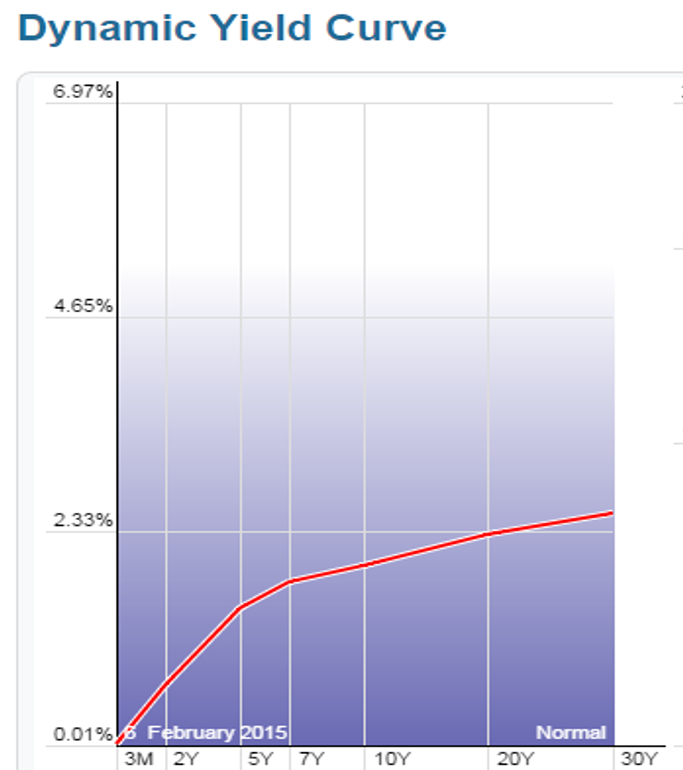
Source: StockCharts.com
As the chart above shows, the yield curve remains very sloped despite modest flattening in recent quarters.
While many skeptics are having difficulty accepting the jobs data and declining oil prices as good news because of rate hike fears, history shows us this position could be very misguided. Perhaps, once again, this time around good news may actually be good news.
Wade W. Slome, CFA, CFP®
Plan. Invest. Prosper.
DISCLOSURE: Sidoxia Capital Management (SCM) and some of its clients hold positions in certain exchange traded funds (ETFs), but at the time of publishing SCM had no direct position in any other security referenced in this article. No information accessed through the Investing Caffeine (IC) website constitutes investment, financial, legal, tax or other advice nor is to be relied on in making an investment or other decision. Please read disclosure language on IC Contact page.
Risk of “Double-Rip” on the Rise

Okay, you heard it here first. I’m officially anointing my first new 2013 economic term of the year: “Double-Rip!” No, the biggest risk of 2013 is not a “double-dip” (the risk of the economy falling back into recession), but instead, the larger risk is of a double-rip – a sustained expansion of GDP after multiple quarters of recovery. I know, this sounds like heresy, given we’ve had to listen to perma-bears like Nouriel Roubini, Peter Schiff, John Mauldin, Mohamed El-Erian, Bill Gross, et al shovel their consistently wrong pessimism for the last 14 quarters. However, those readers who have followed me for the last four years of this bull market know where I’ve stood relative to these unwavering doomsday-ers. Rather than endlessly rehash the erroneous gospel spewed by this cautious clan, you can decide for yourself how accurate they’ve been by reviewing the links below and named links above:
Roubini calling for double-dip in 2012
Roubini calling for double-dip in 2011
Roubini calling for double-dip in 2010
Roubini calling for double-dip in 2009
If we switch from past to present, Bill Gross has already dug himself into a deep hole just two weeks into the year by tweeting equity markets will return less than 5% in 2013. Hmmm, I wonder if he’d predict the same thing now that the market is up about +4.5% during the first 18 days of the year?
Why Double-Rip Over Double-Dip?

How can stocks rip if economic growth is so sluggish? If forced to equate our private sector to a car, opinions would vary widely. We could probably agree the U.S. economy is no Ferrari. Faster growing countries like China, which recently reported 4th quarter growth of +7.9% (up from +7.4% in 3rd quarter), have lapped us complacent, right-lane driving Americans in recent years. But speed alone should not be investors’ only key objective. If speed was the number one priority, the only places investors would be placing their money would be in countries like Rwanda, Turkmenistan, and Libya (see Business Insider article). However, freedom, rule of law, and entrepreneurial spirit are other important investment factors to be considered. The U.S. market is more like a Toyota Camry – not very flashy, but it will reliably get you from point A to point B in an efficient and safe manner.
Beyond lackluster economic growth, corporate profit growth has slowed remarkably. In fact, with about 10% of the S&P 500 index companies reporting 4th quarter earnings thus far, earnings growth is expected to rise a measly 2.5% from a year ago (from a previous estimate of 3.0% growth). With this being the case, how can stock prices go up? Shrewd investors understand the stock market is a discounting mechanism of future fundamentals, and therefore stocks will move in advance of future growth. It makes sense that before a turn in the economy, the brakes will often be activated before accelerating into another fast moving straight-away.
In addition, valuation acts like shock absorbers. With generational low interest rates and a below-average forward 12-month P/E (Price-Earnings) ratio of 13x’s, this stock market car can absorb a significant amount of fundamental challenges. The oft quoted message that “In the short run, the market is a voting machine but in the long run it is a weighing machine,” from value icon Benjamin Graham holds as true today as it did a century ago. The recent market advance may be attributed to the voters, but long-term movements are ultimately tied to the sustainable scales of sales, earnings, and cash flows.
If that’s the case, how can someone be optimistic in the face of the slowing growth challenges of this year? What 2013 will not have is the drag of election uncertainty, the fiscal cliff, Superstorm Sandy, and an end-of-the-world Mayan calendar concern. This is setting the stage for improved fundamentals as we progress deeper into the year. Certainly there will be other puts and takes, but the absence of these factors should provide some wind under the economy’s sails.
What’s more, history shows us that indeed stock prices can go up quite dramatically (more than +325% during the 1990s) when consensus earnings forecasts continually get trimmed. We have seen this same dynamic since mid-2012 – earnings forecasts have come down and stock prices have gone up. Strategist Ed Yardeni captures this point beautifully in a recent post on his Dr. Ed’s Blog (see charts below).
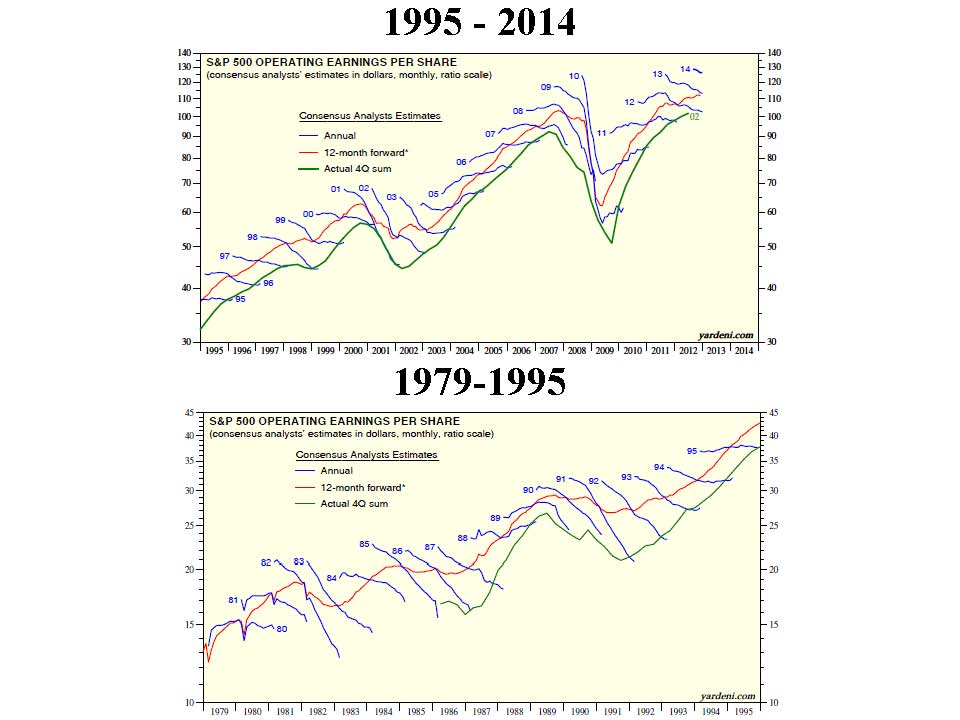
CLICK TO ENLARGE – Source: Dr. Ed’s Blog
What Will Make Me Bearish?
Am I a perma-bull, incessantly wearing rose-colored glasses that I refuse to take off? I’ll let you come to your own conclusion. When I see a combination of the following, I will become bearish:
#1. I see the trillions of dollars parked in near-0% cash start coming outside to play.
#2. See Pimco’s Bill Gross and Mohammed El-Erian on CNBC fewer than 10 times per week.
#3. See money flow stop flooding into sub-3% bonds (Scott Grannis) and actually reverse.
#4. Observe a sustained reversal in hemorrhaging of equity investments (Scott Grannis).
#5. Yield curve flattens dramatically or inverts.
#6. Nouriel and his bear buds become bullish and call for a “triple-rip” turn in the equity markets.
#7. Smarter, more-experienced investors than I, á la Warren Buffett, become more cautious. I arrogantly believe that will occur in conjunction with some of the previously listed items.
Despite my firm beliefs, it is evident the bears won’t go down without a fight. If you are getting tired of drinking the double-dip Kool-Aid, then perhaps it’s time to expand your bullish horizons. If not, just wait 12 months after a market rally, and buy yourself a fresh copy of the Merriam-Webster dictionary. There you can locate and learn about a new definition…double-rip!
Read Also: Double-Dip Guesses are “Probably Wrong”
Wade W. Slome, CFA, CFP®
Plan. Invest. Prosper.
DISCLOSURE: Sidoxia Capital Management (SCM) and some of its clients hold positions in certain exchange traded funds (ETFs), but at the time of publishing SCM had no direct position in Fiat, Toyota, or any other security referenced in this article. No information accessed through the Investing Caffeine (IC) website constitutes investment, financial, legal, tax or other advice nor is to be relied on in making an investment or other decision. Please read disclosure language on IC Contact page.
Does Double-Dip Pass Duck Test?

If it looks like a duck, walks like a duck, and quacks like a duck, then chances are it is a duck. Regrettably, not everything passes the common “duck test” when it comes to judging the state of the economy. The prevailing opinion is the economy is on the brink of falling into another double-dip recession. Driving this sentiment has been the relentless focus on the softening short-term data (e.g., weekly jobless claims, monthly retail sales, daily dollar index, etc.). I’m no prophet or Nostradamus when it comes to picking the direction of the market, but if you consider the status of the steep Treasury yield curve, the perceived sitting duck economy may actually just be something completely different – perhaps one of those oily birds recovering from the BP oil spill.
Pictures Worth Thousands of Words
Despite all the talk of “double-dip”, the curve’s extreme slope is still near record levels achieved over the last quarter century. Here’s what the Treasury snapshot looks like now:

Graph source: The Financial Times
Does this look like an inverted yield curve, which ordinarily precedes an economy falling into recession? Quite the opposite – this picture looks more like a ramp from which Evel Knievel is about to jump. Maybe Federal Reserve Chairman Ben Bernanke is actually the daredevil himself by setting artificially low interest rates for extended periods of time? If so, it’s possible the economy will suffer a fate like Mr. Knievel’s at Caesar’s Palace, but my guess is we are closer to the take-off than landing based on the yield curve.
I’ve recently harped on the wide range of “double-dip” guesses made by economists and strategists (see “Probably” Wrong article), but if that was not enough for you, here are a few more cheery views taken from this weekend’s Barron’s magazine and a few other publications of choice:
Kopin Tan (Barron’s): “The Treasuries camp is expecting another recession… In reality, with retailers and customers alike eyeing a second recession this year, it’s a season of anxiety.”
John Crudele (NY Post): “We’ll get a correction that’ll put the words ‘double-dip’ back into the headlines… When the final figures are produced years from now, historians might just decide that this was just one long downturn — not a series of dips.”
Jeremy Cook (Chief Economist-World First): “This will further heighten fears that the US economy is careening into the dreaded double-dip recession.”
How can the double-dippers be wrong? For starters, as I alluded to earlier, we are nowhere near an inverted yield curve. The 10-Year Treasury Note currently yields 2.62% while the T-Bill a measly 0.15%, creating a spread of about +2.47% (a long distance from negative).

As this chart implies, and others confirm, over the last 50 years or so, the yield curve has turned negative (or near 0% in the late 1950s and early 1960s) before every recession. Admittedly, before the soft-patch in economic data-points, the steepness was even greater than now (closer to 3.5%). Maybe the double-dippers are just more prescient than history has been as a guide, but until we start flirting with sub-1% spreads, I’ll hold off on sweating bullets. Less talked about now is the possibility of stagflation (stagnant inflation). I’m not in that camp, but down the road I see this as a larger risk than the imminent double-dip scenario.
I’m not in the business of forecasting the economy, and history books are littered with economists that come and go in glory and humiliation. And although it’s fun guessing on what will or will not happen with the economy, I rather choose to follow the philosophy of the great Peter Lynch (see my profile of Lynch):
“If you spend more than 13 minutes analyzing economic and market forecasts, you’ve wasted 10 minutes.”
Along those same lines, he adds:
“Assume the market [economy] is going nowhere and invest accordingly.”
I choose to spend my time hunting and investing in opportunities all over the map. With fear and anxiety high, fortunately for me and my clients, I am finding more attractive prospects. While some get in the stale debate of stocks versus bonds, there are appealing openings across the whole capital structure, geographies, and the broad spectrum of asset classes. So, as others look to test whether the economic animal is a bear, bull, or duck, I’ll continue sniffing away for opportunities like a bloodhound.
Wade W. Slome, CFA, CFP®
Plan. Invest. Prosper.
*DISCLOSURE: Sidoxia Capital Management (SCM) and some of its clients own certain exchange traded funds, but at the time of publishing SCM had no direct position in BP or any security referenced in this article. No information accessed through the Investing Caffeine (IC) website constitutes investment, financial, legal, tax or other advice nor is to be relied on in making an investment or other decision. Please read disclosure language on IC “Contact” page.
Cockroach Consumer Cannot be Exterminated

We’re told that cockroaches would inherit the earth if a nuclear war were to occur, due to the pests’ impressive resiliency. Like a cockroach, the American consumer has managed to survive its own version of a financial nuclear war, as a result of the global debt binge and bursting of the real estate bubble. Although associating a consumer to a disease-carrying cockroach is not the most flattering comparison, I suppose it is okay since I too am a consumer (cockroach).
Confidence Cuisine
Cockroaches enjoy feasting on food, but they have been known to live close to a month without food, two weeks without water, and a half hour without air while submerged in water. On the other hand, consumers can’t live that long without food, water, and oxygen, but what really feeds buyer purchasing patterns is confidence. The April Consumer Confidence number from the Confidence Board showed the April reading reaching the highest level since September 2008. On a shorter term basis, the April figure measured in at 57.9, up from 52.3 in the previous month.
Where is all this buying appetite coming from? What we’re witnessing is merely a reversal of what we experienced in the previous years. In 2008 and 2009 more than 8 million jobs were shed and the fear-induced spiraling of confidence pushed consumers’ buying habits into a cave. With +290,000 new jobs added in April, the fourth consecutive month of additions, the tide has turned and consumers are coming out to see the sun and smell the roses. Recently the Bureau of Economic Analysis (BEA) revealed real personal consumption expenditures grew +3.6% in the first quarter – the largest quarterly increase in consumer spending since the first quarter of 2007.
Sure, there still are the “double-dippers” predicting an impending recession once the sugar-high stimulus wears off and tax increases kick-in. From my perch, it’s difficult for me to gauge the timing of any future slowing, other than to say I have not been surprised by the timing or magnitude of the rebound (I was writing about the steepening yield curve and the end of the recession last June and July, respectively). Sometimes, the farther you fall, the higher you will bounce. Rather than try to time or predict the direction of the market (see market timing article), I look, rather, to exploit the opportunities that present themselves in volatile times (e.g., your garden variety Dow Jones -1,000 point hourly plunge).
Will the Trend End?
Can this generational rise in consumer spending continue unabated? Probably not. To some extent we are victims of our own success. As about 25% of global GDP and only 5% of the world’s population, changing directions of the U.S.A. supertanker is becoming increasingly more difficult.

Source: The New York Times (Economix)
However, more nimble, resource-rich developing countries have fewer demographic and entitlement-driven debt issues like many developed countries. In order to build on an envious standard of living, our country needs to build on our foundation of entrepreneurial capitalism by driving innovation to create higher paying jobs. With those higher paying jobs will come higher spending. Of course, if uncompetitive industries cannot compete in the global marketplace, and a mirage of spending is re-created through drug-like credit cards and excess leveraged corporate lending, then heaven help us. Even the impressively resilient cockroach will not be able to survive that scenario.
Read full New York Times article here
Wade W. Slome, CFA, CFP®
Plan. Invest. Prosper.
*DISCLOSURE: Sidoxia Capital Management (SCM) and some of its clients own certain exchange traded funds, but at the time of publishing SCM had no direct positions in any security referenced in this article. No information accessed through the Investing Caffeine (IC) website constitutes investment, financial, legal, tax or other advice nor is to be relied on in making an investment or other decision. Please read disclosure language on IC “Contact” page.


